


文章目录
基于重标极差(R/S)分析方法基础上的赫斯特指数,是作为判断时间序列数据遵从随机游走还是有偏的随机游走过程的指标,简单来讲:就是判断“大势所趋”里的“大势”是什么
Hurst的值域是 [0,1]
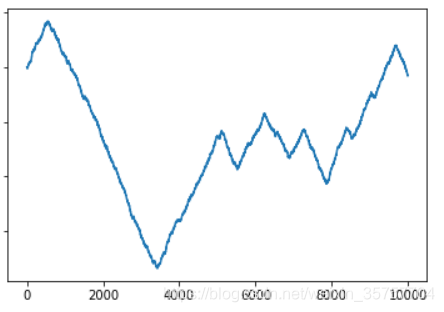
若Hurst指数> 0.5,序列具有长期记忆性,未来的增量和过去的增量相关,继续保持现有趋势的可能性强。
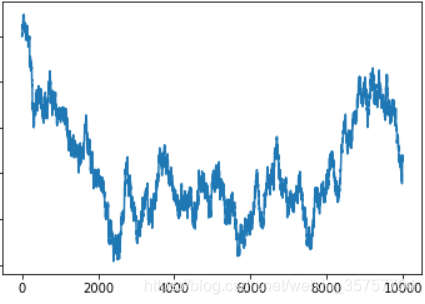
若Hurst 指数< 0.5,很有可能是记忆的转弱,趋势结束和反转的开始(mean reversion)。
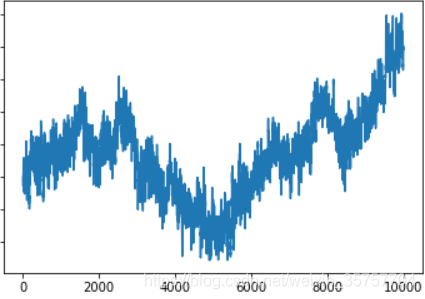
若Hurst指数= 0.5,序列接近随机游走(Random Walk),无定向运动。
图来自:https://github.com/Mottl/hurst/blob/master/README.md
代码修改自:https://github.com/Mottl/hurst/blob/master/hurst/init.py
Hurst不同值对应的图
Hurst = 0.5,即无序:
Hurst=0.7,即预计趋势与前一刻相同,由于结尾的时候是下降趋势,因此预计即将下降
Hurst = 0.3,即预计趋势与前一刻相反,由于结尾是下降趋势,因此预计即将向上走
代码
import sys
import math
import numpy as np
import pandas as pd
import matplotlib.pyplot as plt


def compute_hc(series, kind="price", min_window=10, max_window=None, simplified=True):
    def __to_inc(x):
        incs = x[1:] - x[:-1]
        return incs

    def __to_pct(x):
        pcts = x[1:] / x[:-1] - 1.
        return pcts

    def __get_simplified_RS(series, kind):
        """
        Simplified version of rescaled range

        Parameters
        ----------

        series : array-like
            (Time-)series
        kind : str
            The kind of series (refer to compute_Hc docstring)
        """

        if kind == 'random_walk':
            incs = __to_inc(series)
            R = max(series) - min(series)  # range in absolute values
            S = np.std(incs, ddof=1)
        elif kind == 'price':
            pcts = __to_pct(series)
            R = max(series) / min(series) - 1.  # range in percent
            S = np.std(pcts, ddof=1)
        elif kind == 'change':
            incs = series
            _series = np.hstack([[0.], np.cumsum(incs)])
            R = max(_series) - min(_series)  # range in absolute values
            S = np.std(incs, ddof=1)

        if R == 0 or S == 0:
            return 0  # return 0 to skip this interval due the undefined R/S ratio

        return R / S

    def __get_RS(series, kind):
        """
        Get rescaled range (using the range of cumulative sum
        of deviations instead of the range of a series as in the simplified version
        of R/S) from a time-series of values.

        Parameters
        ----------

        series : array-like
            (Time-)series
        kind : str
            The kind of series (refer to compute_Hc docstring)
        """

        if kind == 'random_walk':
            incs = __to_inc(series)
            mean_inc = (series[-1] - series[0]) / len(incs)
            deviations = incs - mean_inc
            Z = np.cumsum(deviations)
            R = max(Z) - min(Z)
            S = np.std(incs, ddof=1)

        elif kind == 'price':
            incs = __to_pct(series)
            mean_inc = np.sum(incs) / len(incs)
            deviations = incs - mean_inc
            Z = np.cumsum(deviations)
            R = max(Z) - min(Z)
            S = np.std(incs, ddof=1)

        elif kind == 'change':
            incs = series
            mean_inc = np.sum(incs) / len(incs)
            deviations = incs - mean_inc
            Z = np.cumsum(deviations)
            R = max(Z) - min(Z)
            S = np.std(incs, ddof=1)

        if R == 0 or S == 0:
            return 0  # return 0 to skip this interval due undefined R/S

        return R / S

    """
    series : array-like
        (Time-)series

    kind : str
        Kind of series
        possible values are 'random_walk', 'change' and 'price':
        - 'random_walk' means that a series is a random walk with random increments;
        - 'price' means that a series is a random walk with random multipliers;
        - 'change' means that a series consists of random increments
            (thus produced random walk is a cumulative sum of increments);

    min_window : int, default 10
        the minimal window size for R/S calculation

    max_window : int, default is the length of series minus 1
        the maximal window size for R/S calculation

    simplified : bool, default True
        whether to use the simplified or the original version of R/S calculation

    Returns tuple of
        H, c and data
        where H and c — parameters or Hurst equation
        and data is a list of 2 lists: time intervals and R/S-values for correspoding time interval
        for further plotting log(data[0]) on X and log(data[1]) on Y
    """

    if len(series) < 100:
        raise ValueError("Series length must be greater or equal to 100")

    ndarray_likes = [np.ndarray]
    if "pandas.core.series" in sys.modules.keys():
        ndarray_likes.append(pd.core.series.Series)

    # convert series to numpy array if series is not numpy array or pandas Series
    if type(series) not in ndarray_likes:
        series = np.array(series)

    if "pandas.core.series" in sys.modules.keys() and type(series) == pd.core.series.Series:
        if series.isnull().values.any():
            raise ValueError("Series contains NaNs")
        series = series.values  # convert pandas Series to numpy array
    elif np.isnan(np.min(series)):
        raise ValueError("Series contains NaNs")

    if simplified:
        RS_func = __get_simplified_RS
    else:
        RS_func = __get_RS

    err = np.geterr()
    np.seterr(all='raise')

    max_window = max_window or len(series) - 1
    window_sizes = list(map(
        lambda x: int(10 ** x),
        np.arange(math.log10(min_window), math.log10(max_window), 0.25)))
    window_sizes.append(len(series))

    RS = []
    for w in window_sizes:
        rs = []
        for start in range(0, len(series), w):
            if (start + w) > len(series):
                break
            _ = RS_func(series[start:start + w], kind)
            if _ != 0:
                rs.append(_)
        RS.append(np.mean(rs))

    A = np.vstack([np.log10(window_sizes), np.ones(len(RS))]).T
    H, c = np.linalg.lstsq(A, np.log10(RS), rcond=-1)[0]
    np.seterr(**err)

    c = 10 ** c
    return H, c, [window_sizes, RS]


if __name__ == '__main__':
    arr = np.arange(1, 200)
    np.random.shuffle(arr) # arr为ndarry结构的数据,使用shuffle打乱
    # hurst_exponent即为赫斯特指数,值域[0,1]
    # c 为 赫斯特参数
    # data 为list,data[0]为对应时间的R值,data[1]为对应时间的S值
    hurst_exponent, c, data = compute_hc(arr)
    plt.plot(arr)
    plt.show()
    print(hurst_exponent)
其他参考文章:
METATRADER 5 — 交易(计算赫斯特指数):https://www.mql5.com/zh/articles/2930


 251
251

 被折叠的 条评论
为什么被折叠?
被折叠的 条评论
为什么被折叠?
 到【灌水乐园】发言


