


刻度定位及刻度格式
import matplotlib.pyplot as pltimport numpy as npfrom matplotlib.ticker import AutoMinorLocator, MultipleLocator, FuncFormatterx = np.linspace(0.1,5,100)y = np.sin(x)fig = plt.figure(figsize=(10,10))ax = fig.add_subplot(111)ax.xaxis.set_major_locator(MultipleLocator(1)) # 设置主刻度线位置ax.yaxis.set_major_locator(MultipleLocator(1)) # 设置次刻度线位置ax.xaxis.set_minor_locator(AutoMinorLocator(4)) # 设置主刻度线位置ax.yaxis.set_minor_locator(AutoMinorLocator(4)) # 设置次刻度线位置def minor_tick(x,pos): if not x%1: return "" return "%.2f" %xax.xaxis.set_minor_formatter(FuncFormatter(minor_tick)) # 设置次要7ax.tick_params('y',which='major', # 刻度样式 主 length=15,width=2.0, color='r') # 主刻度颜色ax.tick_params(which='minor', # 设置刻度样式 次 length=5,width=1, # 设置刻度长度,宽度 labelsize=10,labelcolor='.25')ax.set_xlim(1,4)ax.set_ylim(0,2)ax.plot(x,y,c=(.25,.25,1), lw=2, zorder=10)ax.plot(x,y,c=(.25,.25,1), lw=2, zorder=0)ax.grid(linestyle='-',linewidth=.5,color='r',zorder=0)ax.grid(linestyle='-',linewidth=.5,color='r',zorder=10)ax.grid(linestyle='--',linewidth=.5,color='.25',zorder=0)plt.show()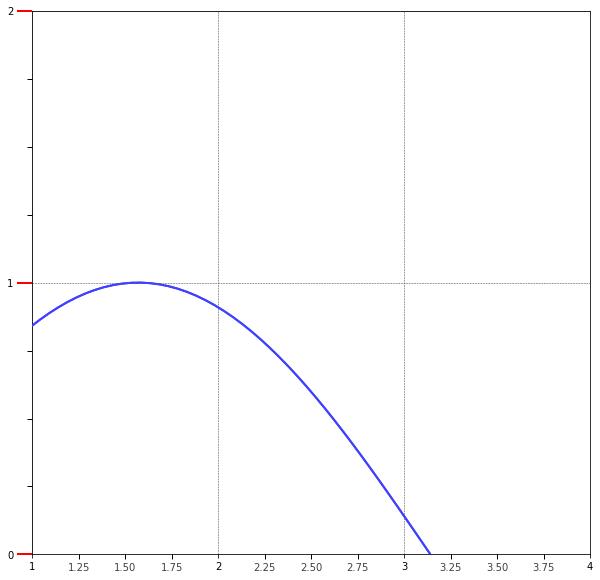
坐标轴刻度标签和刻度线样式调整
fig = plt.figure(facecolor=(1,1,0.9))ax = fig.add_axes([.1,.4,.5,.5]) #生成Figure实例for ticklabel in ax.xaxis.get_ticklabels(): #x轴实例 textlabel ticklabel.set_color('slateblue') ticklabel.set_fontsize(18) ticklabel.set_rotation(30) for tickline in ax.yaxis.get_ticklines(): #y轴实例 textline tickline.set_color('lightgreen') tick 最低0.47元/天 解锁文章


 1315
1315


 被折叠的 条评论
为什么被折叠?
被折叠的 条评论
为什么被折叠?
 到【灌水乐园】发言


