


文章目录
I. Motivation
High-frequency traders (HFTs) are market participants that are characterized by the high speed (typically in milliseconds level) with which they react to incoming news, the low inventory on their books, and the large number of trades they execute (SEC, 2010). According to Breckenfelder (2019, WP), The high-frequency trading industry grew rapidly since its inception in the mid-2000s and has represented about 50% of trading in US equity markets by 2017 (down from a 2009 peak, when it topped 60%).
In academia, there is a decade-long debate regarding whether HFTs benefit or harm market quality. Some argues that HFTs increase price discovery by systematically correcting the in-attention of human traders and inducing the public information to be incorporated into the stock prices more promptly (e.g., Chordia and Miao, 2020 JAE; Bhattacharya et al., 2020 RAS). Others believe that the predatory behaviour of HFTs, which dampens other market participants’ information acquisition incentives, must have harmed market effieciency (e.g., Ahmed et al., 2020 JAR; Lee and Watts, 2021 TAR).
Either way, there are two things that can be assured.
- HFTs have played a big part in today’s capital market.
- To cope with today’s high-frequency capital market, scholars need to grapple with high-frequency trading data (typically in second-level before 2014 and millisecond level after 2014) to unravel the latest market micro-structure.
In this blogpost, I will introduce how to extract second/millisecond-level trade and quotes data from the WRDS-TAQ database. Such data is typically used for intra-day event studies (e.g., Rogers et al., 2016 RAS; Rogers et al., 2017 JAR). For people who are familar with the WRDS data structure, you can directly access the SAS code via this link .
II. Project Description
Project Purpose
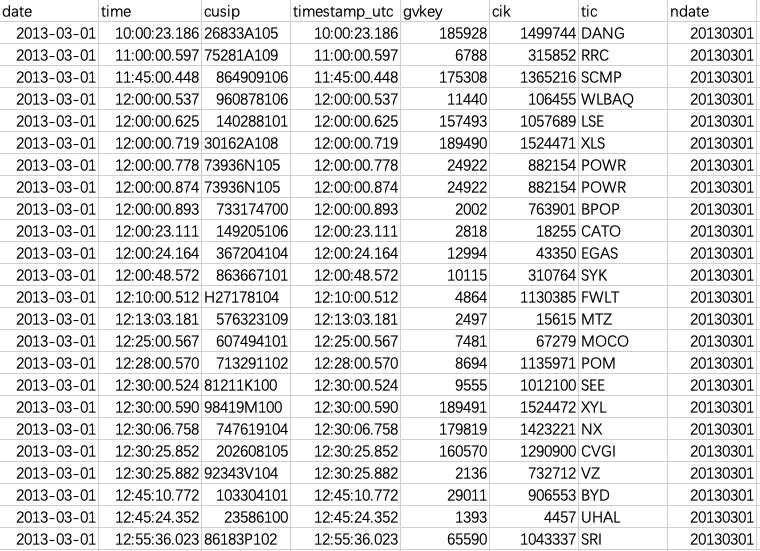
I got time stamps for firm-related events and want to get all the trade and quotes records 15 miniutes before and after the event time. Like any other event studies, the events happened in different days.
Challenges
Due to the huge size of the everyday market order flows, WRDS-TAQ database saves the daily trade and quotes data separately for each day. That means if the events in our sample happened in 2000 unique trading days, we have to query 2000 different trade datasets and another 2000 different quote datasets in the WRDS-TAQ database.
To help the readers get an intuition about the size of the trade and quotes data, I extracted the trade records during two trading hours on December 5th, 2014. It appears that 13,197,152 trades were executed in that just two trading hours, not to mention the even (sometimes much more) bigger quote records.
NOTE: There were 13197152 observations read from the data set TAQ.CT_20141205.
      WHERE ((time>=' 9:30:00'T and time<='10:30:00'T) or (time>='15:00:00'T
      and time<='16:00:59'T));
III. Data Source: WRDS-TAQ database
Daily TAQ (Trade and Quote) provides users with access to all trades and quotes for all issues traded on NYSE, Nasdaq and the regional exchanges for the previous trading day. It’s a comprehensive history of daily activity from NYSE markets and the U.S. Consolidated Tape covering all U.S. Equities instruments (including all CTA and UTP participating markets). One can find more details about the WRDS-TAQ database in WRDS-TAQ User Guide. For those who are familiar with the TAQ database, you can jump via this link.
Markets Covered
The Daily TAQ database covers:
- All CTA Participating Markets – Tapes A, B and C
- NYSE
- Nasdaq (OTC)
- All Regionals Exchanges
Dataset Description
-
Daily TAQ Trades File (Daily @ 9:00 PM EST;
 最低0.47元/天 解锁文章


 被折叠的 条评论
为什么被折叠?
被折叠的 条评论
为什么被折叠?
 到【灌水乐园】发言


