


Title
题目
A visual-language foundation model for computational pathology
计算病理学的视觉语言基础模型
01
文献速递介绍
数字病理学的快速普及和深度学习的进步使得可以开发出针对各种疾病和患者群体的各种病理学任务的强大模型。然而,由于医学领域标签稀缺,模型训练通常很困难,并且模型的使用受到其训练的具体任务和疾病的限制。此外,组织病理学中的大多数模型仅利用图像数据,与人类相互教导和推理组织病理学实体的方式形成鲜明对比。我们介绍了一种名为CONtrastive learning from Captions for Histopathology(CONCH)的视觉-语言基础模型,它是使用各种来源的组织病理学图像、生物医学文本以及特别是超过117万个图像-标题对进行的任务无关预训练。在一系列14个多样化基准测试中评估,CONCH可以迁移到涉及组织病理学图像和/或文本的各种下游任务,实现了组织学图像分类、分割、标题生成以及文本到图像和图像到文本检索的最新性能。CONCH代表了对于组织病理学的并行视觉-语言预训练系统的实质性飞跃,有可能直接促进广泛的基于机器学习的工作流程,减少或不需要进一步的有监督微调。
Results
结果
Zero-shot classification of diverse tissues and diseases
Contrastively aligned visual-language pretraining allows the model to be directly applied to downstream classification tasks without requiring further labeled examples for supervised learning or fine-tuning. This zero-shot transfer capability allows a single pretrained foundation model to be applied off the shelf to different downstream datasets with an arbitrary number of classes compared with the current paradigm of training a new model for every new task. While we do not expect zero-shot classification to currently be sufficiently accurate for most clinical use cases, in some tasks, we found CONCH to perform surprisingly well, and it may serve as a strong baseline for conventional supervised learning, especially when training labels are scarce.
多样组织和疾病的零样本分类
对比对齐的视觉-语言预训练使模型能够直接应用于下游分类任务,无需进一步的有监督学习或微调所需的标记示例。这种零样本迁移能力使得单一预训练基础模型可以立即应用于不同的下游数据集,与当前为每个新任务训练新模型的范例相比,这些任务可能包含任意数量的类别。虽然我们目前不指望零样本分类在大多数临床用例中足够准确,但在某些任务中,我们发现CONCH表现出了出人意料的良好表现,它可能作为传统有监督学习的强大基准,特别是在训练标签稀缺时。
Figure
图
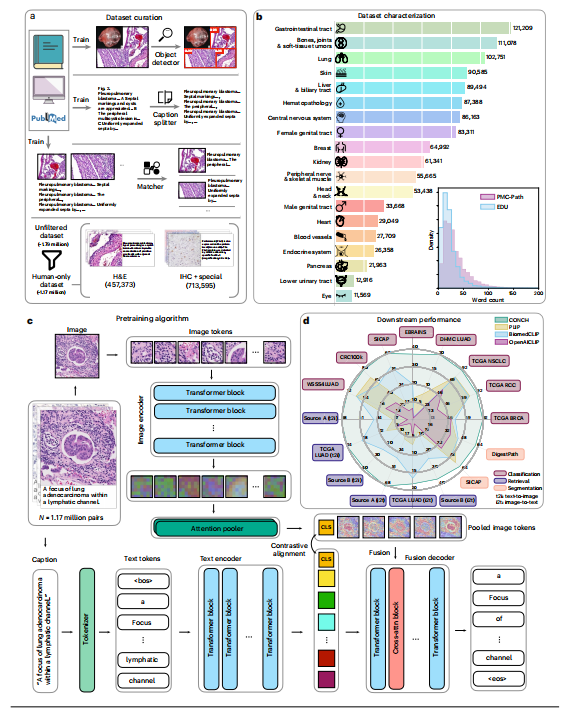
Fig. 1 | Data curation and model schematic. a, Automated data cleaning pipeline. Educational sources (EDU) and parts of the PubMed Central Open Access Dataset (PMC OA) were manually cleaned and used to train an object detector to detect histopathology images, a language model to split captions referring to multiple images and a matching model to match detected images to their corresponding captions. The cleaning process yielded a dataset of 1.79 million image–text pairs, and we then filtered out pairs referring to nonhumans to create our CONCH (human-only) pretraining dataset of 1.17 million (see Methods for details on data cleaning and Discussion on ablation experiments investigating data filtering). b, Estimated distribution of image–text pairs in the human-only pretraining dataset by topic. Note that pretraining data cover a diverse range of pathology topics. Inset, comparison of the distribution of caption lengths between PMC-Path and EDU (see Extended Data Fig. 1 for wordclouds of captions from each category). c, Visual-language pretraining setup. CONCH consists of an image encoder, a text encoder and a multimodal text decoder. The pretraining process uses both contrastive and captioning objectives. The contrastive objectives align the image and text encoders by maximizing the cosine-similarity scores between paired image and text embeddings, while the captioning objective maximizes the likelihood of generating the correct text conditioned on the image and previously generated text (see Methods for details). , beginning of sentence; attn, attention; , end of sentence. d, Radar plot comparing the performance of CONCH and baselines on various downstream tasks. CONCH outperforms baselines by a significant margin on a diverse set of tasks spanning zero-shot classification, retrieval and zero-shot segmentation (see Results for detailed descriptions of each task and metric).On slide-level benchmarks, CONCH outperformed state-of-the-art visual-language foundation models (PLIP, BiomedCLIP and OpenAICLIP) on all tasks, often by a wide margin (Fig. 2c). For instance, for NSCLC subtyping and RCC subtyping, CONCH achieved a zero-shot accuracy of 90.7% and 90.2%, respectively, and it outperformed the next-best-performing model, PLIP, by 12.0% and 9.8% on each
图1 | 数据筛选和模型示意图。a,自动化数据清理管道。教育来源(EDU)和PubMed中央开放获取数据集(PMC OA)的部分手动清理,并用于训练一个目标检测器来检测组织病理学图像,一个语言模型来拆分指向多个图像的标题,以及一个匹配模型来将检测到的图像与其相应的标题匹配。清理过程产生了一个包含179万个图像-文本对的数据集,然后我们过滤掉了指向非人类的对,创建了我们的CONCH(仅人类)预训练数据集,共有117万个(有关数据清理的详细信息和数据筛选调查的讨论,请参见方法部分)。b,仅人类预训练数据集的图像-文本对的估计分布。请注意,预训练数据涵盖了各种病理学主题的广泛范围。插图,比较PMC-Path和EDU之间标题长度分布的差异(请参见扩展数据图1,了解每个类别标题的词云)。c,视觉语言预训练设置。CONCH包括一个图像编码器、一个文本编码器和一个多模态文本解码器。预训练过程使用对比和字幕两个目标。对比目标通过最大化配对图像和文本嵌入之间的余弦相似度分数来对齐图像和文本编码器,而字幕目标则通过最大化在图像和先前生成的文本的条件下生成正确文本的可能性来实现(有关详细信息,请参见方法)。,句子开始;attn,注意力;,句子结束。d,雷达图比较了CONCH和基线在各种下游任务上的性能。CONCH在涵盖了零样本分类、检索和零样本分割的多样任务中,大幅优于基线(有关每个任务和度量标准的详细描述,请参见结果)。在幻灯片级别的基准测试中,CONCH在所有任务上均优于最先进的视觉语言基础模型(PLIP、BiomedCLIP和OpenAICLIP),通常优势较大(图2c)。例如,在非小细胞肺癌(NSCLC)亚型和肾细胞癌(RCC)亚型分类中,CONCH分别实现了90.7%和90.2%的零样本准确率,比次优模型PLIP分别高出12.0%和9.8%。
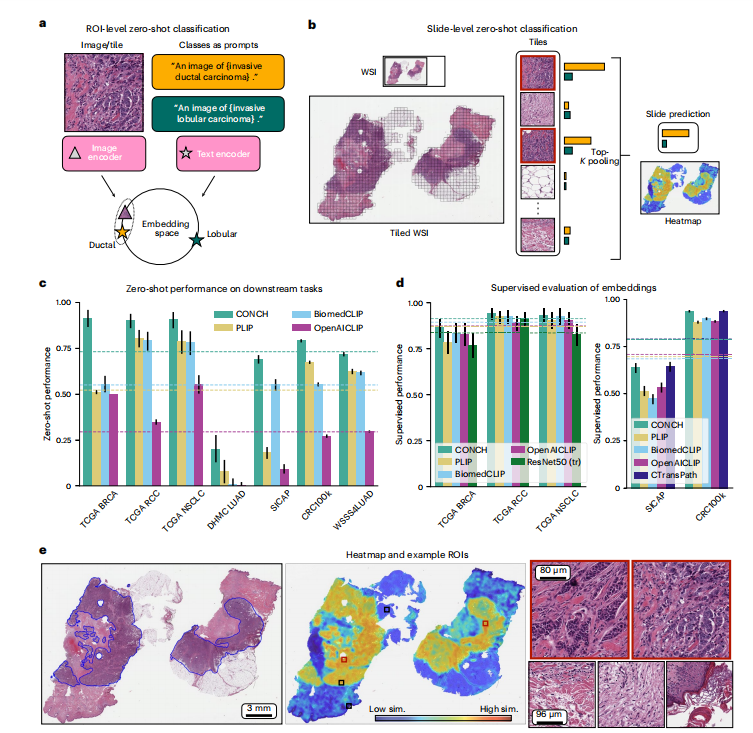
Fig. 2 | Zero-shot and supervised classification. a, Schematic of zero-shot classification using contrastively aligned image and text encoders. A prompt is constructed for each class, and the image is classified according to the prompt whose embedding is closest to that of the image in the shared embedding space. b, Zero-shot classification of WSIs. Each WSI is divided into tiles and processed as in a. The similarity scores for tiles are aggregated using top-K pooling to form slide-level similarity scores, the highest of which corresponds to the slide-level prediction. In c,d, dashed lines represent the average over tasks. Error bars represent 95% confidence intervals, and the centers correspond to computed values of each metric, as specified below. c, Zero-shot performance on downstream subtyping (TCGA BRCA, n = 150; TCGA RCC, n = 225; TCGA NSCLC, n = 150; DHMC LUAD, n = 143; CRC100k, n = 7,180; WSSS4LUAD, n = 4,693) and grading (SICAP, n = 2,122) tasks. Cohen’s κ is reported for DHMC LUAD and quadratically weighted Cohen’s κ is reported for SICAP, while balanced accuracy is reported for all other tasks. Additional metrics are reported in Supplementary Tables 1–7. d, Supervised evaluation of embeddings of each model. Linear probing is used for ROI-level tasks (CRC100k and SICAP), while ABMIL is used for slide-level tasks, with the same metrics reported as in c** (see Supplementary Tables 15–19 for more detailed results). e, From left to right: pathologistannotated IDC, corresponding heatmap and selected tiles at higher power. The heatmap is colored on the basis of the cosine-similarity score between each tile within the slide and the text prompt corresponding to the predicted class label. We find excellent agreement between the annotated image and high-similarity regions, with the tiles demonstrating classic IDC morphology within the highsimilarity (high sim.) regions and stroma or other normal constituents of the breast in the low-similarity (low sim.) regions.
图2 | 零样本和有监督分类。a,使用对齐的图像和文本编码器进行零样本分类的示意图。为每个类构建一个提示,并根据共享嵌入空间中与图像嵌入最接近的提示来对图像进行分类。b,对WSI进行零样本分类。每个WSI被分割成瓦片,并按照a中的方式进行处理。使用top-K池化来聚合瓦片的相似度分数,形成幻灯片级别的相似度分数,其中最高的分数对应于幻灯片级别的预测。在c,d中,虚线代表各任务的平均值。误差线代表95%置信区间,中心点对应于每个度量的计算值,如下所述。c,在下游亚型(TCGA BRCA,n = 150;TCGA RCC,n = 225;TCGA NSCLC,n = 150;DHMC LUAD,n = 143;CRC100k,n = 7,180;WSSS4LUAD,n = 4,693)和分级(SICAP,n = 2,122)任务上的零样本性能。对于DHMC LUAD,报告Cohen的κ,对于SICAP,报告加权的Cohen的κ,对于所有其他任务,报告平衡准确度。其他度量标准在补充表1–7中报告。d,对每个模型的嵌入进行有监督评估。线性探测用于ROI级任务(CRC100k和SICAP),而ABMIL用于幻灯片级任务,报告的度量标准与c中相同(有关更详细的结果,请参见补充表15–19)。e,从左到右:病理学家注释的IDC,对应的热图和在更高放大倍率下选定的瓦片。热图根据每个瓦片与预测类别标签对应的文本提示之间的余弦相似度分数进行着色。我们发现注释图像与高相似度区域之间存在极佳的一致性,在高相似度区域内的瓦片展现出经典的IDC形态,而在低相似度区域内则展现出乳腺的基质或其他正常成分。
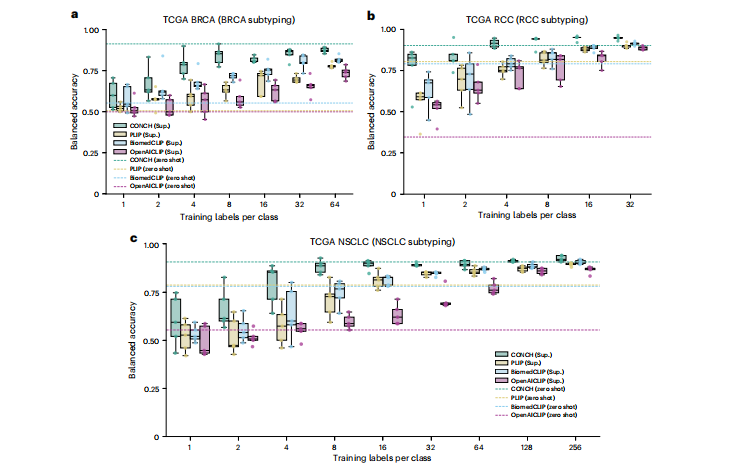
Fig. 3 | Slide-level few-shot classification experiments. a–c, We investigated the label efficiency of different visual-language pretrained encoders in the few-shot setting where we varied the number of training labels per class (nc), for nc = 1, 2, 4, 8, 16… until we reached the maximum number of available labels in the training set. For each nc, we sampled five different sets of training examples and trained a weakly supervised ABMIL model on each training set using slidelevel labels (see Methods, ‘Supervised and weakly supervised classification experiments’ for details). We show their individual model performance for BRCA subtyping (a), RCC subtyping (b) and NSCLC subtyping (c) by boxplot (n = 5 for each box) to study the variance in model performance when performingsupervised learning with very few training examples. Boxes indicate quartile values and whiskers extend to data points within 1.5× the interquartile range. For reference, the zero-shot performance of each model is shown as a dashed line on the same plot. In terms of few-shot supervised learning, CONCH achieves better performance (in terms of the median accuracy of five runs) than other encoders for different sizes of training set and for all tasks. Additionally, the zero-shot performance of CONCH is surprisingly competitive, exceeding the few-shot performance of PLIP, BiomedCLIP and OpenAICLIP with up to 64 labels per class in the case of BRCA and NSCLC subtyping. Sup., supervised learning.
图3 | 幻灯片级少样本分类实验。a–c,我们在少样本设置中调查了不同视觉语言预训练编码器的标签效率,其中我们变化每个类别的训练标签数(nc),对于nc = 1, 2, 4, 8, 16… 直到达到训练集中可用标签的最大数量。对于每个nc,我们随机抽样了五个不同的训练示例集,并在每个训练集上使用幻灯片级标签训练了一个弱监督的ABMIL模型(有关详细信息,请参见方法,“有监督和弱监督分类实验”)。我们通过箱线图(每个箱子n = 5)展示了它们在BRCA亚型(a)、RCC亚型(b)和NSCLC亚型(c)上的单独模型性能,以研究在使用极少量训练示例进行有监督学习时模型性能的差异。箱子表示四分位值,触须延伸到1.5倍四分位距内的数据点。为了参考,每个模型的零样本性能显示为同一图上的虚线。在少样本有监督学习方面,CONCH在不同大小的训练集和所有任务中均比其他编码器表现更好(以五次运行的中位准确度为标准)。此外,CONCH的零样本性能令人惊讶地具有竞争力,在BRCA和NSCLC亚型的情况下,超过了PLIP、BiomedCLIP和OpenAICLIP的少样本性能,每类标签最多达到64个。Sup.,有监督学习。
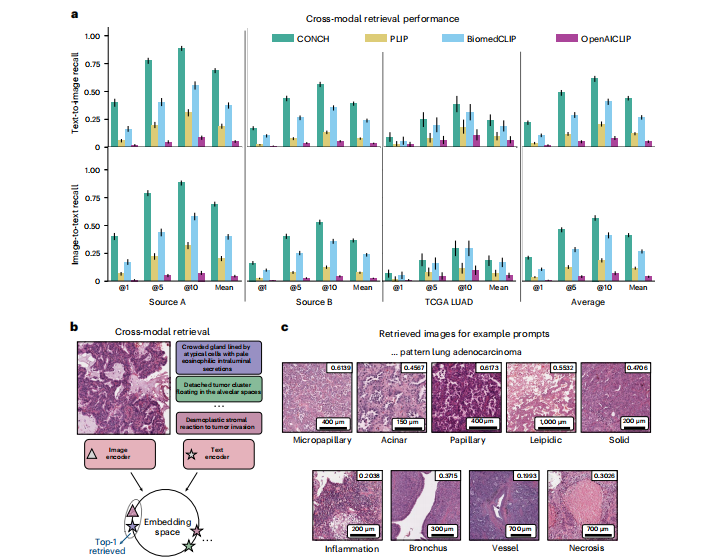
Fig. 4 | Zero-shot cross-modal retrieval. a, Model performance in cross-modal retrieval was evaluated on three datasets of image–text pairs (source A, n = 797; source B, n = 1,755; TCGA LUAD, n = 165). Similarity in the embedding space was computed between the query image and all text samples in the database. The top-K most similar texts were retrieved. We report Recall@K for K ∈ {1, 5, 10} and the mean recall, which averages over K. We show both text-to-image (top row) and image-to-text (bottom row) retrieval for each retrieval task (columns). The rightmost column reports the average across tasks for each metric. CONCH outperforms other baselines on all retrieval tasks. Error bars indicate 95% confidence intervals. b, Schematic for zero-shot image-to-text retrieval (the textto-image direction is analogous). c, Examples of images in the top five retrieved results from TCGA LUAD using LUAD-relevant queries with cosine-similarity scores shown in the top-right corner. Examples of other datasets using more diverse queries are shown in Extended Data Fig. 7. In general, we found that the images retrieved by the model matched what was described in the text prompt.
图4 | 零样本跨模态检索。a,在三个图像-文本对数据集(来源A,n = 797;来源B,n = 1,755;TCGA LUAD,n = 165)上评估了跨模态检索中的模型性能。在嵌入空间中计算了查询图像与数据库中所有文本样本之间的相似度。检索了前K个最相似的文本。我们报告了K ∈ {1, 5, 10}的Recall@K以及平均召回率,该平均值为K进行了平均。我们展示了每个检索任务(列)的文本到图像(顶部行)和图像到文本(底部行)检索。最右列报告了每个度量标准在各个任务中的平均值。CONCH在所有检索任务上均优于其他基线。误差线表示95%置信区间。b,零样本图像到文本检索的示意图(文本到图像方向类似)。c,使用与LUAD相关的查询从TCGA LUAD检索的前五个结果的示例,右上角显示余弦相似度分数。使用更多样化查询的其他数据集示例在扩展数据图7中显示。总的来说,我们发现模型检索到的图像与文本提示中描述的内容相匹配。
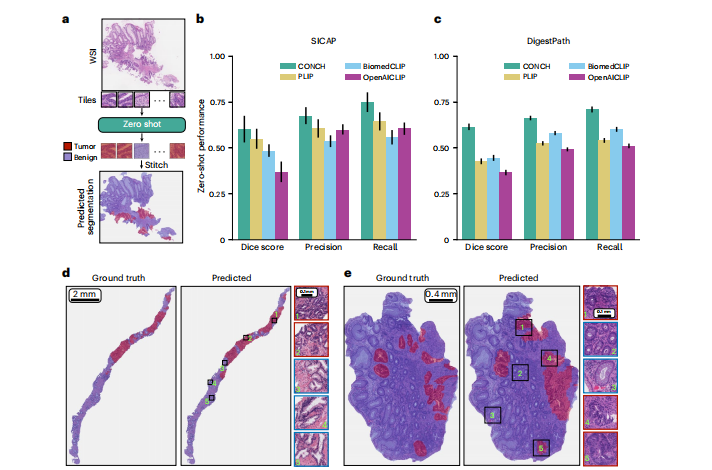
Fig. 5 | Zero-shot segmentation. a, Schematic illustrating zero-shot
segmentation on WSIs (or large tissue sections). To perform segmentation, we divided each WSI into tiles and used zero-shot classification to predict the label of each tile. The tile-level predictions were stitched together to form the predicted segmentation mask. b,c, Zero-shot segmentation performance of CONCH and baselines on SICAP (n = 31) (b) and DigestPath (n = 250) (c) datasets. The macroaveraged Dice score, precision and recall are reported. Error bars represent 95% confidence intervals. d,e, Examples of CONCH segmentation prediction on WSIs for SICAP (d) and DigestPath (e). The left panel shows the ground truth, and the right panel shows the predicted segmentation mask, with example regions enlarged. Red and blue indicate tumor and normal tissue, respectively. In general, in these examples, CONCH displays excellent sensitivity to tumor regions with slightly lower specificity, although most of the regions that CONCH segments as tumor that are in fact nontumor are adjacent to cancerous glands or contain cancer-associated stroma for both SICAP and DigestPath.
图5 | 零样本分割。a,示意图说明了在WSI(或大型组织切片)上进行零样本分割的过程。为了进行分割,我们将每个WSI分成瓦片,并使用零样本分类来预测每个瓦片的标签。将瓦片级别的预测拼接在一起形成预测的分割掩模。b,c,CONCH和基线在SICAP(n = 31)(b)和DigestPath(n = 250)(c)数据集上的零样本分割性能。报告了宏平均的Dice分数、精度和召回率。误差线代表95%的置信区间。d,e,在SICAP(d)和DigestPath(e)数据集上CONCH分割预测的示例。左侧面板显示了地面真相,右侧面板显示了预测的分割掩模,示例区域已放大。红色和蓝色分别表示肿瘤和正常组织。总的来说,在这些示例中,CONCH对肿瘤区域显示出优秀的灵敏度,但特异性稍低,尽管CONCH将大多数分割为肿瘤的区域实际上是非肿瘤,但它们与癌症腺体相邻或含有癌相关基质,对于SICAP和DigestPath都是如此。


 1749
1749

 被折叠的 条评论
为什么被折叠?
被折叠的 条评论
为什么被折叠?
 到【灌水乐园】发言


