


Title
题目
Interpretable medical image Visual Question Answering via multi-modal relationship graph learning
通过多模态关系图学习实现可解释的医学图像视觉问答。
01
文献速递介绍
医学视觉问答(VQA)是医学多模态大语言模型(LLMs)中的一项重要任务,旨在回答与医学图像相关的临床问题。这是一项具有挑战性的任务,需要结合医学图像诊断和自然语言理解。医学VQA能够为临床医生在解释医学图像时提供“第二意见”,从而降低误诊的风险(Tschandl等,2020)。它还可以部分承担放射科医生的专家咨询角色,回答来自医生和患者的问题,避免中断他们的工作流程,提高效率(Lin等,2023a)。
多模态大语言模型可用于执行这些任务,从而有助于减少低收入和中等收入国家的全球健康不平等现象。例如,在解释复杂病例时,当缺乏专业专家时,医学VQA系统提供的第二意见可能显著增强初级临床医生的信心。部署这样的系统还可以缓解资源匮乏地区的医疗服务短缺,例如非洲,该地区仅占全球医疗劳动力的3%,却承担了全球24%的疾病负担(世界卫生组织等,2021)。医学VQA可以通过降低资源匮乏国家的医疗成本,促进健康生活和福祉,为可持续发展目标(SDGs)做出贡献。
Abatract
摘要
Medical Visual Question Answering (VQA) is an important task in medical multi-modal Large Language Models(LLMs), aiming to answer clinically relevant questions regarding input medical images. This technique hasthe potential to improve the efficiency of medical professionals while relieving the burden on the publichealth system, particularly in resource-poor countries. However, existing medical VQA datasets are small andonly contain simple questions (equivalent to classification tasks), which lack semantic reasoning and clinicalknowledge. Our previous work proposed a clinical knowledge-driven image difference VQA benchmark usinga rule-based approach (Hu et al., 2023). However, given the same breadth of information coverage, the rulebased approach shows an 85% error rate on extracted labels. We trained an LLM method to extract labels with62% increased accuracy. We also comprehensively evaluated our labels with 2 clinical experts on 100 samplesto help us fine-tune the LLM. Based on the trained LLM model, we proposed a large-scale medical VQA dataset,Medical-CXR-VQA, using LLMs focused on chest X-ray images. The questions involved detailed information,such as abnormalities, locations, levels, and types. Based on this dataset, we proposed a novel VQA methodby constructing three different relationship graphs: spatial relationships, semantic relationships, and implicitrelationship graphs on the image regions, questions, and semantic labels. We leveraged graph attention tolearn the logical reasoning paths for different questions. These learned graph VQA reasoning paths can befurther used for LLM prompt engineering and chain-of-thought, which are crucial for further fine-tuning andtraining multi-modal large language models. Moreover, we demonstrate that our approach has the qualitiesof evidence and faithfulness, which are crucial in the clinical field.
医学视觉问答(Visual Question Answering, VQA)是医学多模态大语言模型(LLMs)中的一项重要任务,旨在回答与输入医学图像相关的临床问题。该技术有潜力提高医疗专业人员的工作效率,同时减轻公共卫生系统的负担,尤其是在资源匮乏的国家。然而,现有的医学VQA数据集规模较小,仅包含简单问题(相当于分类任务),缺乏语义推理和临床知识。
我们之前的工作提出了一种基于规则的方法(Hu等,2023),构建了一个临床知识驱动的图像差异VQA基准。然而,在相同的信息覆盖广度下,基于规则的方法在提取标签时表现出85%的错误率。我们训练了一种大语言模型方法来提取标签,准确率提高了62%。我们还与两位临床专家对100个样本的标签进行了全面评估,以帮助我们微调大语言模型。
基于训练好的大语言模型,我们提出了一个大型医学VQA数据集,称为Medical-CXR-VQA,专注于胸部X光图像。所涉及的问题包含详细信息,如异常、位置、程度和类型。在此数据集的基础上,我们提出了一种新颖的VQA方法,通过构建三种不同的关系图:图像区域、问题和语义标签上的空间关系图、语义关系图和隐含关系图。我们利用图注意力机制来学习不同问题的逻辑推理路径。这些学习到的图VQA推理路径可进一步用于大语言模型的提示工程和思维链,这对于进一步微调和训练多模态大语言模型至关重要。
此外,我们的方法展示了证据和可信度的品质,这在临床领域中至关重要。
Method
方法
Given an input medical image 𝐈𝑖 and a question 𝐪𝑖 , as shown inFig. 7, we aim to predict the answer to 𝐪𝑖 based on image information. We propose a multimodal graph-learning model, as shown inFig. 7, by first extracting the region of interest (ROI) using a pretrained Faster R-CNN and then considering each ROI as a node inthe graph. We considered three different relationships to build thegraph relationship/edges: (1) spatial relationships based on ROI-wisespatial locations, (2) semantic relationships based on medical expertknowledge, and (3) implicit relationships to discover additional latentrelationships. Lastly, we compute the answer by fusing multimodalgraphs with a multilayer perceptron network.
给定输入医学图像 𝐈𝑖 和一个问题 𝐪𝑖,如图7所示,我们的目标是基于图像信息预测问题 𝐪𝑖 的答案。我们提出了一种多模态图学习模型,如图7所示,首先使用预训练的Faster R-CNN提取感兴趣区域(ROI),然后将每个ROI视为图中的一个节点。
我们考虑了三种不同的关系来构建图的关系/边:(1) 基于ROI空间位置的空间关系;(2) 基于医学专家知识的语义关系;(3) 用于发现额外潜在关系的隐含关系。最后,我们通过将多模态图与多层感知器网络融合来计算答案。
Conclusion
结论
To promote the development of multi-modal Large Language Modelin medical research, we have utilized LLMs to create a large-scale,clinically driven medical VQA dataset named Medical-CXR-VQA. Thisserves as an extension of our previous work (Hu et al., 2023), whichused a conventional rule-based approach. Our LLM-based approachimproved the dataset construction accuracy by 62% when given thesame keyword extraction set. Furthermore, we proposed a multirelationship graph learning method for VQA, and our method canhighlight the selected reasoning path for answering different questions.The underlying reasoning path can be used to build a chain of thoughtin medical LLM and construct medical knowledge-driven prompts fortraining medical LLM, which will be part of our future work.
为了促进多模态大语言模型在医学研究中的发展,我们利用大语言模型(LLMs)创建了一个名为Medical-CXR-VQA的大规模、临床驱动的医学VQA数据集。这是对我们之前工作的扩展(Hu等,2023),该工作使用了传统的基于规则的方法。我们的基于LLM的方法在相同关键词提取集的情况下将数据集构建的准确性提高了62%。此外,我们提出了一种用于VQA的多关系图学习方法,该方法能够突出回答不同问题的选定推理路径。
这种潜在的推理路径可用于在医学大语言模型中构建思维链,并构建医学知识驱动的提示,以训练医学大语言模型,这将是我们未来工作的一个部分。
Figure
图
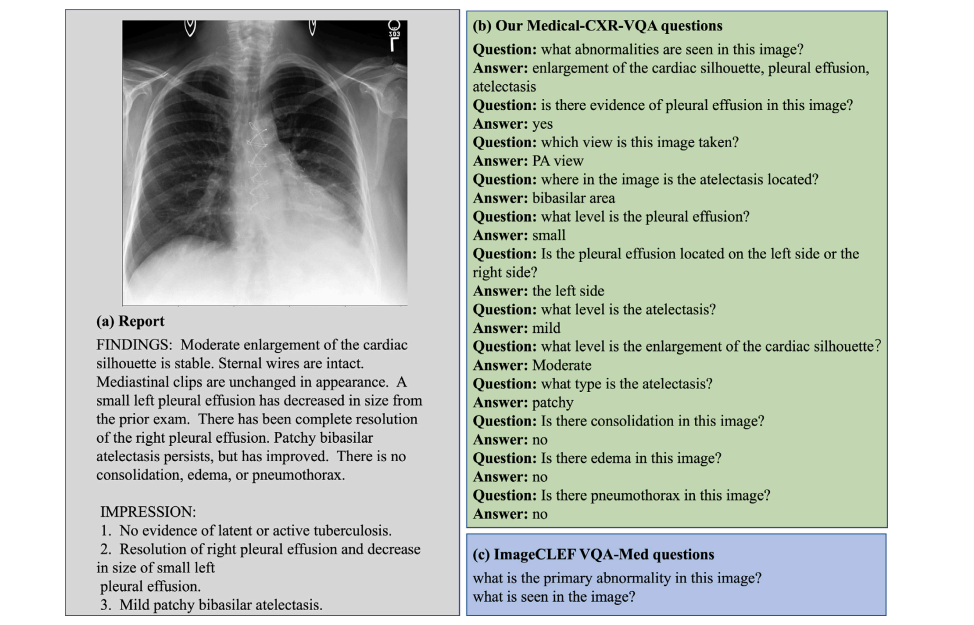
Fig. 1. A comparison between our constructed VQA dataset and the existing ImageCLEF VQA-Med dataset. (a) The report corresponds to the given Chest X-ray image. (b) Ourconstructed question settings, including abnormality, presence, view, location, level, and type. (c) The design of the ImageCLEF VQA-MED questions is too simple.
图1. 我们构建的VQA数据集与现有的ImageCLEF VQA-Med数据集的比较。(a) 报告与给定的胸部X光图像相对应。(b) 我们构建的问题设置,包括异常、存在、视角、位置、程度和类型。(c) ImageCLEF VQA-MED问题的设计过于简单。
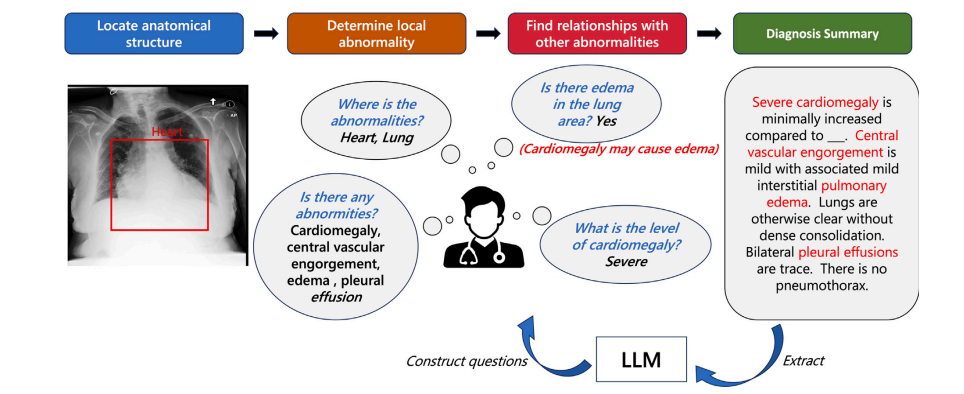
Fig. 2. Clinical practical diagnostic procedure and extraction of clinical key information using LLM for constructing a medical VQA dataset. We further propose a multi-graphmethod for medical VQA and graph reasoning on this dataset. Our proposed graph reasoning path can further be used to build chains of thought on medical LLM (Wei et al.,2022).
图2. 临床实际诊断过程及利用大语言模型(LLM)提取临床关键信息以构建医学VQA数据集。我们进一步提出了一种用于医学VQA的多图方法和在该数据集上的图推理。我们提出的图推理路径还可以用于在医学大语言模型(Wei等,2022)上构建思维链。
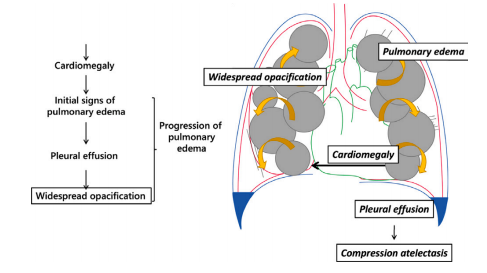
Fig. 3. Clinical motivation for the construction of our dataset and VQA method derivedfrom disease progression.
图3. 我们的数据集构建和VQA方法的临床动机源于疾病进展。
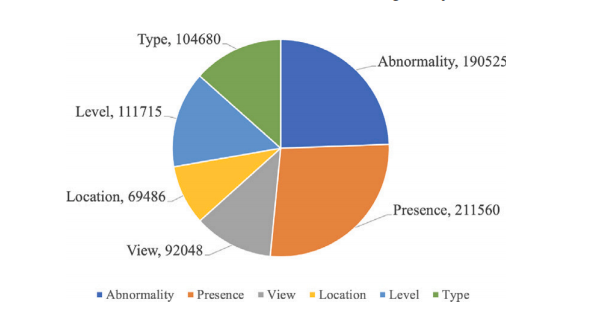
Fig. 4. Question type distribution.
图4. 问题类型分布。
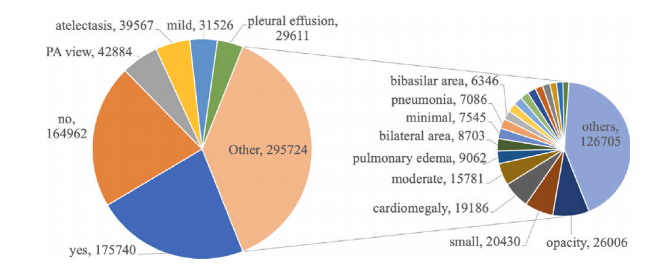
Fig. 5. Answer type distribution.
图5. 答案类型分布。
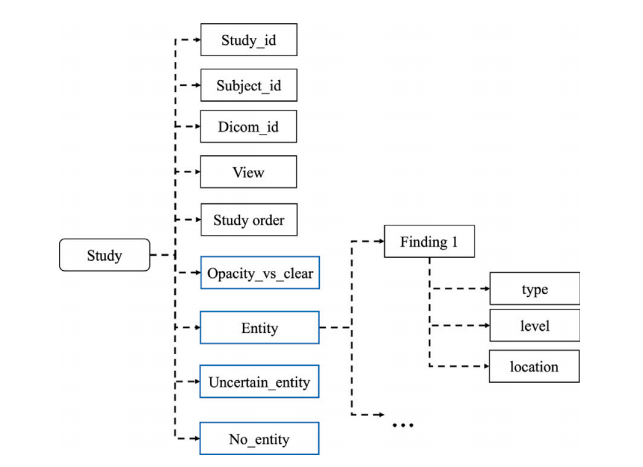
Fig. 6. Detailed structure of KeyInfo for each study.
图6. 每项研究的关键信息(KeyInfo)详细结构。
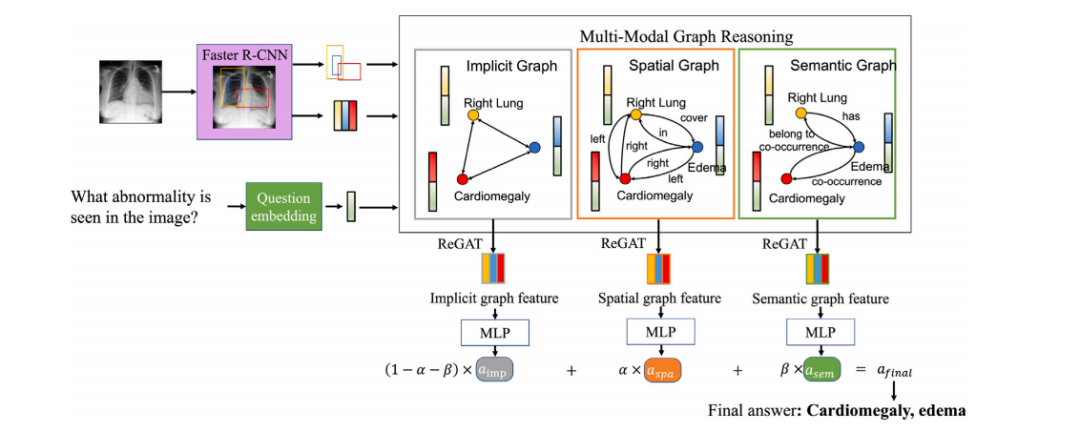
Fig. 7. Proposed multi-modal graph learning medical VQA framework.
图7. 提出的多模态图学习医学VQA框架。
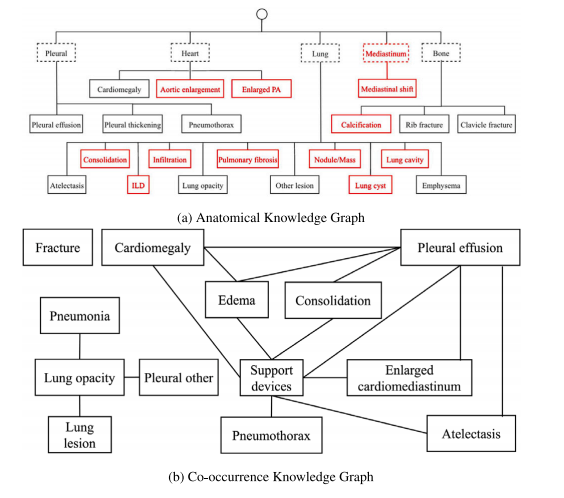
Fig. 8. Knowledge graphs.
图8. 知识图谱。
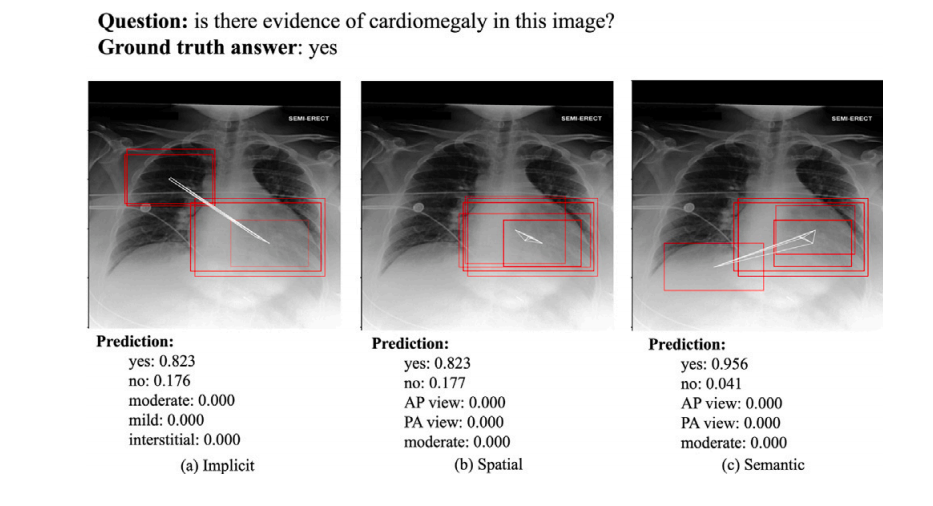
Fig. 9. An example of the ROIs visualization for presence. The red bounding boxes are the activated ROIs.
图9. 一个关于存在的ROI(感兴趣区域)可视化示例。红色边框表示激活的ROI。
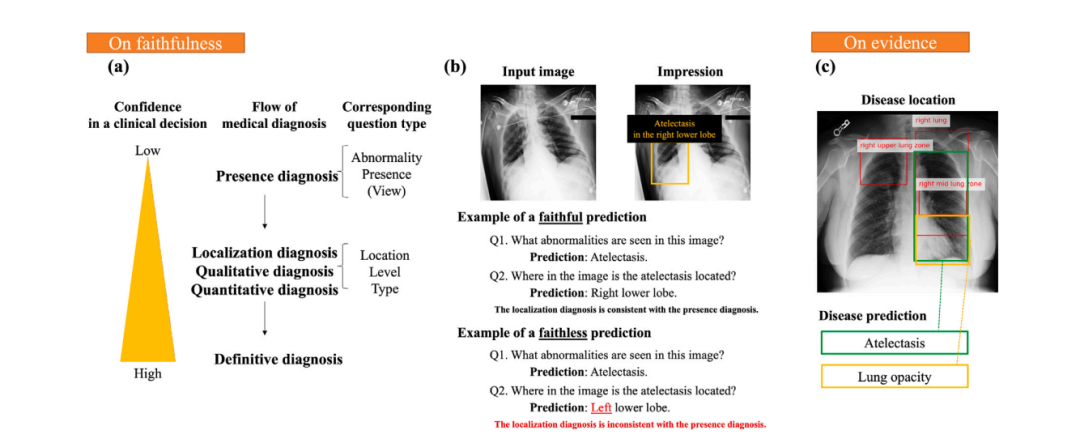
Fig. 10. Illustration of faithfulness and evidence: (a) As finer questions are asked, diagnosis confidence increases. (b) Examples of faithful and faithless predictions. (c) Illustration of evidence.
图10. 可信度和证据的说明:(a)随着更细化问题的提出,诊断信心增加。(b)可信和不可信预测的示例。(c)证据的说明。
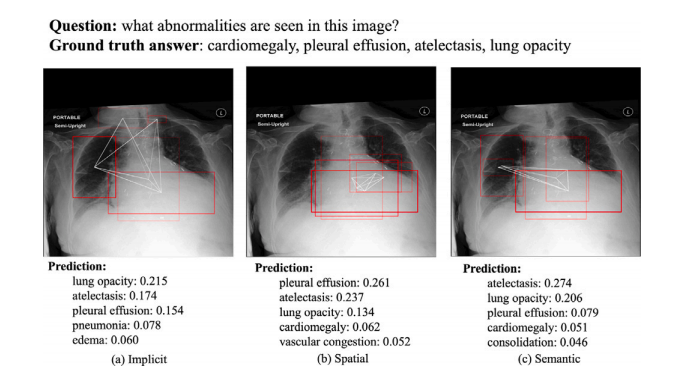
Fig. 11. An example of the ROIs visualization for abnormality. The red bounding boxesare the activated ROIs.
图11. 一个关于异常的ROI(感兴趣区域)可视化示例。红色边框表示激活的ROI。
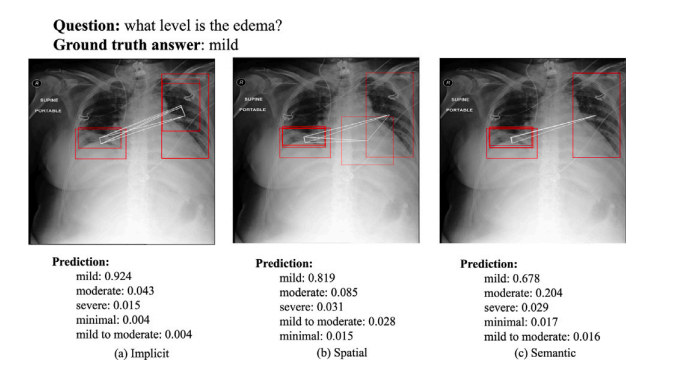
Fig. 12. An example of the ROIs visualization for level. The red bounding boxes arethe activated ROIs.
图12. 一个关于程度的ROI(感兴趣区域)可视化示例。红色边框表示激活的ROI。
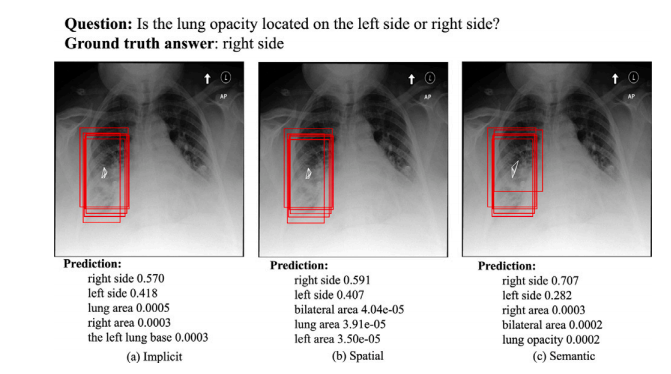
Fig. 13. An example of the visualization result for location. The red bounding boxes are the activated ROIs.
图13. 一个关于位置的可视化结果示例。红色边框表示激活的ROI(感兴趣区域)。
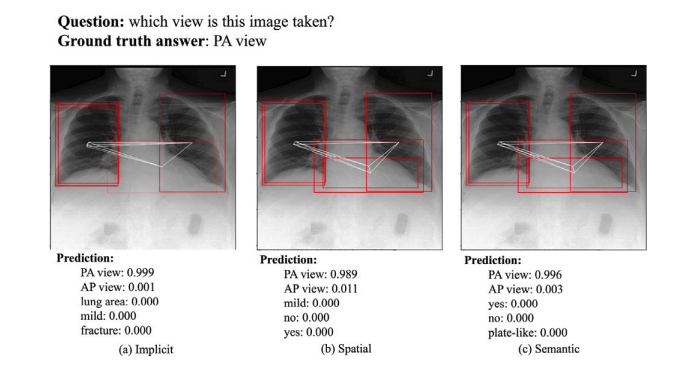
Fig. 14. An example of the ROIs visualization for view. The red bounding boxes are the activated ROIs.
图14. 一个关于视角的ROI(感兴趣区域)可视化示例。红色边框表示激活的ROI。
Table
表
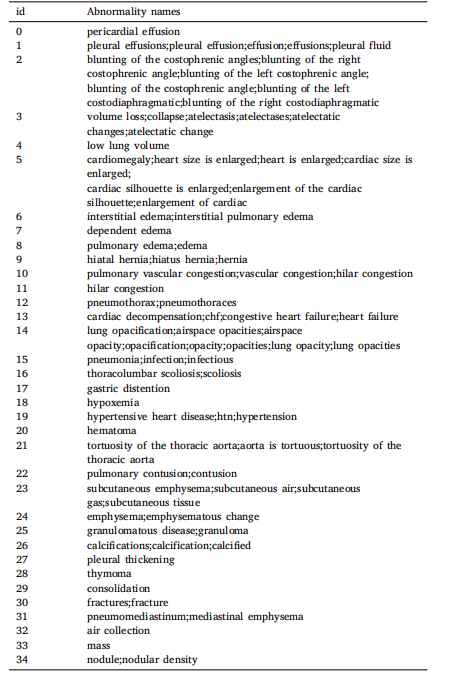
Table 1Abnormality keyword variants.
表1 异常关键词变体。
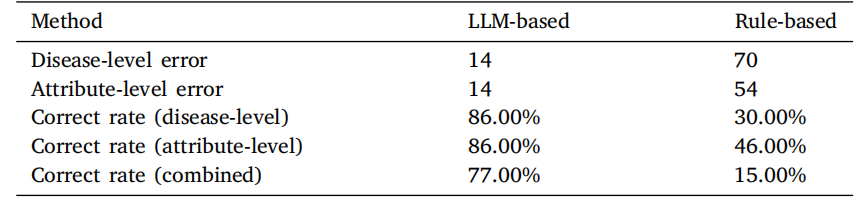
Table 2Comparison of correct rate between LLM-based method and Rule-based method for100 KeyInfo samples. The counts of errors at the disease level include cases ofmisclassification, instances of the disease being missing, and occurrences of the diseasebeing extra. Similarly, the counts of errors at the attribute level encompass situationswhere attributes are incorrectly assigned or missing.
表2 LLM方法与基于规则方法在100个关键信息(KeyInfo)样本中的正确率比较。疾病层级的错误计数包括分类错误、疾病缺失以及多余的疾病情况。类似地,属性层级的错误计数包括属性分配错误或缺失的情况
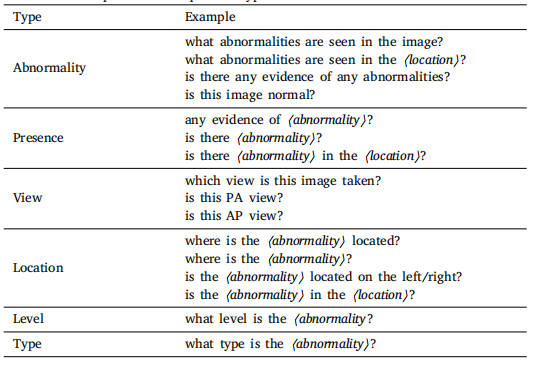
Table 3Full list of examples for each question type.
表3 各种问题类型的完整示例列表。
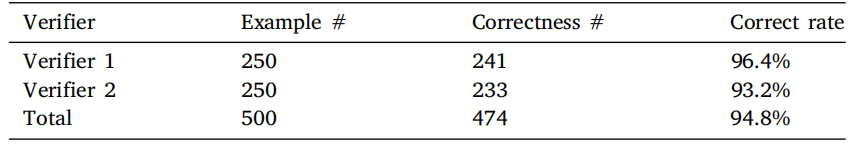
Table 4Dataset evaluation results by human verifiers
表4 人类验证者对数据集的评估结果。
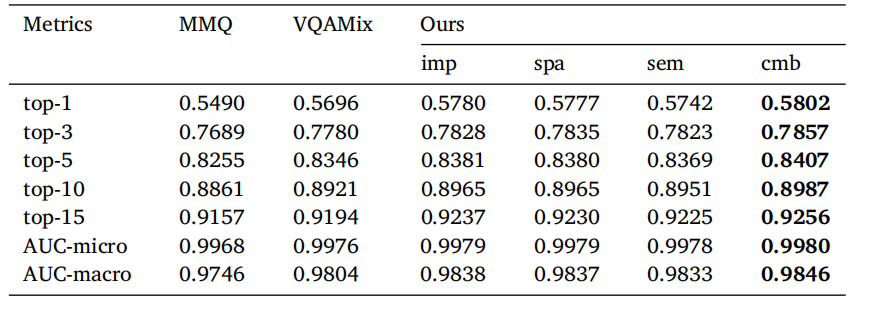
Table 5Comparison of baseline model and our method with three relation graphs and combinedscore using Top-K accuracy and AUC evaluation metrics. AUC-micro computes the finalAUC by aggregating the contributions of each class while AUC-macro treats all classesequally and computes the average AUC. ‘‘imp’’, ‘‘spa’’, ‘‘sem’’, and ‘‘cmb’’ represent‘‘implicit’’, ‘‘spatial’’, ‘‘semantic’’, and ‘‘combined’’ respectively.
表5 基线模型与我们的方法在使用三种关系图和组合得分的Top-K准确率和AUC评估指标下的比较。AUC-micro通过聚合每个类别的贡献来计算最终的AUC,而AUC-macro将所有类别视为相等并计算平均AUC。“imp”、“spa”、“sem”和“cmb”分别代表“隐含”、“空间”、“语义”和“组合”。
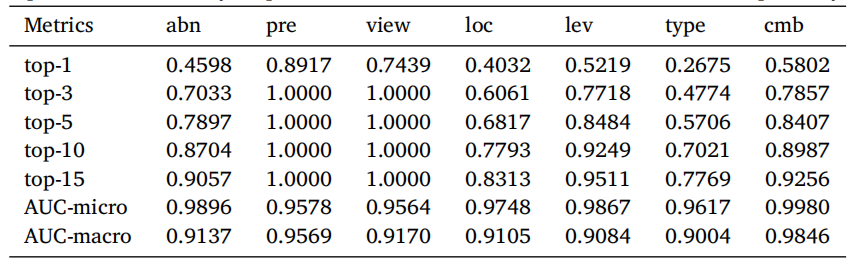
Table 6Evaluation results on different question types. ‘‘abn’’, ‘‘pre’’, ‘‘loc’’, ‘‘lev’’, and ‘‘cmb’’represent ‘‘abnormality’’, ‘‘presence’’, ‘‘location’’, ‘‘level’’, and ‘‘combined’’ respectively.
表6 不同问题类型的评估结果。“abn”、“pre”、“loc”、“lev”和“cmb”分别代表“异常”、“存在”、“位置”、“程度”和“组合”。
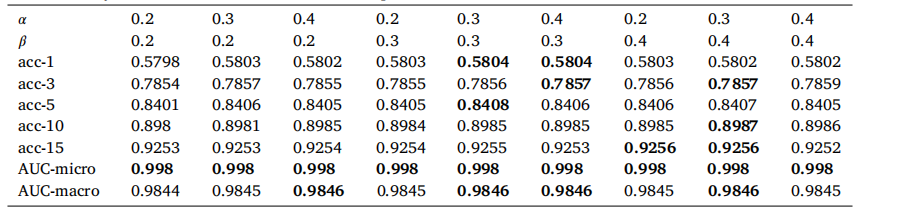
Table 7 Ablation study on how different 𝛼 and 𝛽 values impact the final results on Medical-CXR-VQA dataset.
表7 不同的 𝛼 和 𝛽 值对Medical-CXR-VQA数据集最终结果影响的消融研究。
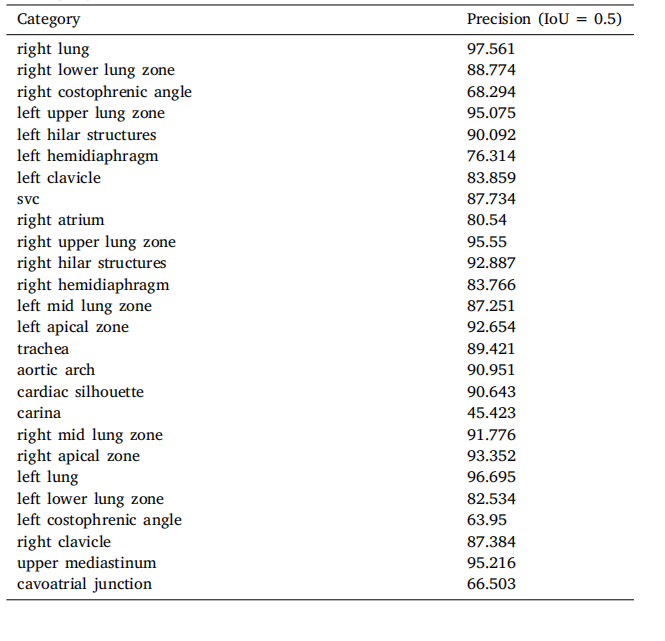
Table A.8Anatomical structure detection results. Precision represents when the Intersection overUnion (IoU) threshold is set to 0.5.
表A.8 解剖结构检测结果。精度表示在交并比(IoU)阈值设置为0.5时的结果。
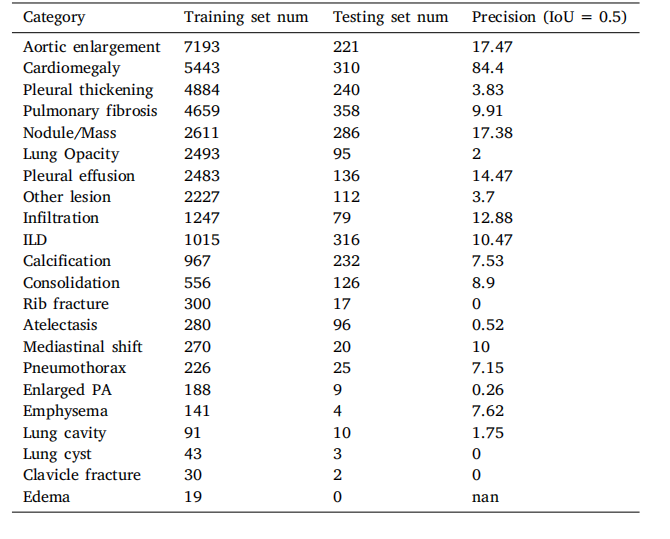
Table A.9Abnormality detection results. Precision represents when the Intersection over Union(IoU) threshold is set to 0.5.
表A.9 异常检测结果。精度表示在交并比(IoU)阈值设置为0.5时的结果。


 被折叠的 条评论
为什么被折叠?
被折叠的 条评论
为什么被折叠?
 到【灌水乐园】发言


