


Random Walk算法
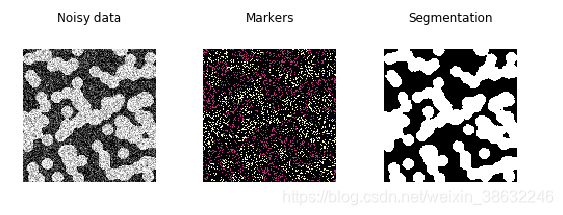
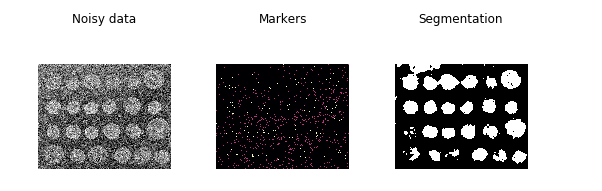
根据一组标记多个相位(2个或更多)的标记确定图像的分割。利用在标记点位置启动的示踪剂求解各向异性扩散方程。如果相邻像素具有相似的值,则局部扩散系数较大,因此很难在高梯度上进行扩散。每个未知像素的标签归因于已知标记的标签,该标记在扩散过程中最有可能首先到达。
在这个例子中,两个阶段是清晰可见的,但是数据太过嘈杂,无法仅从柱状图进行分割。我们从灰度值的柱状图的最尾部确定两个相位的标记,并使用随机游走器进行分割。
import numpy as np
import matplotlib.pyplot as plt
%matplotlib inline
from skimage.segmentation import random_walker
from skimage.data import binary_blobs
from skimage import data
from skimage.exposure import rescale_intensity
import skimage
# Generate noisy synthetic data
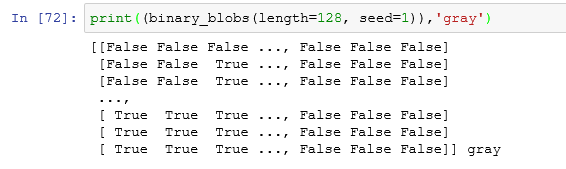
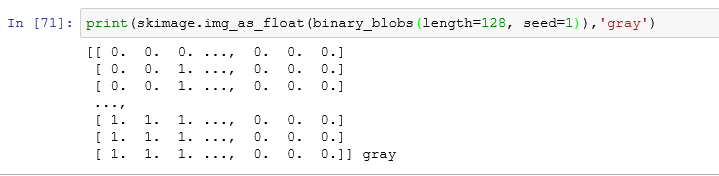
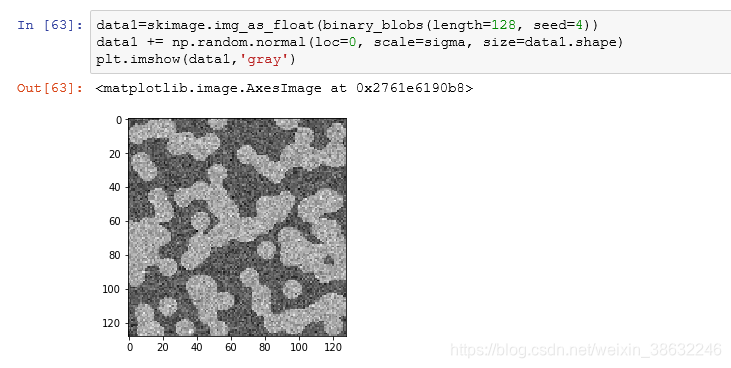
data = skimage.img_as_float(binary_blobs(length=128, seed=4)) #布尔数组 转二值数组 参考图一
#data=skimage.img_as_float(data.coins())
sigma = 0.3
data += np.random.normal(loc=0, scale=sigma, size=data.shape) #加噪声 参考图二
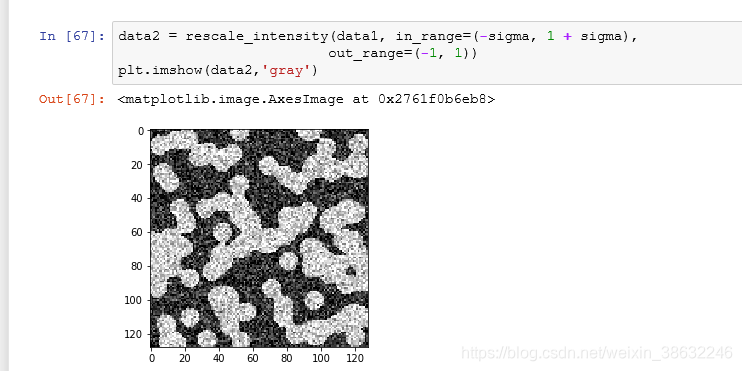
data = rescale_intensity(data, in_range=(-sigma, 1 + sigma),
out_range=(-1, 1)) # 拉伸亮度 参考 图三
#返回图像后拉伸或收缩其强度水平。所需的强度范围的输入和输出,in_range和out_range分别用于拉伸或收缩的强度范围 输入的图像。
# The range of the binary image spans over (-1, 1).
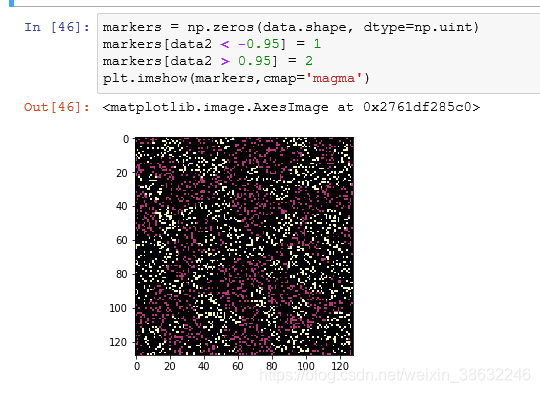
# We choose the hottest and the coldest pixels as markers.
markers = np.zeros(data.shape, dtype=np.uint) #参考图四
markers[data < -0.95] = 1
markers[data > 0.95] = 2
# Run random walker algorithm
labels = random_walker(data, markers, beta=10, mode='bf')
# Plot results
fig, (ax1, ax2, ax3) = plt.subplots(1, 3, figsize=(8, 3.2),
sharex=True, sharey=True)
ax1.imshow(data, cmap='gray', interpolation='nearest')
ax1.axis('off')
ax1.set_title('Noisy data')
ax2.imshow(markers, cmap='magma', interpolation='nearest')
ax2.axis('off')
ax2.set_title('Markers')
ax3.imshow(labels, cmap='gray', interpolation='nearest')
ax3.axis('off')
ax3.set_title('Segmentation')
fig.tight_layout()
plt.show()
图一:布尔数组 转二值数组
图二: 加噪声
图三:拉伸亮度
图四: 掩模


 970
970


 被折叠的 条评论
为什么被折叠?
被折叠的 条评论
为什么被折叠?
 到【灌水乐园】发言


