
决策树原理
之前我们详细讲解过决策树的原理,详细内容可以参考该链接(https://www.jianshu.com/p/0dd283516cbe)。
改进算法
但使用信息增益作为特征选择指标(ID3算法)容易造成过拟合。举一个简单例子,每个类别如果都有一个唯一ID,通过ID这个特征就可以简单分类,但这并不是有效的。为了解决这个问题,有了C4.5和CART算法,其区别如下所示:
- ID3 是信息增益划分
- C4.5 是信息增益率划分
- CART 做分类工作时,采用 GINI 值作为节点分裂的依据
实战——泰坦尼克号生还预测
数据导入与预处理
该数据可在kaggle网站下载,这里我们先通过pandas读入数据。
import numpy as npimport pandas as pddf = pd.read_csv('data/titanic/train.csv',index_col=0)df.head()

首先,对于一些不重要的信息进行删除(例如Name);我们都知道,机器学习是没法对字符串进行计算的,这里需要把Sex、Embarked转换为整数类型。
# 删除列df.drop(['Name','Ticket','Cabin'], axis=1, inplace=True)# Sex转换def f1(x):if x =='male':return1else:return0df['Sex']= df['Sex'].apply(f1)
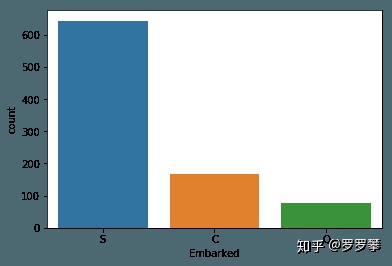
然后,Embarked有缺失值,我们通过seaborn进行可视化,发现S值最多,所以通过S值进行缺失值填充。
import seaborn as snsimport matplotlib.pyplot as plt%matplotlib inlinesns.countplot(x="Embarked",data=df)

df['Embarked']= df['Embarked'].fillna('S')labels = df['Embarked'].unique().tolist()df['Embarked']= df['Embarked'].apply(lambda n: labels.index(n))
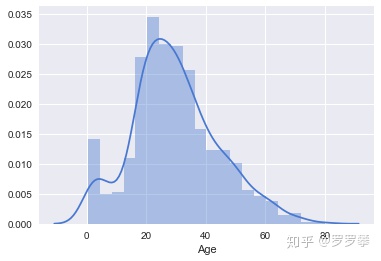
年龄字段也有缺失值,我们通过绘制直方图,发现基本呈正态分布,于是使用平均值来填充缺失值。
sns.set(style="darkgrid", palette="muted", color_codes=True)sns.distplot(df[df['Age'].notnull()]['Age'])

df['Age']= df['Age'].fillna(df['Age'].mean())df['Age'].isnull().sum()
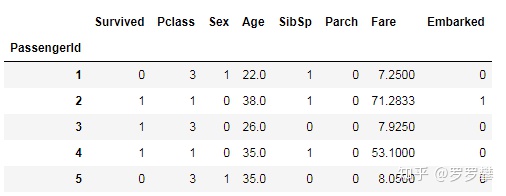
处理完成后的数据如下:

切分数据集
from sklearn.model_selection import train_test_splitX = df.iloc[:,1:]y = df['Survived']X_train, X_test, y_train, y_test = train_test_split(X, y, test_size=0.2, random_state=22)
模型训练与评估
决策树算法使用sklearn.tree模块中的DecisionTreeClassifier方法。该方法有一系列参数来控制决策树生成过程,从而解决过拟合问题(具体可看sklearn的官方文档)。常用的参数如下:
- criterion:算法选择。一种是信息熵(entropy),一种是基尼系数(gini),默认为gini。
- max_depth:指定数的最大深度。
- minsamplessplit:默认为2,指定能创建分支的数据集大小。
- minimpuritydecrease:指定信息增益的阈值。
首先,我们不对参数进行调整。
from sklearn.tree importDecisionTreeClassifierclf =DecisionTreeClassifier()clf.fit(X_train, y_train)clf.score(X_test, y_test)# result# 0.82122905027932958
我们用交叉验证查看模型的准确度,发现模型的精度并不是很高。
from sklearn.model_selection import cross_val_scoreresult = cross_val_score(clf, X, y, cv=10)print(result.mean())# result# 0.772279536942
模型调优
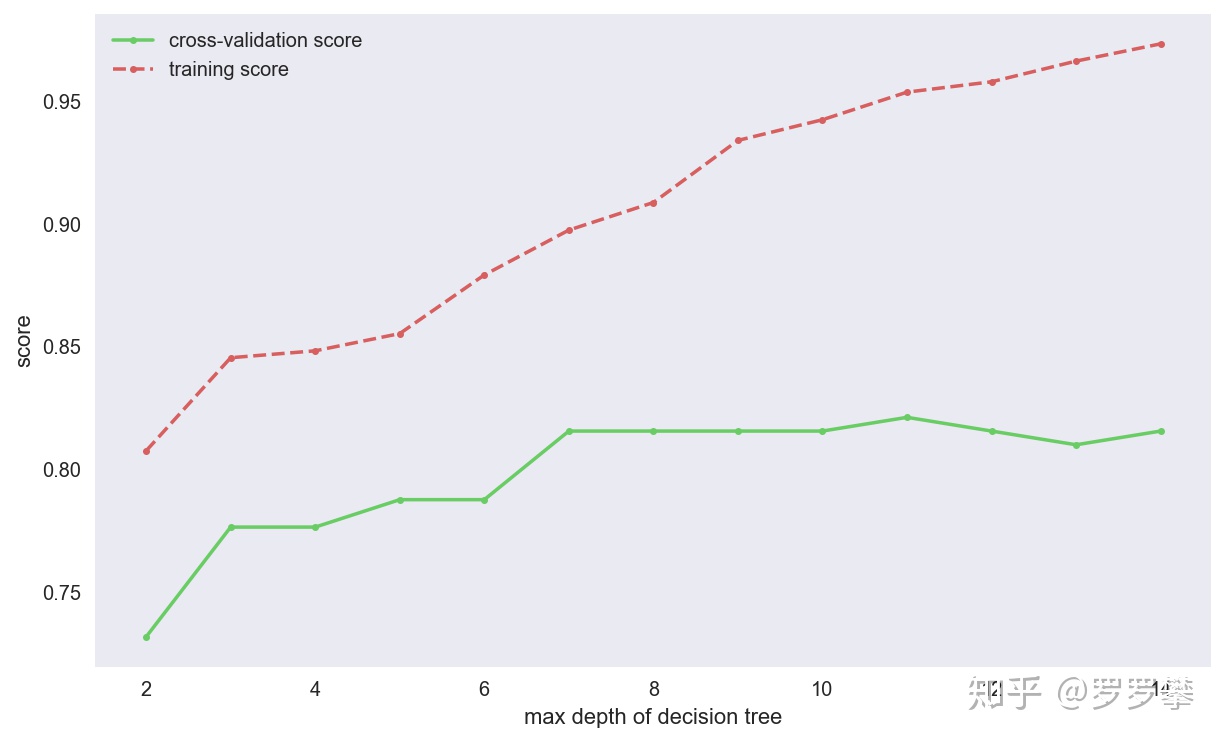
我们可以设置不同的参数,对模型进行调优,这里以max_depth为例,定义函数,求出最好的参数。
def cv_score(d):clf =DecisionTreeClassifier(max_depth=d)clf.fit(X_train, y_train)tr_score = clf.score(X_train, y_train)cv_score = clf.score(X_test, y_test)return(tr_score, cv_score)depths = range(2,15)scores =[cv_score(d)for d in depths]tr_scores =[s[0]for s in scores]cv_scores =[s[1]for s in scores]best_score_index = np.argmax(cv_scores)best_score = cv_scores[best_score_index]best_param = depths[best_score_index]print('best param: {0}; best score: {1}'.format(best_param, best_score))plt.figure(figsize=(10,6), dpi=144)plt.grid()plt.xlabel('max depth of decision tree')plt.ylabel('score')plt.plot(depths, cv_scores,'.g-', label='cross-validation score')plt.plot(depths, tr_scores,'.r--', label='training score')plt.legend()# result# best param: 11; best score: 0.8212290502793296

网格搜索
但这种方法存在这两个问题:
- 结果不稳定。当划分不同的数据集时,可能结果都一样。
- 不能选择多参数。当需要多参数进行调优时,代码量会变的很多(多次嵌套循环)。
为了解决这些问题,sklearn提供GridSearchCV方法。
from sklearn.model_selection importGridSearchCVthreshholds = np.linspace(0,0.5,50)param_grid ={'criterion':['gini','entropy'],'min_impurity_decrease':threshholds,'max_depth':range(2,15)}clf =GridSearchCV(DecisionTreeClassifier(), param_grid, cv=5)clf.fit(X, y)print("best param: {0}nbest score: {1}".format(clf.best_params_,clf.best_score_))# result# best param: {'criterion': 'entropy', 'max_depth': 8, 'min_impurity_decrease': 0.0}best score:0.8204264870931538


 8436
8436

 被折叠的 条评论
为什么被折叠?


