


I am new to Python. How do I sum data based on date and plot the result?
I have a Series object with data like:
2017-11-03 07:30:00 NaN
2017-11-03 09:18:00 NaN
2017-11-03 10:00:00 NaN
2017-11-03 11:08:00 NaN
2017-11-03 14:39:00 NaN
2017-11-03 14:53:00 NaN
2017-11-03 15:00:00 NaN
2017-11-03 16:00:00 NaN
2017-11-03 17:03:00 NaN
2017-11-03 17:42:00 800.0
2017-11-04 07:27:00 600.0
2017-11-04 10:10:00 NaN
2017-11-04 11:48:00 NaN
2017-11-04 12:58:00 500.0
2017-11-04 13:40:00 NaN
2017-11-04 15:15:00 NaN
2017-11-04 16:21:00 NaN
2017-11-04 17:37:00 500.0
2017-11-04 21:37:00 NaN
2017-11-05 03:00:00 NaN
2017-11-05 06:30:00 NaN
2017-11-05 07:19:00 NaN
2017-11-05 08:31:00 200.0
2017-11-05 09:31:00 500.0
2017-11-05 12:03:00 NaN
2017-11-05 12:25:00 200.0
2017-11-05 13:11:00 500.0
2017-11-05 16:31:00 NaN
2017-11-05 19:00:00 500.0
2017-11-06 08:08:00 NaN
I have the following code:
# load packages
import pandas as pd
import matplotlib.pyplot as plt
# import painkiller data
df = pd.read_csv('/Users/user/Documents/health/PainOverTime.csv',delimiter=',')
# plot bar graph of date and painkiller amount
times = pd.to_datetime(df.loc[:,'Time'])
ts = pd.Series(df.loc[:,'acetaminophen'].values, index = times,
name = 'Painkiller over Time')
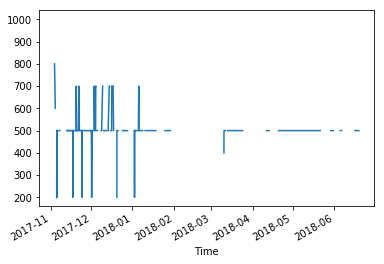
ts.plot()
This gives me the following line(?) graph:

It's a start; now I want to sum the doses by date. However, this code fails to effect any change: The resulting plot is the same. What is wrong?
ts.resample('D',closed='left', label='right').sum()
ts.plot()
I have also tried ts.resample('D').sum(), ts.resample('1d').sum(), ts.resample('1D').sum(), but there is no change in the plot.
Is .resample even the correct function? I understand resampling to be sampling from the data, e.g. randomly taking one point per day, whereas I want to sum each day's values.
Namely, I'm hoping for some result (based on the above data) like:
2017-11-03 800
2017-11-04 1600
2017-11-05 1900
2017-11-06 NaN
解决方案
This answer helped me see that I needed to assign it to a new object (if that's the right terminology):
import pandas as pd
import matplotlib.pyplot as plt
df = pd.read_csv('/Users/user/Documents/health/PainOverTime.csv',delimiter=',')
# plot bar graph of date and painkiller amount
times = pd.to_datetime(df.loc[:,'Time'])
# raw plot of data
ts = pd.Series(df.loc[:,'acetaminophen'].values, index = times,
name = 'Painkiller over Time')
fig1 = ts.plot()
# combine data by day
test2 = ts.resample('D').sum()
fig2 = test2.plot()
That produces the following plots:
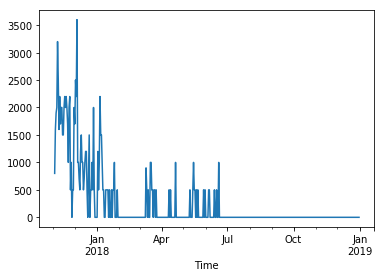
Is this method not better than the 'groupby' function?
Now how do I make a scatter or bar plot instead of this line plot...?


 4812
4812


 被折叠的 条评论
为什么被折叠?
被折叠的 条评论
为什么被折叠?
 到【灌水乐园】发言


