


I just finished writing code to make a plot using pylab in Python and now I would like to superimpose a grid of 10x10 onto the scatter plot. How do I do that?
My current code is the following:
x = numpy.arange(0, 1, 0.05)
y = numpy.power(x, 2)
fig = plt.figure()
ax = fig.gca()
ax.set_xticks(numpy.arange(0, 1, 0.1))
ax.set_yticks(numpy.arange(0, 1., 0.1))
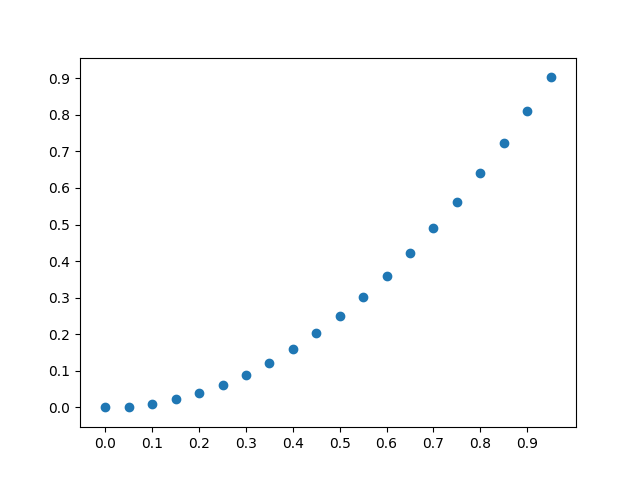
plt.scatter(x, y)
plt.show()
And its output is:
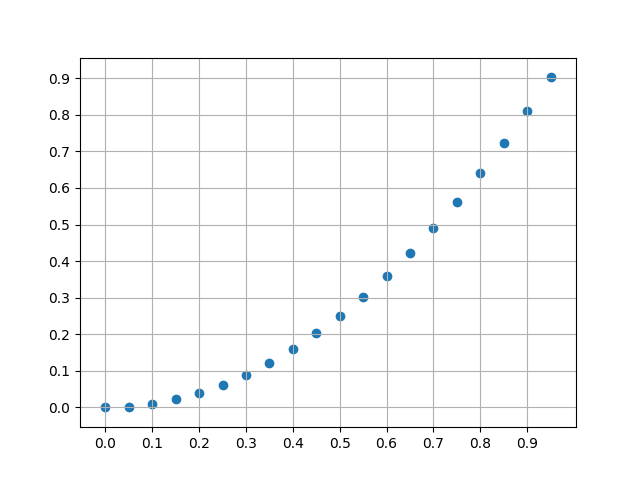
What I would like is the following output:
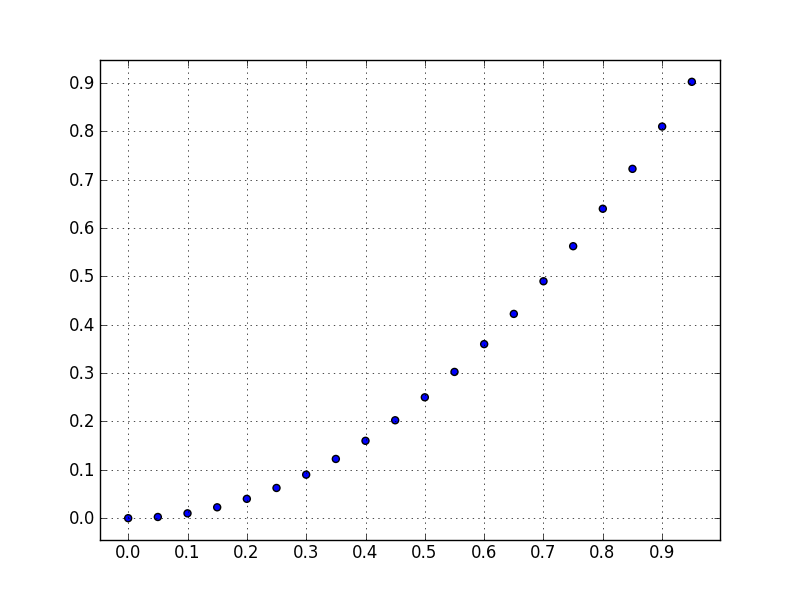
EDIT: Added an exemple, based on Andrey Sobolev's answer
解决方案
You want to use pyplot.grid:
x = numpy.arange(0, 1, 0.05)
y = numpy.power(x, 2)
fig = plt.figure()
ax = fig.gca()
ax.set_xticks(numpy.arange(0, 1, 0.1))
ax.set_yticks(numpy.arange(0, 1., 0.1))
plt.scatter(x, y)
plt.grid()
plt.show()
ax.xaxis.grid and ax.yaxis.grid can control grid lines properties.


 351
351


 被折叠的 条评论
为什么被折叠?
被折叠的 条评论
为什么被折叠?
 到【灌水乐园】发言


