


"pythonic生物人"的第66篇分享
 。
。
本文介绍seaborn.catplot函数可视化分类数据,涉及如下8种图,更换父类catplot中的kind参数即可,也可使用对应的子函数如下:
- stripplot(),此时(kind="strip",默认);
- swarmplot(),此时(kind="swarm")
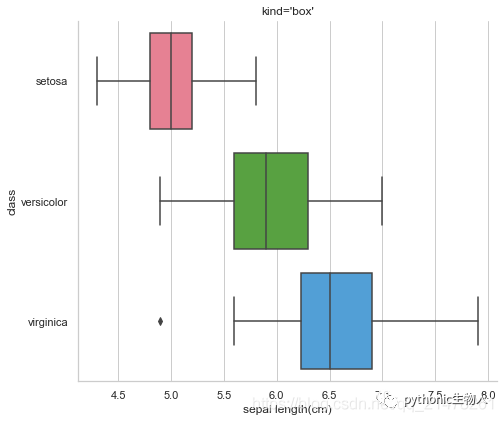
- boxplot(),此时(kind="box");
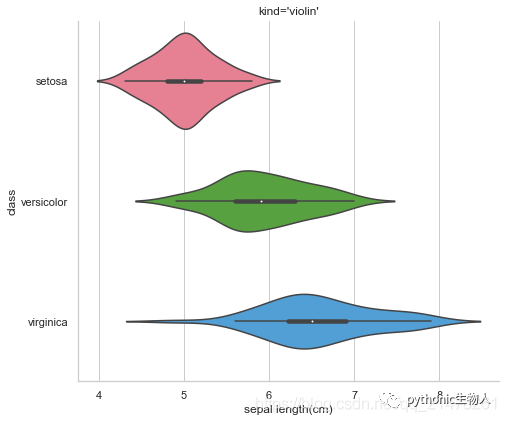
- violinplot(),此时(kind="violin");
- boxenplot(),此时(kind="boxen")
- pointplot(),此时(kind="point");
- barplot(),此时(kind="bar");
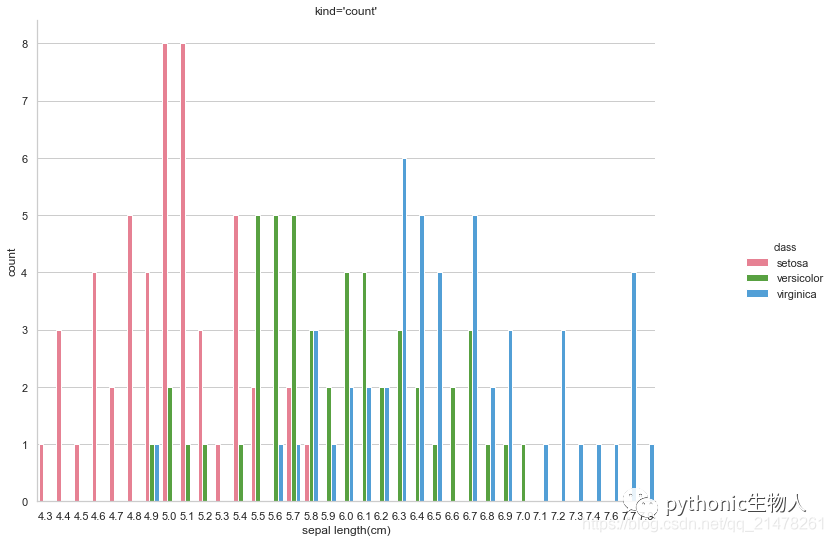
- countplot(),此时(kind="count")
每类图函数都有自己独特的参数,本文主要介绍前四类图。
本文将了解什么?
1、seaborn.catplot简介2、绘图数据集准备3、seaborn.stripplot(分类散点图) stripplot不分类散点图 stripplot分类散点图 设置点的属性 多重分类 catplot()结合stripplot和FacetGrid分图显示 4、seaborn.swarmplot(成簇散点图) swarmplot不分类散点图 设置点的属性 5、seaborn.boxplot(箱图或箱线图)6、seaborn.violinplot(小提琴图) 不分类小提琴图 分类小提琴图 inner参数 多重分类小提琴图 多重分类左右显示小提琴图正文开始啦
1、seaborn.catplot简介
实用场景:categorical data, one of the main variables is “categorical” (divided into discrete groups)
语法:seaborn.catplot(x=None, y=None, hue=None, data=None, row=None, col=None, col_wrap=None, estimator=, ci=95, n_boot=1000, units=None, seed=None, order=None, hue_order=None, row_order=None, col_order=None, kind='strip', height=5, aspect=1, orient=None, color=None, palette=None, legend=True, legend_out=True, sharex=True, sharey=True, margin_titles=False, facet_kws=None, **kwargs)
seaborn.catplot可分3大类,更细分8小类:
分类散点图, stripplot(),此时(kind="strip",默认);swarmplot(),此时(kind="swarm")
分类分布图, boxplot(),此时(kind="box");violinplot(),此时(kind="violin");boxenplot(),此时(kind="boxen")
分类估计图, pointplot(),此时(kind="point");barplot(),此时(kind="bar");countplot(),此时(kind="count")
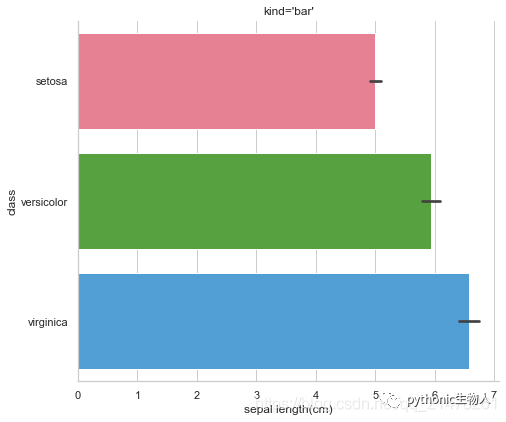
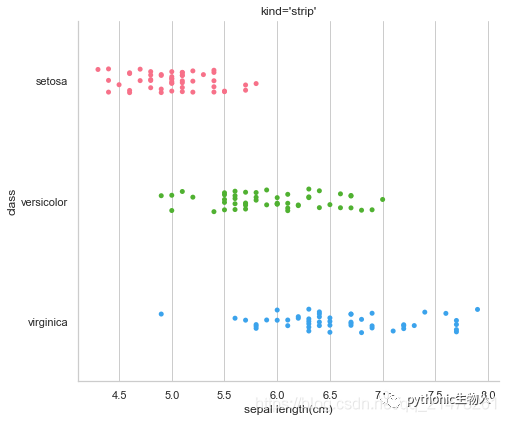
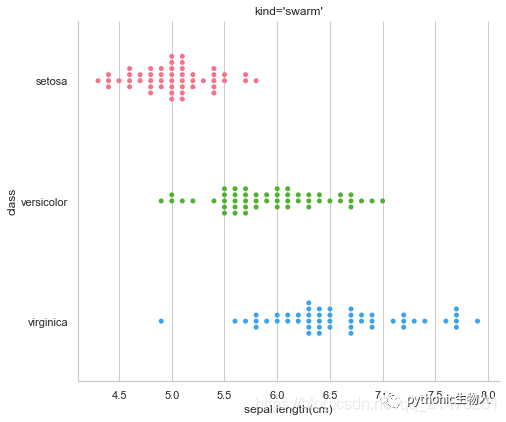
8类图长什么样子?(以下绘图使用鸢尾花数据集)
for i in  list("point, bar, strip, swarm, box, violin, boxen".split(', ')):
    g=sns.catplot(x='sepal length(cm)', y='class', data=pd_iris, kind='%s'%i,
                  palette='husl',
                 )
    plt.title("kind='%s'"%i)
    g.fig.set_size_inches(8,6)#设置图形大小
g=sns.catplot(x='sepal length(cm)', hue='class', data=pd_iris, kind='count',
              palette='husl',
             )
plt.title("kind='count'")
g.fig.set_size_inches(12,8)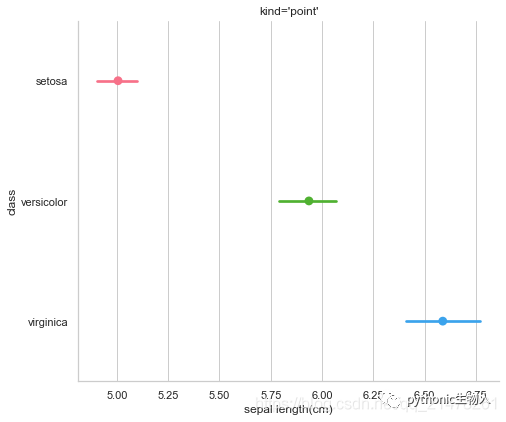
2、绘图数据集准备
还是使用鸢尾花iris数据集:Python可视化|matplotlib10-绘制散点图scatter
#导入本帖要用到的库,声明如下:import matplotlib.pyplot as pltimport numpy as npimport pandas as pd import palettablefrom pandas import Series,DataFramefrom sklearn import datasetsimport seaborn as snsimport palettable#导入鸢尾花iris数据集(方法一)#该方法更有助于理解数据集
iris=datasets.load_iris()
x, y =iris.data,iris.target
y_1 = np.array(['setosa' if i==0 else 'versicolor' if i==1 else 'virginica' for i in y])
pd_iris = pd.DataFrame(np.hstack((x, y_1.reshape(150,1))),columns=['sepal length(cm)','sepal width(cm)','petal length(cm)','petal width(cm)','class'])#astype修改pd_iris中数据类型object为float64
pd_iris['sepal length(cm)']=pd_iris['sepal length(cm)'].astype('float64')
pd_iris['sepal width(cm)']=pd_iris['sepal width(cm)'].astype('float64')
pd_iris['petal length(cm)']=pd_iris['petal length(cm)'].astype('float64')
pd_iris['petal width(cm)']=pd_iris['petal width(cm)'].astype('float64')#导入鸢尾花iris数据集(方法二)#该方法有时候会卡巴斯基,所以弃而不用#import seaborn as sns#iris_sns = sns.load_dataset("iris")
数据集查看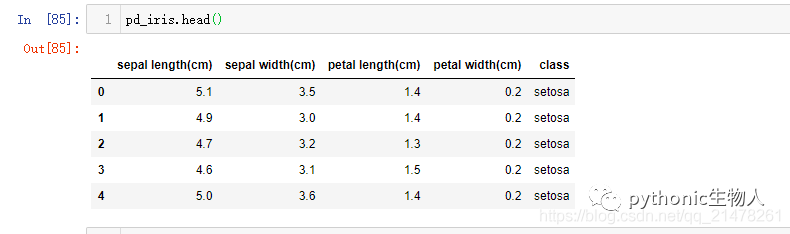
3、seaborn.stripplot(分类散点图)
使用场景:两个变量,有一个是分类变量
语法:seaborn.stripplot(x=None, y=None, hue=None, data=None, order=None, hue_order=None, jitter=True, dodge=False, orient=None, color=None, palette=None, size=5, edgecolor='gray', linewidth=0, ax=None, **kwargs)
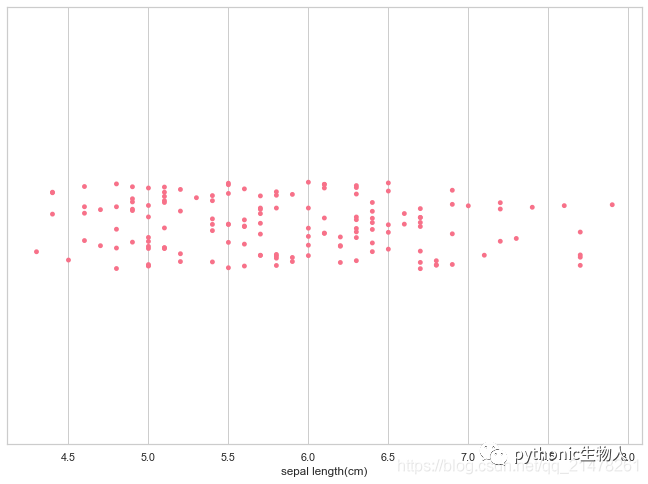
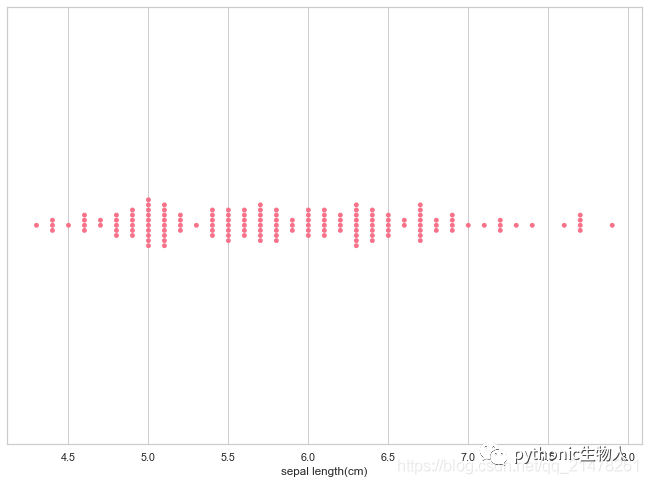
stripplot不分类散点图
#stripplot不分类散点图
plt.figure(figsize=(8,5))
sns.set(style="whitegrid")
sns.stripplot(x='sepal length(cm)',data=pd_iris,#传入数据pd_iris第一列
              palette='husl',
             )
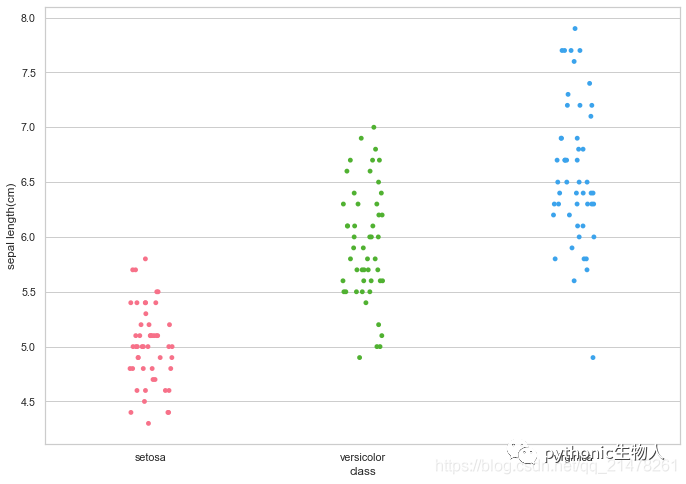
stripplot分类散点图
#stripplot分类散点图
plt.figure(dpi=70)
sns.set(style="whitegrid")
sns.stripplot(y='sepal length(cm)',x='class',data=pd_iris,#传入数据pd_iris第一列及最后一列
              palette='husl',
             )
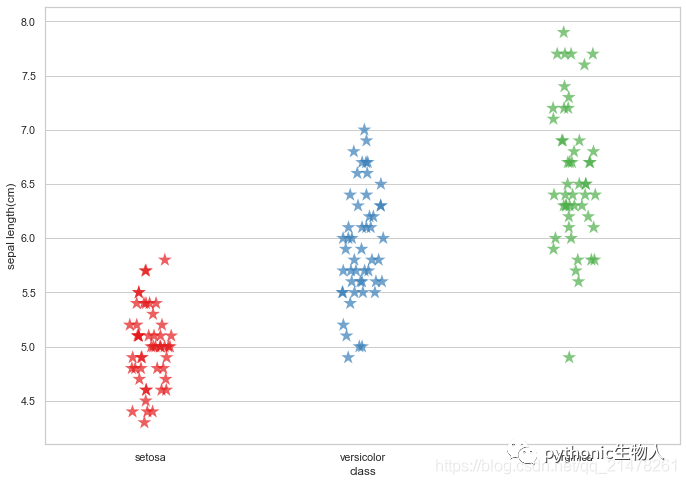
设置点的属性
#设置点的属性
plt.figure(dpi=70)
sns.set(style="whitegrid")
sns.stripplot(y='sepal length(cm)',x='class',data=pd_iris,
              palette='Set1', #marker='*',#也可如下修改marker
              **dict(marker='*',s=15,alpha=0.7),#设置点形状、大小、透明度等,更多见matplotlib.axes.Axes.scatter
             )
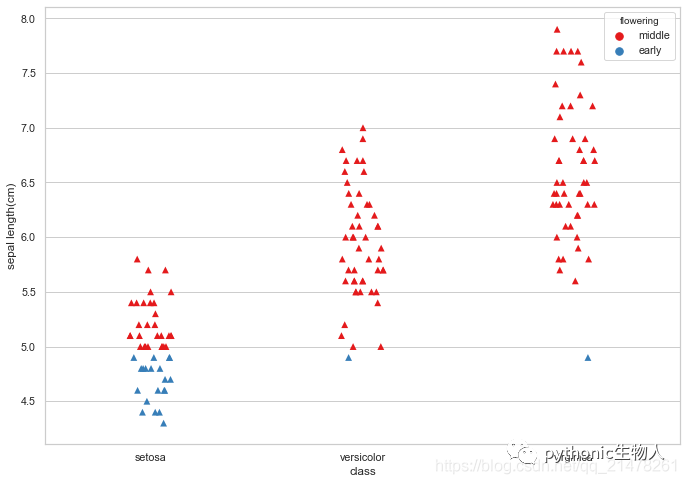
多重分类
#给数据加一列花期(上、下旬)
flowering=pd.Series(['early' if i>4.0 and i<5.0 else 'middle' for i in pd_iris['sepal length(cm)']])
pd_iris1=pd.concat([pd_iris,flowering],axis=1)#拼接,默认按行拼接,即axis=0
pd_iris1.rename(columns={0:'flowering'}, inplace = True)#替换列名称
pd_iris1.head()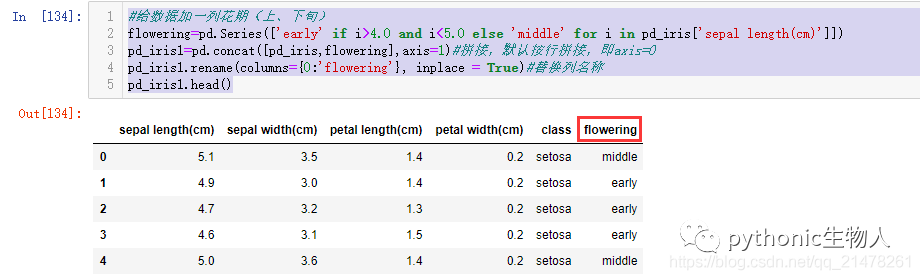
#class类下再按照flowering分类
plt.figure(dpi=70)
sns.set(style="whitegrid")
sns.stripplot(y='sepal length(cm)',x='class',hue='flowering',data=pd_iris1,#hue='flowering'添加子类
              palette='Set1',
              **dict(marker='^',s=7)
             )
catplot()结合stripplot和FacetGrid分图显示
##使用catplot()结合 barplot()和FacetGrid分图显示
plt.figure(figsize=(12,5))
sns.set(style="whitegrid")
g=sns.catplot(y='sepal length(cm)',x='class',col='flowering',data=pd_iris1,#col='flowering'
              palette='Set1',
              **dict(marker='^',s=7)
             )
g.fig.set_size_inches(12,6)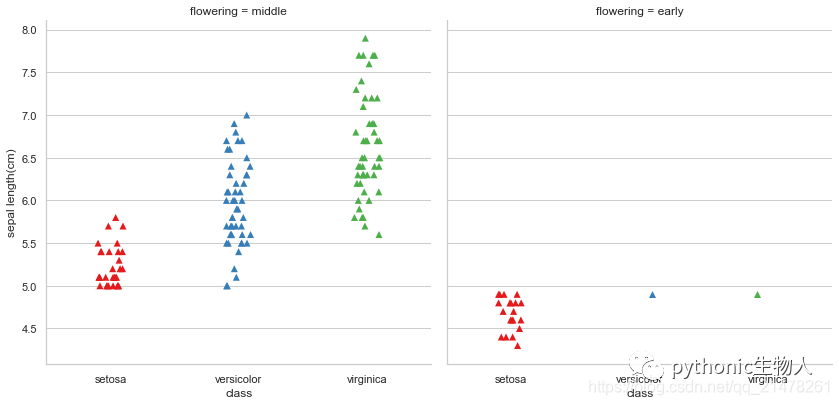
4、seaborn.swarmplot(成簇散点图)
使用场景:与stripplot()类似,只是swarmplot中数据点经过了成簇处理【the points are adjusted (only along the categorical axis) so that they don’t overlap.】,是数据点不重叠的stripplot()
语法:seaborn.swarmplot(x=None, y=None, hue=None, data=None, order=None, hue_order=None, dodge=False, orient=None, color=None, palette=None, size=5, edgecolor='gray', linewidth=0, ax=None, **kwargs)参数和stripplot()一样,简单介绍下。
swarmplot不分类散点图
#swarmplot不分类散点图
plt.figure(dpi=70)
sns.set(style="whitegrid")
sns.swarmplot(x='sepal length(cm)',data=pd_iris,#传入数据pd_iris第一列
              palette='husl',
             )
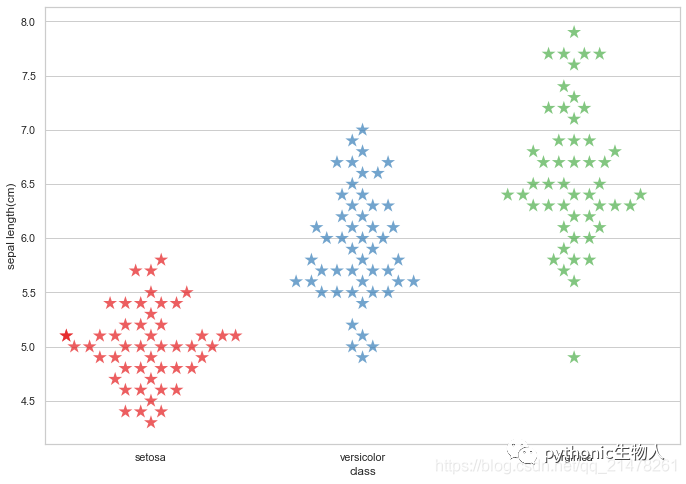
设置点的属性
#设置点的属性
plt.figure(dpi=70)
sns.set(style="whitegrid")
sns.swarmplot(y='sepal length(cm)',x='class',data=pd_iris,
              palette='Set1', #marker='*',#也可如下修改marker
              **dict(marker='*',s=15,alpha=0.7),#设置点形状、大小、透明度等,更多见matplotlib.axes.Axes.scatter
             )
5、seaborn.boxplot**(箱图或箱线图)**
详细见:Python可视化17seaborn-箱图boxplot
6、seaborn.violinplot(小提琴图)
更多可参考:Python可视化17seaborn-箱图boxplot语法:seaborn.violinplot(x=None, y=None, hue=None, data=None, order=None, hue_order=None, bw='scott', cut=2, scale='area', scale_hue=True, gridsize=100, width=0.8, inner='box', split=False, dodge=True, orient=None, linewidth=None, color=None, palette=None, saturation=0.75, ax=None, **kwargs)
以下介绍部分特异参数。
不分类小提琴图
#sepal length(cm)不分类小提琴图
plt.figure(dpi=70)
sns.set(style="whitegrid")
sns.violinplot(y='sepal length(cm)',data=pd_iris,#传入数据pd_iris第一列
              palette=palettable.cartocolors.qualitative.Bold_9.mpl_colors,
             )
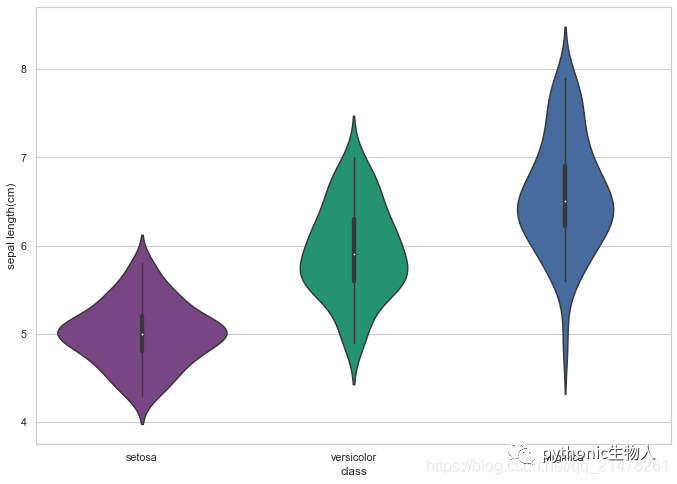
分类小提琴图
#按class分类小提琴图
plt.figure(dpi=70)
sns.set(style="whitegrid")
sns.violinplot(y='sepal length(cm)',x='class',data=pd_iris1,
              palette=palettable.cartocolors.qualitative.Bold_9.mpl_colors,
             )
inner参数
箱子中间图形显示模式
#中间显示模式inner参数for i in list('box,quartile,point,stick'.split(',')):
    plt.figure(dpi=70)
    sns.set(style="whitegrid")
    sns.violinplot(y='sepal length(cm)',x='class',data=pd_iris1,
                   palette=palettable.cartocolors.qualitative.Bold_9.mpl_colors,
                   inner='%s'%i,#可选{“box”(默认), “quartile”, “point”, “stick”, None}
                  )
    plt.title("inner='%s'"%i)
plt.figure(dpi=70)
sns.set(style="whitegrid")
sns.violinplot(y='sepal length(cm)',x='class',data=pd_iris1,
               palette=palettable.cartocolors.qualitative.Bold_9.mpl_colors,
               inner=None,
              )
plt.title("inner=None")


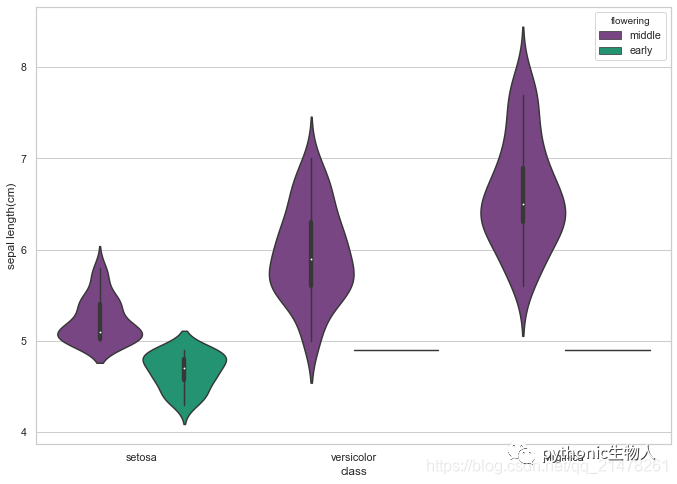
多重分类小提琴图
#按class分类后再按flowering分类小提琴图
plt.figure(dpi=70)
sns.set(style="whitegrid")
sns.violinplot(y='sepal length(cm)',x='class',hue='flowering',data=pd_iris1,
              palette=palettable.cartocolors.qualitative.Bold_9.mpl_colors,
             )
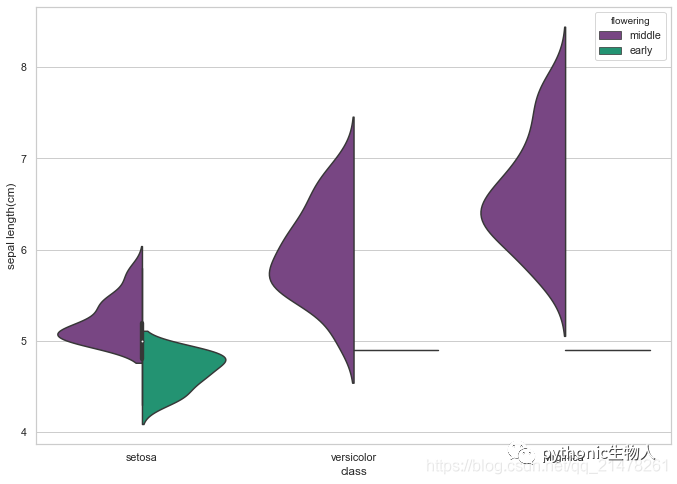
多重分类左右显示小提琴图
#按class分类后再按flowering分类左右显示小提琴图
plt.figure(figsize=(8,5))
sns.set(style="whitegrid")
sns.violinplot(y='sepal length(cm)',x='class',hue='flowering',data=pd_iris1,
              palette=palettable.cartocolors.qualitative.Bold_9.mpl_colors,
               split=True#左右显示flowering分类
             )
参考资料
同系列文章
- http://seaborn.pydata.org/generated/seaborn.catplot.html#seaborn.catplot
Python可视化17seborn-箱图boxplotPython可视化20|Seaborn散点图&&折线图
原创不易"点赞"、"在看"鼓 励下呗
励下呗
 !
!


 221
221


 被折叠的 条评论
为什么被折叠?
被折叠的 条评论
为什么被折叠?
 到【灌水乐园】发言


