


前言
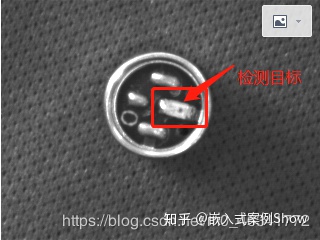
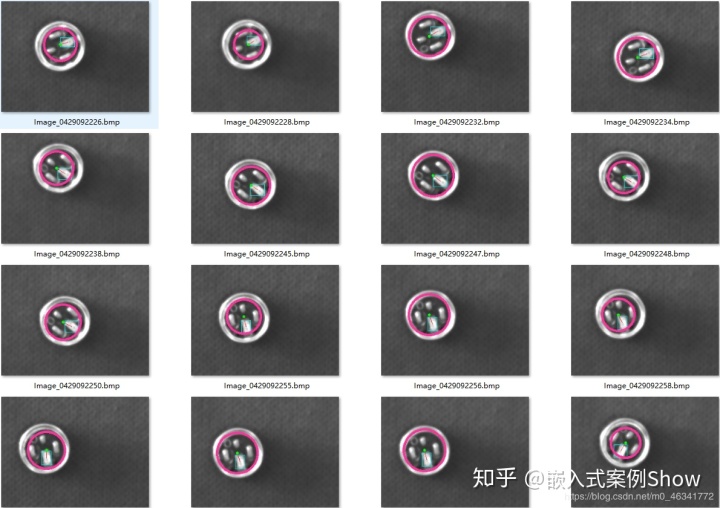
上一篇为文中和大家分享如何检测图像中的圆,本篇继续和大家分享项目中的其他内容,项目的目标是坚持检测物体中的一个晶体,并计算它的偏移角度。
思路
- 检测图像中的圆形,并把圆形的区域裁剪下来,这样就可以排除一些干扰,这一步前面一篇文章已经分享。

- 对裁剪得到的图进行二值化处理。
- 寻找最大的目标块,找到目标块的中心点,根据该点和圆心的点计算角度。
知识点
- 二值化 图像的二值化就是将图像上的像素点的灰度值设置为0或255,这样将使整个图像呈现出明显的黑白效果。在数字图像处理中,二值图像占有非常重要的地位,图像的二值化使图像中数据量大为减少,从而能凸显出目标的轮廓。OpenCV中提供了函数cv::threshold(); 函数原型:
double cv::threshold(InputArray src,
                       OutputArray dst,
                       double thresh,
                       double maxval,
                       int type)
参数说明 src:源图像,可以为8位的灰度图,也可以为32位的彩色图像。(两者由区别) dst:输出图像 thresh:阈值 maxval:dst图像中最大值 type:阈值类型,可以具体类型如下:
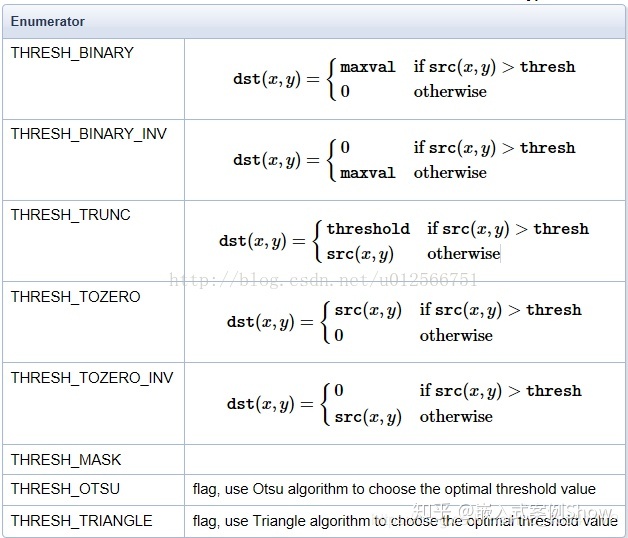
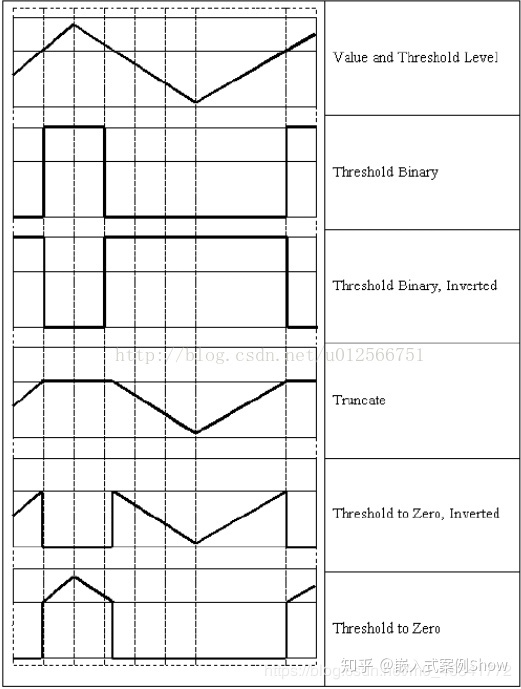
生成关系如下表:
- 连通域分析 函数原型:
int  cv::connectedComponents (
    cv::InputArrayn image,                // //8位单通道二值图像 (binary)
    cv::OutputArray labels,               // output label map //和原图一样大的标记图
    int             connectivity = 8,     // 4- or 8-connected components
    int             ltype        = CV_32S // Output label type (CV_32S or CV_16U)
    );

int  cv::connectedComponentsWithStats (
    cv::InputArrayn image,                // input 8-bit single-channel (binary)
    cv::OutputArray labels,               // output label map
    cv::OutputArray stats,                // Nx5 matrix (CV_32S) of statistics:
                                          // [x0, y0, width0, height0, area0;//nccomps×5的矩阵 表示每个连通区域的外接矩形和面积(pixel)
                                          //  ... ; x(N-1), y(N-1), width(N-1), height(N-1), area(N-1)]
    cv::OutputArray centroids,          //nccomps×2的矩阵 表示每个连通区域的质心(pixel)Nx2 CV_64F matrix of centroids: [ cx0, cy0; ... ; cx(N-1), cy(N-1)]
    int             connectivity = 8,     // 4- or 8-connected components
    int             ltype        = CV_32S // Output label type (CV_32S or CV_16U)
    );
其中connectedComponents()仅仅创建了一个标记图(图中不同连通域使用不同的标记,和原图宽高一致),connectedComponentsWithStats()可以完成上面任务,除此之外,还可以返回每个连通区域的重要信息--bounding box, area, andcentroid
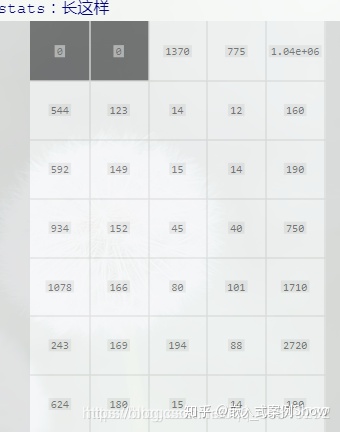
参数说明: 该函数有返回值,返回一个int整型 nccomps,函数返回值为连通区域的总数N,范围为[0,N-1],其中0代表背景。 image:输入8位单通道二值图像; label:输出,和原图image一样大的标记图,label对应于表示是当前像素是第几个轮廓,背景置0; centroids:对应的是轮廓的中心点。nccomps×2的矩阵 表示每个连通区域的质心 stats:输出,nccomps×5的矩阵 ,表示每个连通区域的外接矩形和面积(pixel),例如下列:
最终效果:
部分代码
Mat cimg;
    medianBlur(src,src,5);

    cvtColor(src,cimg,COLOR_BGR2GRAY);
    GaussianBlur(cimg,cimg,Size(9,9),2,2);
    Canny(cimg,cimg,10,250,5);
    //imwrite("canny1.bmp",cimg);
    vector<Vec3f> circles;
    size_t i;
    for(i = 0; i < 5; i++)
    {
        circles.clear();
        HoughCircles(cimg,circles,HOUGH_GRADIENT,1,30,100,100-i*10,10,120);
        printf("circles.size()=%dn",circles.size());
        if(circles.size() > 0)
        {
            break;
        }
    }

    int maxRadius = 0;
    int m = 0;
    for( i = 0; i < circles.size(); i++)
    {
        int radius = cvRound(circles[i][2]);
        if(maxRadius < radius)
        {
            maxRadius = radius;
            m = i;
        }
    }
    Point center(cvRound(circles[m][0]),cvRound(circles[m][1]));
    printf("maxRadius= %dn",maxRadius);
    maxRadius = maxRadius-10;
    Mat srcMat=src(Rect(center.x-maxRadius,center.y-maxRadius,maxRadius*2,maxRadius*2));
    //imwrite("22.bmp",srcMat);

    Mat lableMat;
    Mat statsMat;
    Mat centerMat;
    Mat srcMat1;// = imread("D:opencv_picture_test轮廓die_on_chip.png", 1);     //读取灰度
    Mat dstMat;

    cvtColor(srcMat, srcMat1, COLOR_BGR2GRAY);
    //调用阈值函数
    threshold(srcMat1, dstMat, 150, 255,THRESH_BINARY);
    //imshow("bin", dstMat);
    //腐蚀操作
    //Mat element = getStructuringElement(MORPH_ELLIPSE, Size(9,9));
    //morphologyEx(dstMat,dstMat, MORPH_ERODE, element);
    int nComp = cv::connectedComponentsWithStats(dstMat,
        lableMat,
        statsMat,
        centerMat,
        8,
        CV_32S);

    int maxSize = 0;
    m = 1;
    for (int i = 1; i < nComp; i++)
    {
        if(maxSize < statsMat.at<int>(i, 4) && statsMat.at<int>(i, 2) < 60 && statsMat.at<int>(i, 3) < 60)
        {
            maxSize = statsMat.at<int>(i, 4);
            m = i;
        }

    }
    Rect bndbox;
    bndbox.x = statsMat.at<int>(m, 0);
    bndbox.y = statsMat.at<int>(m, 1);
    bndbox.width = statsMat.at<int>(m, 2);
    bndbox.height = statsMat.at<int>(m, 3);
    //if (fabs(bndbox.width * 1.0 / bndbox.height - 1) < 0.2 && statsMat.at<int>(i, 4)>=20)
    rectangle(srcMat, bndbox, CV_RGB(0, 255, 255), 1, 8, 0);
    line(srcMat, Point(srcMat.cols/2, srcMat.rows/2), Point(bndbox.x+bndbox.width/2, bndbox.y+bndbox.height/2), Scalar(0, 0, 255), 1);
THE END

扫描上方二维码关注“嵌入式案例Show”公众号,看更多嵌入式案例


 9672
9672


 被折叠的 条评论
为什么被折叠?
被折叠的 条评论
为什么被折叠?
 到【灌水乐园】发言


