


为了能够完全确定您存储数据的方式是否正确,您应该考虑如何使用它。如果您只想使用它来绘制,那么为了简单起见,您可以使用三个1D数组。但是,如果您希望实现更紧凑的结构,可以考虑使用带有custom dtype的2D数组。在
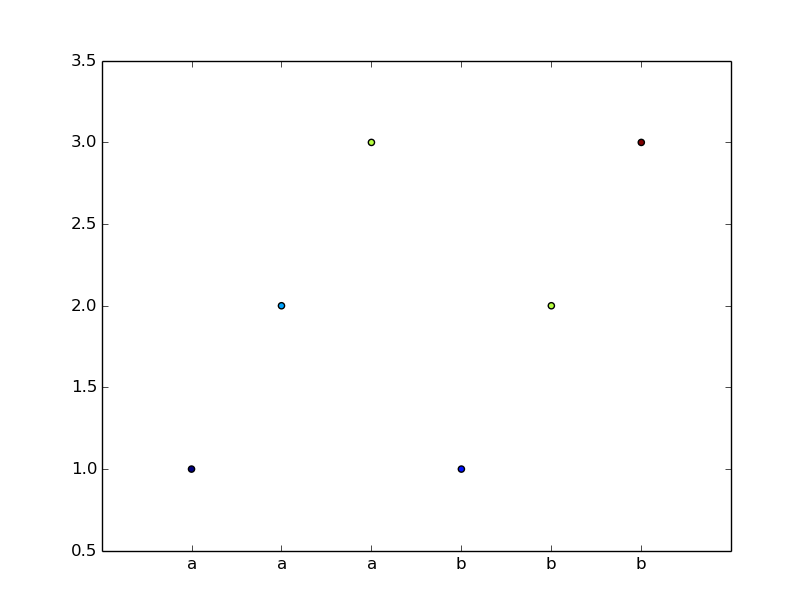
记住这一点,您可以轻松地创建具有不同颜色的二维散点图,其中确切的颜色由与每个对(字母、数字)相关联的值确定。在import numpy as np
from matplotlib import pyplot as plt
from matplotlib import cm
# You might note that in this simple case using numpy for creating array
# was actually unnecessary as simple lists would suffice
letters = np.array(['a', 'a', 'a', 'b', 'b', 'b'])
numbers = np.array([1, 2, 3, 1, 2, 3])
values = np.array([1, 2, 3, 1.5, 3.5, 4.5])
items = len(letters)
# x and y should be numbers, so we first feed it some integers
# Parameter c defines color values and cmap defines color mappings
plt.scatter(xrange(items), numbers, c=values, cmap=cm.jet)
# Now that data is created, we can re-set xticks
plt.xticks(xrange(items), letters)
希望这足以让你有个好的开始。在


 1万+
1万+


 被折叠的 条评论
为什么被折叠?
被折叠的 条评论
为什么被折叠?
 到【灌水乐园】发言


