


clear,clc,close all;
t_start=tic;
tl=0.1;
f1=20;
f2=20.02;
fs=60;%抽样频率
N=60;%抽样点数


O0=0;%函数的起始相位角弧度制
cnt1=1;
fs=50;
for N=10:30:1000
    disp(strcat(strcat('第',num2str(cnt1)),'次运算'));%Amp_max1从12列之后的是找到的极大值的索引值,inf是出错补的值
   Amp_max1(cnt1,:)=spect_function(f1,fs,N,O0,tl);
    cnt1=cnt1+1;
end
 close all;
N=200;
cnt2=1
for fs=50:50:2500
    disp(strcat(strcat('第',num2str(cnt2)),'次运算'));
    Amp_max2(cnt2,:)=spect_function(f1,fs,N,O0,tl);
    cnt2=cnt2+1;
end
close all;
Amp_max1=Copy_of_spect_function(f1,f2,fs,N,O0,tl);
cnt1=1;
fs=50;
 for N=500:500:5000%N=10:30:1000%
    disp(strcat(strcat('第',num2str(cnt1)),'次运算'));
     Amp_max3(cnt1,:)=Copy_of_spect_function(f1,f2,fs,N,O0,tl);
    cnt1=cnt1+1;
end

close all
N=60000;
cnt2=1
for fs=50:50:1000
    disp(strcat(strcat('第',num2str(cnt2)),'次运算'));
    Amp_max4(cnt2,:)=Copy_of_spect_function(f1,f2,fs,N,O0,tl);
    cnt2=cnt2+1;
end
 close all;
 t_end=toc(t_start);
 disp(strcat('程序的运行时间是:',num2str(t_end)));
被调函数1:
function [ Amp_max ] = spect_function( f1,fs,N ,O0,t1)
n=0:N-1;
x=cos(2*pi*f1*n/fs+O0);
figure;
t=0:0.0001:(N-1)/fs;
subplot(311);
plot(t,cos(2*pi*f1*t+O0));title('cos(2*pi*f1*t+O0)');grid on;
subplot(312)
%f = (0:N-1)*fs/N;
% plot(n*fs/N,x,'*');hold on;plot(n*fs/N,x)
plot(n/fs,x,'*');hold on;plot(n/fs,x);xlabel('t/s');
title(strcat(strcat(strcat('f=',num2str(f1)),strcat(',fs=',num2str(fs))),strcat(',N=',num2str(N))));
grid on;
X = fftshift(fft(x./N));
f = (-N/2:N/2-1)*(fs/N);
subplot(313)
plot(f,abs(X));
hold  on;X_f=abs(X);
X_f_max_index=find(X_f==max(X_f));
plot(f(X_f_max_index),X_f(X_f_max_index),'*');
xlabel('f/Hz');ylabel('幅度')
title(strcat(strcat(strcat('f=',num2str(f1)),strcat(',fs=',num2str(fs))),strcat(',N=',num2str(N))));
grid on;
hold off;
Amp_max=[f(X_f_max_index),X_f(X_f_max_index)];
Amp_max=[f1,fs,N,Amp_max];
[M1,N1]=size(Amp_max);
Amp_max(1,8)=0;
while N1<7
    Amp_max=[Amp_max,inf];
    [M1,N1]=size(Amp_max);
    Amp_max(1,8)=1;
end
if N1>7
    Amp_max=Amp_max(1:7);
    Amp_max(1,8)=-1;
end
disp(strcat(strcat(strcat('f=',num2str(f1)),strcat(',fs=',num2str(fs))),strcat(',N=',num2str(N))));
disp(strcat(strcat('幅度最大值对应的频率是:',num2str(f(X_f_max_index))),strcat('   幅度最大值是:',num2str(X_f(X_f_max_index)))));
s1=sum(x.^2);
s2=sum(abs(fft(x)).^2)/N;
Amp_max(1,9)=s1;
Amp_max(1,10)=s2;
flag=0;
if abs(s1-s2)<=10^-5
    flag=1;
    disp(strcat(strcat(strcat('时域能量:',num2str(s1)),strcat(',频域能量:',num2str(s2))),'满足帕塞瓦尔定理'));
else
    disp(strcat(strcat(strcat('时域能量:',num2str(s1)),strcat(',频域能量:',num2str(s2))),'不满足帕塞瓦尔定理'));
end
Amp_max(1,11)=flag;
disp('----------------------------------');

if(length(X_f_max_index)~=2)
    if length(X_f_max_index)>2
        X_f_max_index=X_f_max_index(1:2);
    end
    while length(X_f_max_index)<2
        X_f_max_index=[X_f_max_index,inf];
    end
end
Amp_max=[Amp_max,X_f_max_index];%加上最大值的索引k值
% pause(tl);
pause(t1);
end
被调函数2:
function [ Amp_max ] = Copy_of_spect_function( f1,f2,fs,N,O0,t1 )
n=0:N-1;
x=cos(2*pi*f1*n/fs+O0)+cos(2*pi*f2*n/fs+O0);
figure;
t=0:0.0001:(N-1)/fs;
subplot(311);
plot(t,cos(2*pi*f1*t+O0)+cos(2*pi*f2*t+O0));title('原始信号cos(2*pi*f1*t+O0)+cos(2*pi*f2*t+O0)');grid on;
subplot(312)
plot(n/fs,x,'*');hold on;plot(n/fs,x)
xlabel('t/s');
title(strcat(strcat('f2=',num2str(f2)),strcat(strcat(strcat(' f1=',num2str(f1)),strcat(',fs=',num2str(fs))),strcat(',N=',num2str(N)))));
%axis([-inf inf -1 1]);
grid on;
X = fftshift(fft(x./N));
f = (-N/2:N/2-1)*(fs/N);
subplot(313)
plot(f,abs(X));
hold  on;
X_f=abs(X);
X_f_max_index=find(X_f==max(X_f));
plot(f(X_f_max_index),X_f(X_f_max_index),'*');
xlabel('f/Hz')
ylabel('幅度')
%axis([19 ,19.4,-inf inf]);
title(strcat(strcat('f2=',num2str(f2)),strcat(strcat(strcat(' f1=',num2str(f1)),strcat(',fs=',num2str(fs))),strcat(',N=',num2str(N)))));
grid on;hold off;figure;subplot(311)
plot(f,abs(X));%画双侧频谱幅度图
hold  on;X_f=abs(X);
X_f_max_index=find(X_f==max(X_f));
plot(f(X_f_max_index),X_f(X_f_max_index),'*');
xlabel('f/Hz')
ylabel('幅度')
title(strcat(strcat('f2=',num2str(f2)),strcat(strcat(strcat(' f1=',num2str(f1)),strcat(',fs=',num2str(fs))),strcat(',N=',num2str(N)))));
grid on;
hold off;
subplot(312)
plot(f,abs(X));
hold  on;
X_f=abs(X);
X_f_max_index=find(X_f==max(X_f));
plot(f(X_f_max_index),X_f(X_f_max_index),'*');
xlabel('f/Hz')
ylabel('幅度');axis([-20.1 ,-19.9,-inf inf]);
title('负频谱');grid on;hold off;subplot(313)
plot(f,abs(X));%画双侧频谱幅度图
hold  on;X_f=abs(X);
X_f_max_index=find(X_f==max(X_f));
plot(f(X_f_max_index),X_f(X_f_max_index),'*');
xlabel('f/Hz');ylabel('幅度')
axis([19.9 ,20.1,-inf inf]);
title('正频谱');grid on;hold off;
Amp_max=[f(X_f_max_index),X_f(X_f_max_index)
];
Amp_max=[f1,fs,N,Amp_max];
[M1,N1]=size(Amp_max);
Amp_max(1,8)=0;
while N1<7
    Amp_max=[Amp_max,inf];%异常处理机制
    [M1,N1]=size(Amp_max);
    Amp_max(1,8)=1;
end
if N1>7
    Amp_max=Amp_max(1:7);%异常处理机制
    Amp_max(1,8)=-1;
end
disp((strcat(strcat('f2=',num2str(f2)),strcat(strcat(strcat(' f1=',num2str(f1)),strcat(',fs=',num2str(fs))),strcat(',N=',num2str(N))))));
disp(strcat(strcat('幅度最大值对应的频率是:',num2str(f(X_f_max_index))),strcat('   幅度最大值是:',num2str(X_f(X_f_max_index)))));
s1=sum(x.^2);
s2=sum(abs(fft(x)).^2)/N;
Amp_max(1,9)=s1;%信号时域能量
Amp_max(1,10)=s2;%信号频域能量
flag=0;
if abs(s1-s2)<=10^-5
    flag=1;
    disp(strcat(strcat(strcat('时域能量:',num2str(s1)),strcat(',频域能量:',num2str(s2))),'满足帕塞瓦尔定理'));
else
    disp(strcat(strcat(strcat('时域能量:',num2str(s1)),strcat(',频域能量:',num2str(s2))),'不满足帕塞瓦尔定理'));
end
Amp_max(1,11)=flag;
disp('----------------------------------');
pause(t1);
end
代码
附件一:第一题代码
主函数
clear,clc,close all;
t_start=tic;
tl=0.1;
f1=20;
f2=20.02;
fs=60;%抽样频率
N=60;%抽样点数
O0=0;%函数的起始相位角弧度制
cnt1=1;
fs=50;
for N=10:30:1000
disp(strcat(strcat('第',num2str(cnt1)),'次运算'));%Amp_max1从12列之后的是找到的极大值的索引值,inf是出错补的值
Amp_max1(cnt1,:)=spect_function(f1,fs,N,O0,tl);
cnt1=cnt1+1;
end
close all;
N=200;
cnt2=1
for fs=50:50:2500
disp(strcat(strcat('第',num2str(cnt2)),'次运算'));
Amp_max2(cnt2,:)=spect_function(f1,fs,N,O0,tl);
cnt2=cnt2+1;
end
close all;
Amp_max1=Copy_of_spect_function(f1,f2,fs,N,O0,tl);
cnt1=1;
fs=50;
for N=500:500:5000%N=10:30:1000%
disp(strcat(strcat('第',num2str(cnt1)),'次运算'));
Amp_max3(cnt1,:)=Copy_of_spect_function(f1,f2,fs,N,O0,tl);
cnt1=cnt1+1;
end
close all
N=60000;
cnt2=1
for fs=50:50:1000
disp(strcat(strcat('第',num2str(cnt2)),'次运算'));
Amp_max4(cnt2,:)=Copy_of_spect_function(f1,f2,fs,N,O0,tl);
cnt2=cnt2+1;
end
close all;
t_end=toc(t_start);
disp(strcat('程序的运行时间是:',num2str(t_end)));
被调函数1:
function [ Amp_max ] = spect_function( f1,fs,N ,O0,t1)
n=0:N-1;
x=cos(2*pi*f1*n/fs+O0);
figure;
t=0:0.0001:(N-1)/fs;
subplot(311);
plot(t,cos(2*pi*f1*t+O0));title('cos(2*pi*f1*t+O0)');grid on;
subplot(312)
%f = (0:N-1)*fs/N;
% plot(n*fs/N,x,'*');hold on;plot(n*fs/N,x)
plot(n/fs,x,'*');hold on;plot(n/fs,x);xlabel('t/s');
title(strcat(strcat(strcat('f=',num2str(f1)),strcat(',fs=',num2str(fs))),strcat(',N=',num2str(N))));
grid on;
X = fftshift(fft(x./N));
f = (-N/2:N/2-1)*(fs/N);
subplot(313)
plot(f,abs(X));
hold on;X_f=abs(X);
X_f_max_index=find(X_f==max(X_f));
plot(f(X_f_max_index),X_f(X_f_max_index),'*');
xlabel('f/Hz');ylabel('幅度')
title(strcat(strcat(strcat('f=',num2str(f1)),strcat(',fs=',num2str(fs))),strcat(',N=',num2str(N))));
grid on;
hold off;
Amp_max=[f(X_f_max_index),X_f(X_f_max_index)];
Amp_max=[f1,fs,N,Amp_max];
[M1,N1]=size(Amp_max);
Amp_max(1,8)=0;
while N1<7
Amp_max=[Amp_max,inf];
[M1,N1]=size(Amp_max);
Amp_max(1,8)=1;
end
if N1>7
Amp_max=Amp_max(1:7);
Amp_max(1,8)=-1;
end
disp(strcat(strcat(strcat('f=',num2str(f1)),strcat(',fs=',num2str(fs))),strcat(',N=',num2str(N))));
disp(strcat(strcat('幅度最大值对应的频率是:',num2str(f(X_f_max_index))),strcat(' 幅度最大值是:',num2str(X_f(X_f_max_index)))));
s1=sum(x.^2);
s2=sum(abs(fft(x)).^2)/N;
Amp_max(1,9)=s1;
Amp_max(1,10)=s2;
flag=0;
if abs(s1-s2)<=10^-5
flag=1;
disp(strcat(strcat(strcat('时域能量:',num2str(s1)),strcat(',频域能量:',num2str(s2))),'满足帕塞瓦尔定理'));
else
disp(strcat(strcat(strcat('时域能量:',num2str(s1)),strcat(',频域能量:',num2str(s2))),'不满足帕塞瓦尔定理'));
end
Amp_max(1,11)=flag;
disp('----------------------------------');
if(length(X_f_max_index)~=2)
if length(X_f_max_index)>2
X_f_max_index=X_f_max_index(1:2);
end
while length(X_f_max_index)<2
X_f_max_index=[X_f_max_index,inf];
end
end
Amp_max=[Amp_max,X_f_max_index];%加上最大值的索引k值
% pause(tl);
pause(t1);
end
被调函数2:
function [ Amp_max ] = Copy_of_spect_function( f1,f2,fs,N,O0,t1 )
n=0:N-1;
x=cos(2*pi*f1*n/fs+O0)+cos(2*pi*f2*n/fs+O0);
figure;
t=0:0.0001:(N-1)/fs;
subplot(311);
plot(t,cos(2*pi*f1*t+O0)+cos(2*pi*f2*t+O0));title('原始信号cos(2*pi*f1*t+O0)+cos(2*pi*f2*t+O0)');grid on;
subplot(312)
plot(n/fs,x,'*');hold on;plot(n/fs,x)
xlabel('t/s');
title(strcat(strcat('f2=',num2str(f2)),strcat(strcat(strcat(' f1=',num2str(f1)),strcat(',fs=',num2str(fs))),strcat(',N=',num2str(N)))));
%axis([-inf inf -1 1]);
grid on;
X = fftshift(fft(x./N));
f = (-N/2:N/2-1)*(fs/N);
subplot(313)
plot(f,abs(X));
hold on;
X_f=abs(X);
X_f_max_index=find(X_f==max(X_f));
plot(f(X_f_max_index),X_f(X_f_max_index),'*');
xlabel('f/Hz')
ylabel('幅度')
%axis([19 ,19.4,-inf inf]);
title(strcat(strcat('f2=',num2str(f2)),strcat(strcat(strcat(' f1=',num2str(f1)),strcat(',fs=',num2str(fs))),strcat(',N=',num2str(N)))));
grid on;hold off;figure;subplot(311)
plot(f,abs(X));%画双侧频谱幅度图
hold on;X_f=abs(X);
X_f_max_index=find(X_f==max(X_f));
plot(f(X_f_max_index),X_f(X_f_max_index),'*');
xlabel('f/Hz')
ylabel('幅度')
title(strcat(strcat('f2=',num2str(f2)),strcat(strcat(strcat(' f1=',num2str(f1)),strcat(',fs=',num2str(fs))),strcat(',N=',num2str(N)))));
grid on;
hold off;
subplot(312)
plot(f,abs(X));
hold on;
X_f=abs(X);
X_f_max_index=find(X_f==max(X_f));
plot(f(X_f_max_index),X_f(X_f_max_index),'*');
xlabel('f/Hz')
ylabel('幅度');axis([-20.1 ,-19.9,-inf inf]);
title('负频谱');grid on;hold off;subplot(313)
plot(f,abs(X));%画双侧频谱幅度图
hold on;X_f=abs(X);
X_f_max_index=find(X_f==max(X_f));
plot(f(X_f_max_index),X_f(X_f_max_index),'*');
xlabel('f/Hz');ylabel('幅度')
axis([19.9 ,20.1,-inf inf]);
title('正频谱');grid on;hold off;
Amp_max=[f(X_f_max_index),X_f(X_f_max_index)
];
Amp_max=[f1,fs,N,Amp_max];
[M1,N1]=size(Amp_max);
Amp_max(1,8)=0;
while N1<7
Amp_max=[Amp_max,inf];%异常处理机制
[M1,N1]=size(Amp_max);
Amp_max(1,8)=1;
end
if N1>7
Amp_max=Amp_max(1:7);%异常处理机制
Amp_max(1,8)=-1;
end
disp((strcat(strcat('f2=',num2str(f2)),strcat(strcat(strcat(' f1=',num2str(f1)),strcat(',fs=',num2str(fs))),strcat(',N=',num2str(N))))));
disp(strcat(strcat('幅度最大值对应的频率是:',num2str(f(X_f_max_index))),strcat(' 幅度最大值是:',num2str(X_f(X_f_max_index)))));
s1=sum(x.^2);
s2=sum(abs(fft(x)).^2)/N;
Amp_max(1,9)=s1;%信号时域能量
Amp_max(1,10)=s2;%信号频域能量
flag=0;
if abs(s1-s2)<=10^-5
flag=1;
disp(strcat(strcat(strcat('时域能量:',num2str(s1)),strcat(',频域能量:',num2str(s2))),'满足帕塞瓦尔定理'));
else
disp(strcat(strcat(strcat('时域能量:',num2str(s1)),strcat(',频域能量:',num2str(s2))),'不满足帕塞瓦尔定理'));
end
Amp_max(1,11)=flag;
disp('----------------------------------');
pause(t1);
end
附件二:第二题代码
clear;
clc;
%对男生录音进行处理
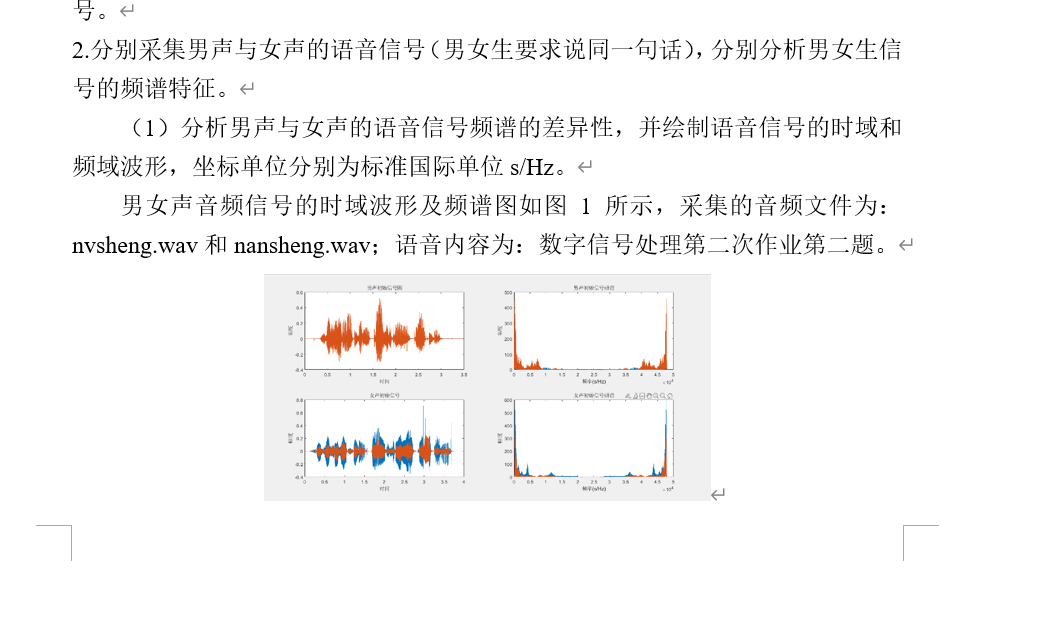
[x,xs]=audioread('F:\OneDrive\桌面\信号处理第二次作业第二题\nansheng.wav');% sound(x,xs);
% sound(x,xs);
n1=length(x);%选取变换的点数
t1=(0:n1-1)/xs;
subplot(2,2,1);plot(t1,x);
xlabel('时间');ylabel('幅度');title('男声初始信号图');
x_f=fft(x,n1); %对n点进行傅里叶变换到频域
k1=(0:n1-1)*xs/n1;
subplot(2,2,2);plot(k1,abs(x_f));title('男声初始信号频谱');
xlabel('频率(s/Hz)');ylabel('幅度');
%对女生录音进行处理
[y,ys]=audioread('F:\OneDrive\桌面\信号处理第二次作业第二题\nvsheng.wav');% sound(y,ys);
% sound(y,ys);
n2=length(y);
t2=(0:n2-1)/ys;
figure(1),subplot(2,2,3),plot(t2,y);
xlabel('时间');ylabel('幅度');title('女声初始信号');
y_f=fft(y,n1);
k2=(0:n1-1)*ys/n1;
subplot(2,2,4);plot(k2,abs(y_f));
title('女声初始信号频谱');xlabel('频率(s/Hz)');ylabel('幅度');
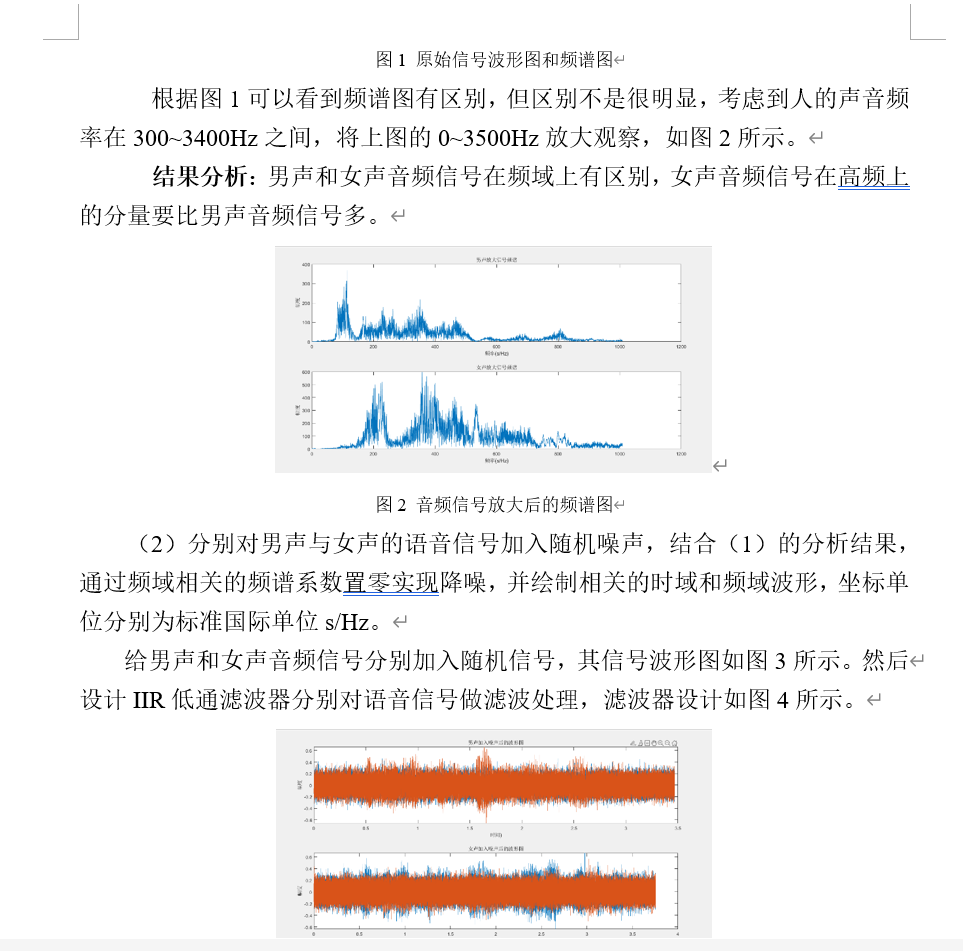
%放大到0到3500HZ观察
figure(2),subplot(211);plot(k1(1:3500),abs(x_f(1:3500)));title('男声放大信号频谱');xlabel('频率(s/Hz)');ylabel('幅度');
subplot(212);plot(k2(1:3500),abs(y_f(1:3500)));title('女声放大信号频谱');xlabel('频率(s/Hz)');ylabel('幅度');
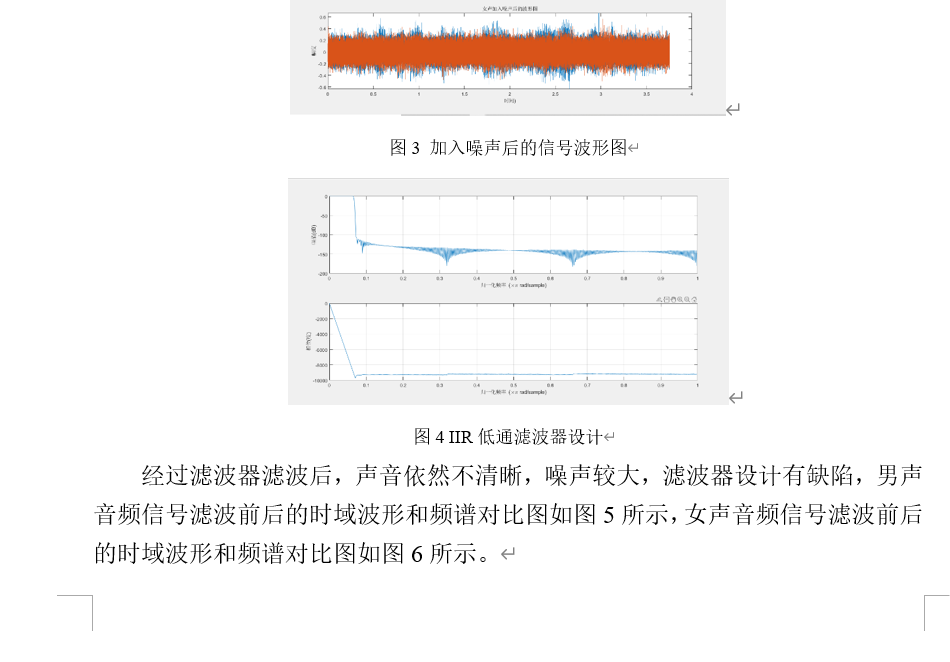
%给男生录音信号加入随机噪声
L1=length(x); %计算音频信号的长度
noise2=0.1*randn(L1,2); %产生等长度的随机噪声信号(这里的噪声的大小取决于随机函数的幅度倍数)
x_z=x+noise2; %将两个信号叠加成一个新的信号——加噪声处理
% sound(x_z,xs);
%给女生录音信号加入随机噪声
L2=length(y);
noise1=0.1*randn(L2,2);
y_z=y+noise1;
% sound(y_z,ys)
figure(3),subplot(211),plot(t1,x_z);title('男声加入噪声后的波形图');xlabel('时间)');ylabel('幅度');
subplot(212),plot(t2,y_z);title('女声加入噪声后的波形图');xlabel('时间)');ylabel('幅度');
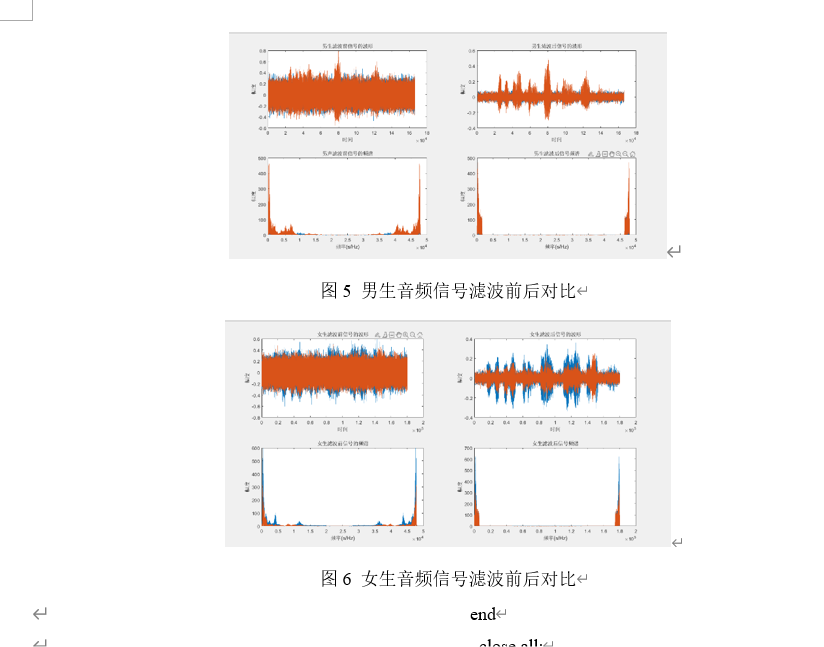
%设计滤波器
fp=1500;fc=1700;As=100;Ap=1;
%(以上为低通滤波器的性能指标)
wc=2*pi*fc/ys;
wp=2*pi*fp/ys;
wdel=wc-wp;
beta=0.112*(As-8.7);
N=ceil((As-8)/2.285/wdel);
wn= kaiser(N+1,beta);
ws=(wp+wc)/2/pi;
b=fir1(N,ws,wn);
figure(4)
freqz(b,1);
%对加噪声的女生录音滤波处理
x1=fftfilt(b,x_z);
X1=fft(x1,n1);
% sound(x1,xs); %回放滤波后的音频
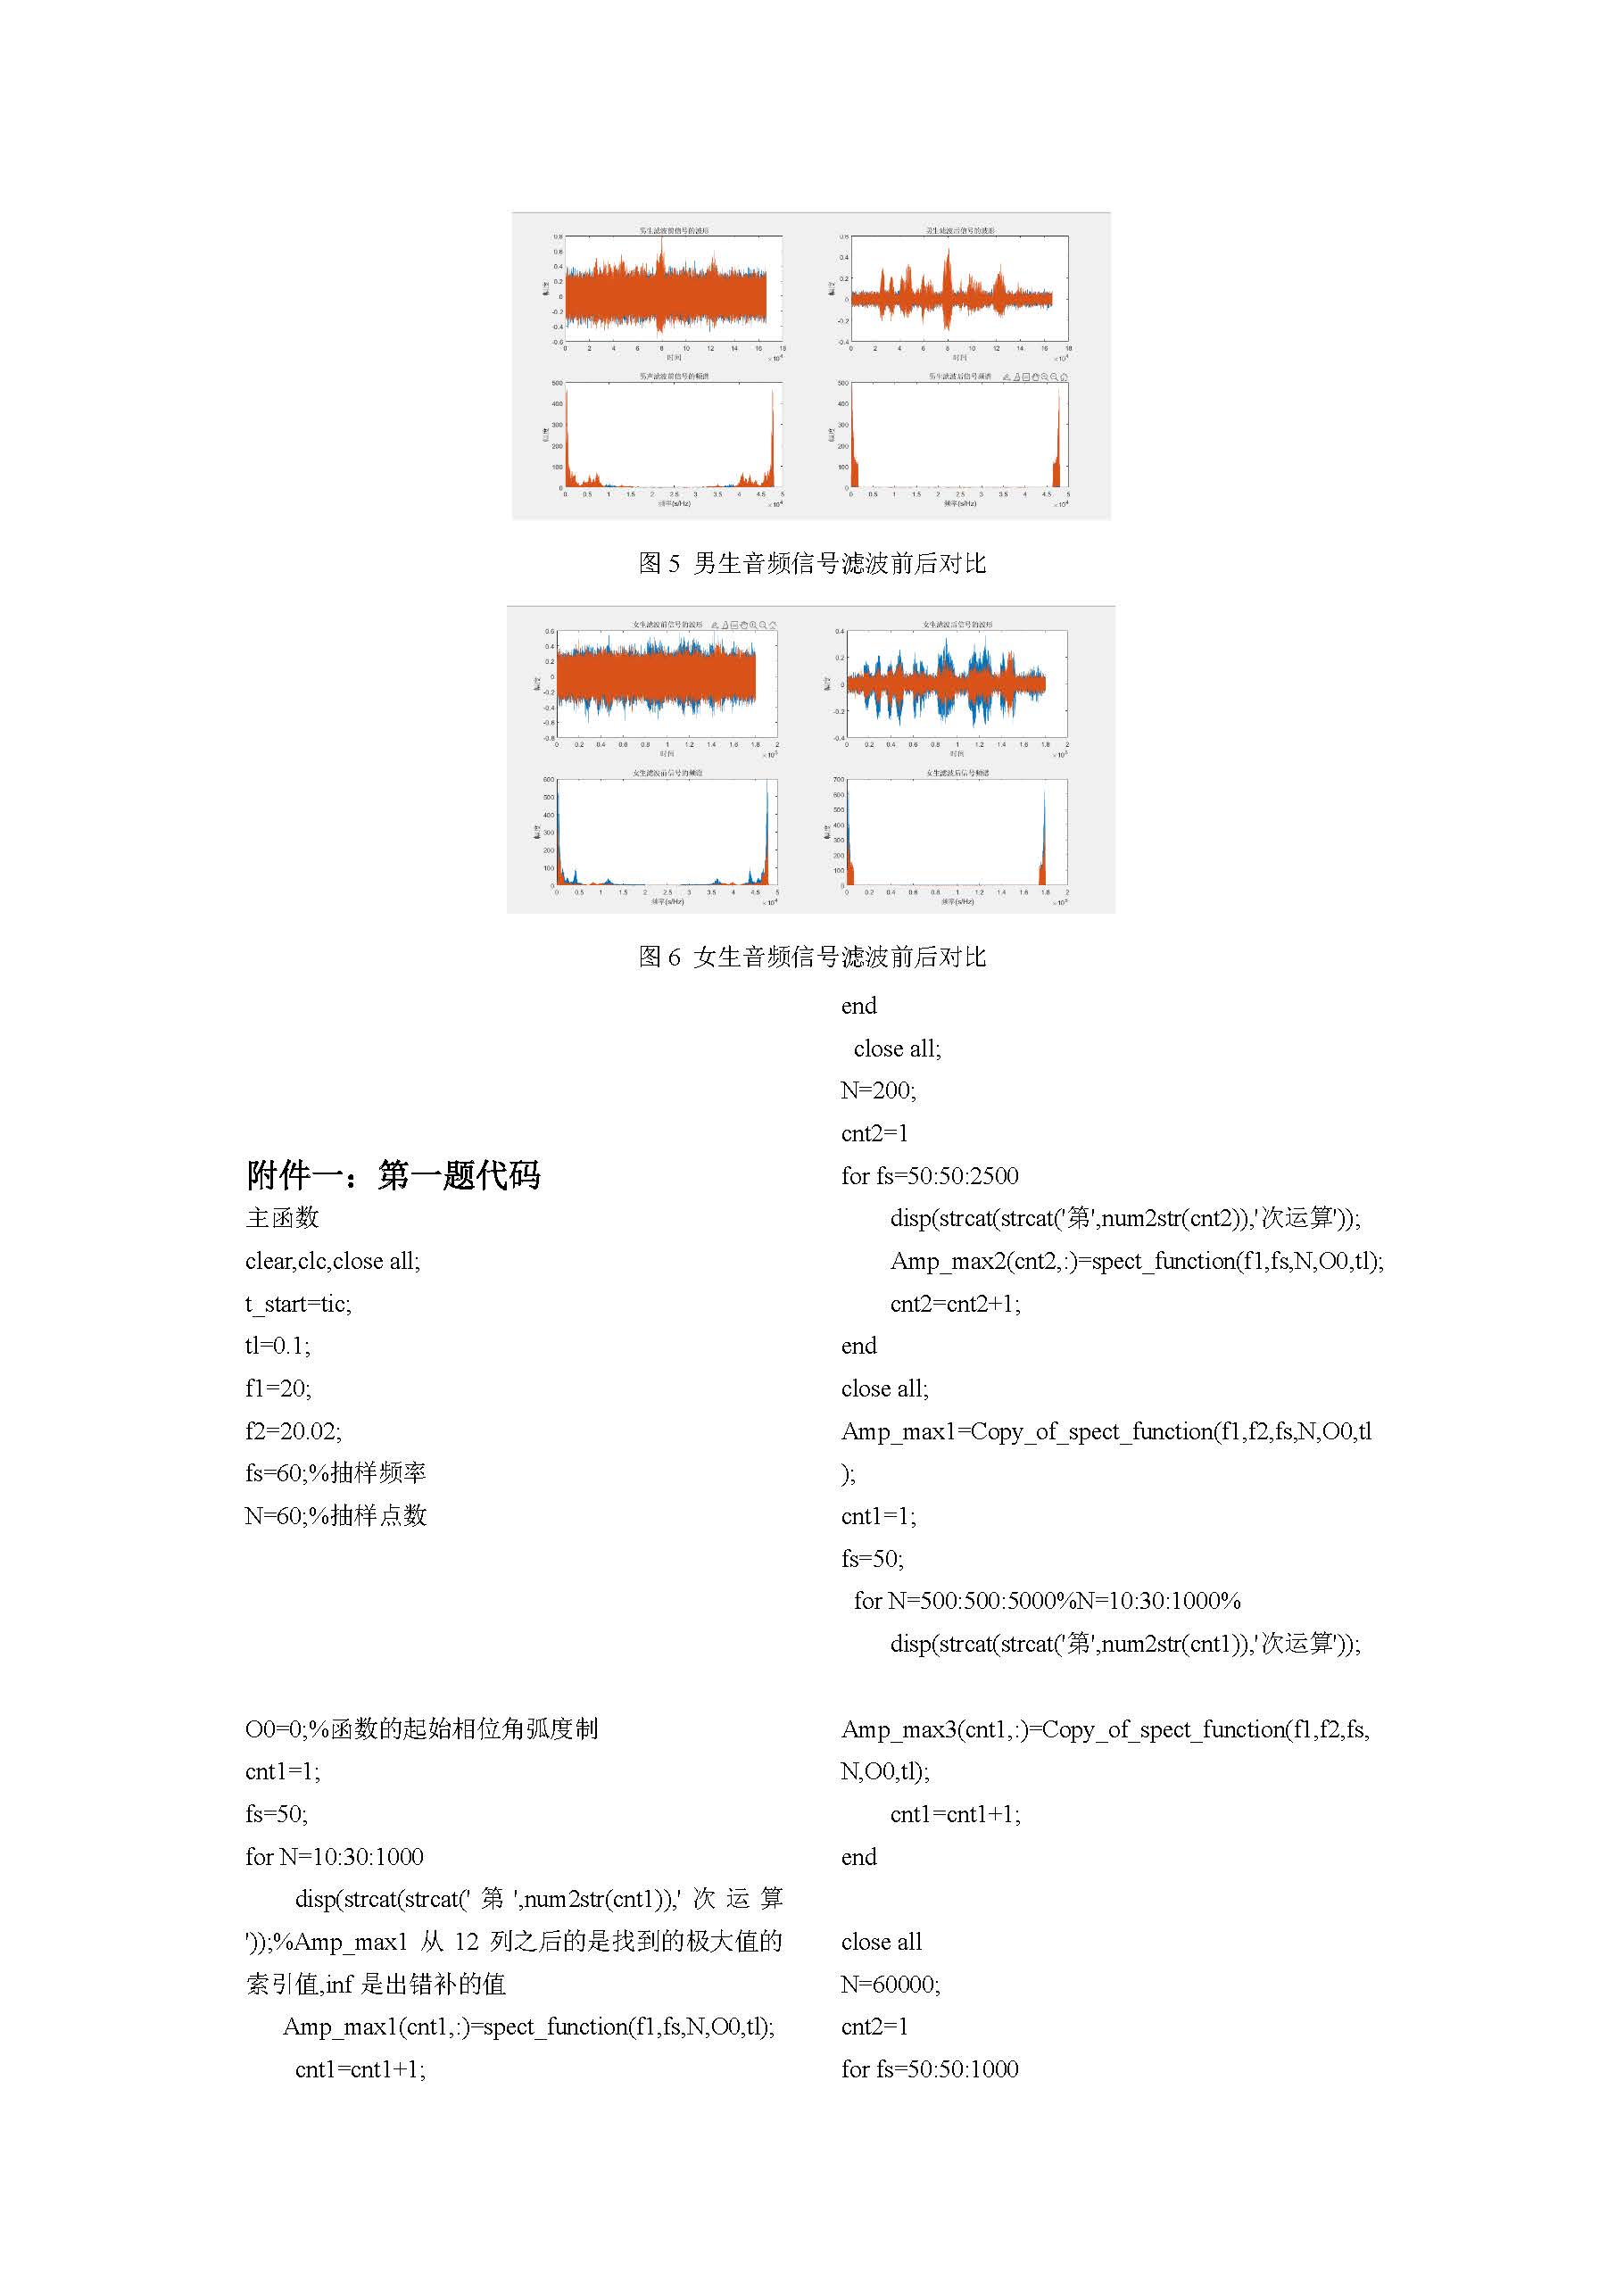
figure(5),subplot(221);plot(x_z);
title('男生滤波前信号的波形');xlabel('时间');ylabel('幅度')
subplot(222);plot(x1);
title('男生滤波后信号的波形');xlabel('时间');ylabel('幅度')
subplot(223);plot(k1,abs(x_f));
title('男声滤波前信号的频谱');xlabel('频率(s/Hz)');ylabel('幅度');
subplot(224);plot(k2,abs(X1));
title('男生滤波后信号频谱');xlabel('频率(s/Hz)');ylabel('幅度');
%对加噪声的女生录音滤波处理
y1=fftfilt(b,y_z);
Y1=fft(y1,n2);
figure(6);
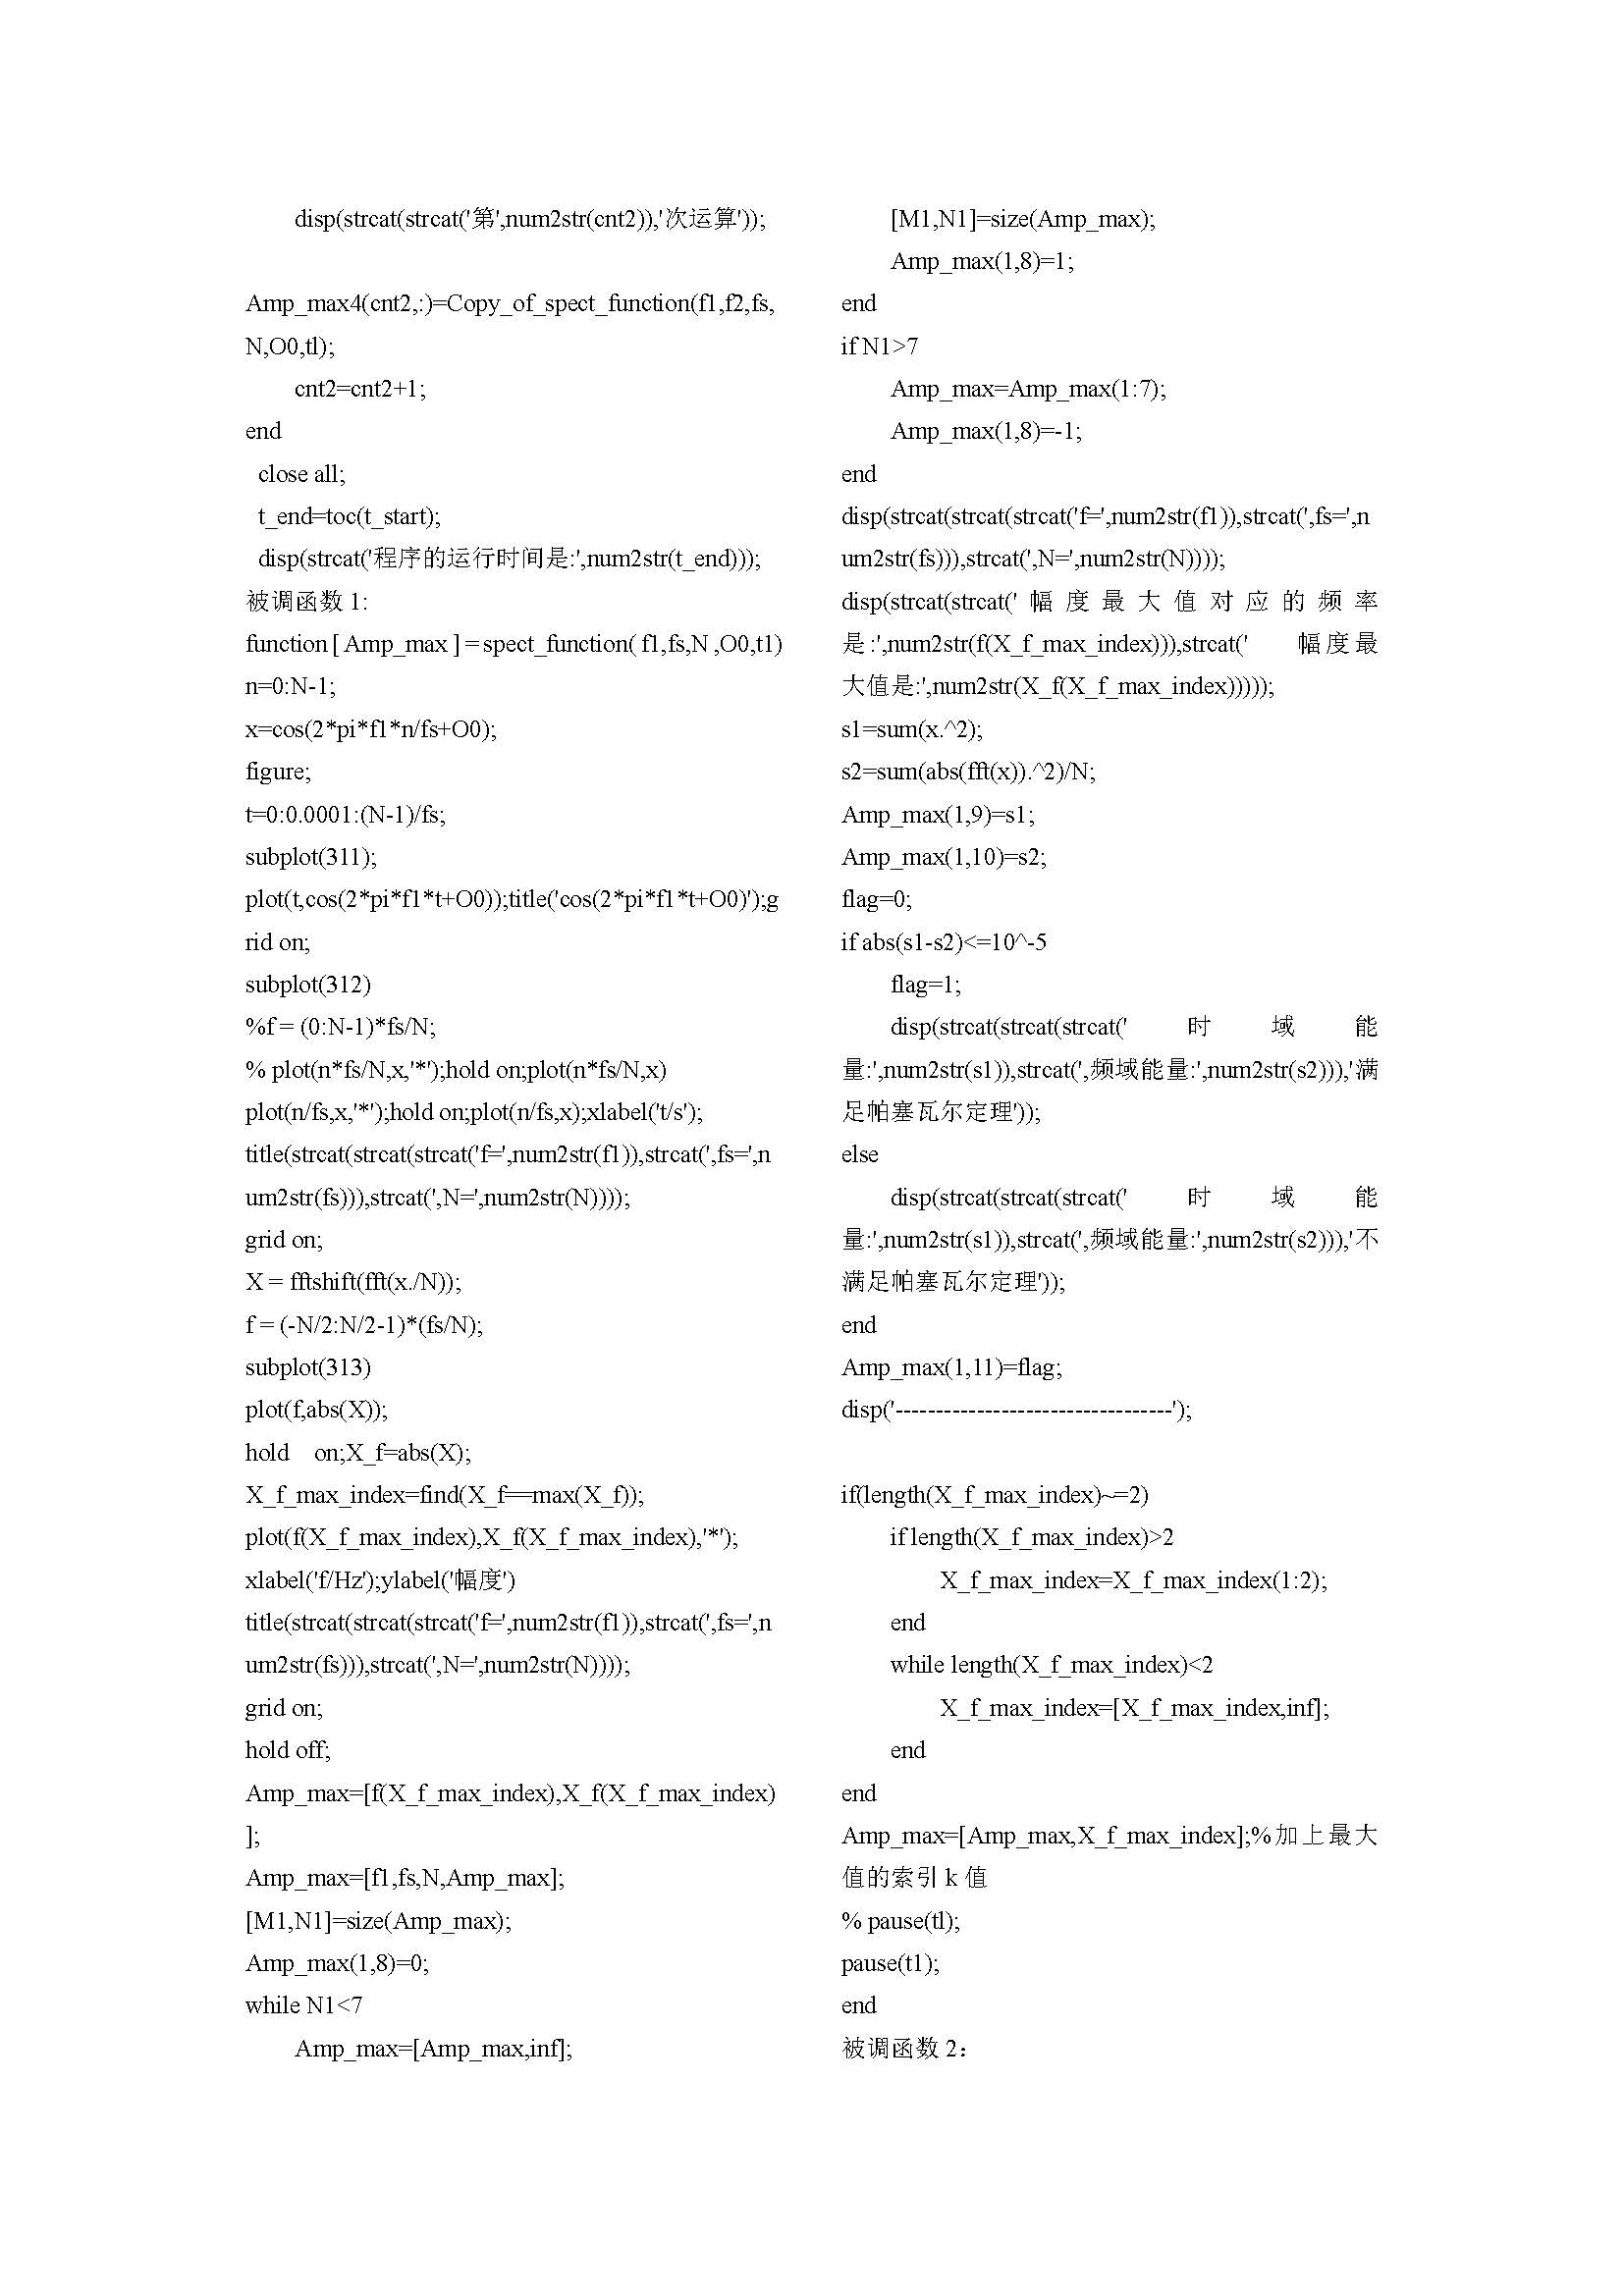
subplot(221);plot(y_z);
title('女生滤波前信号的波形');xlabel('时间');ylabel('幅度')
subplot(222);plot(y1);
title('女生滤波后信号的波形');xlabel('时间');ylabel('幅度')
subplot(223);plot(k2,abs(y_f));
title('女生滤波前信号的频谱');xlabel('频率(s/Hz)');ylabel('幅度');
subplot(224);plot(abs(Y1));
title('女生滤波后信号频谱');xlabel('频率(s/Hz)');ylabel('幅度');
% sound(y1,ys) %回放滤波后的音频
原始文件:


 1268
1268

 被折叠的 条评论
为什么被折叠?
被折叠的 条评论
为什么被折叠?
 到【灌水乐园】发言


