


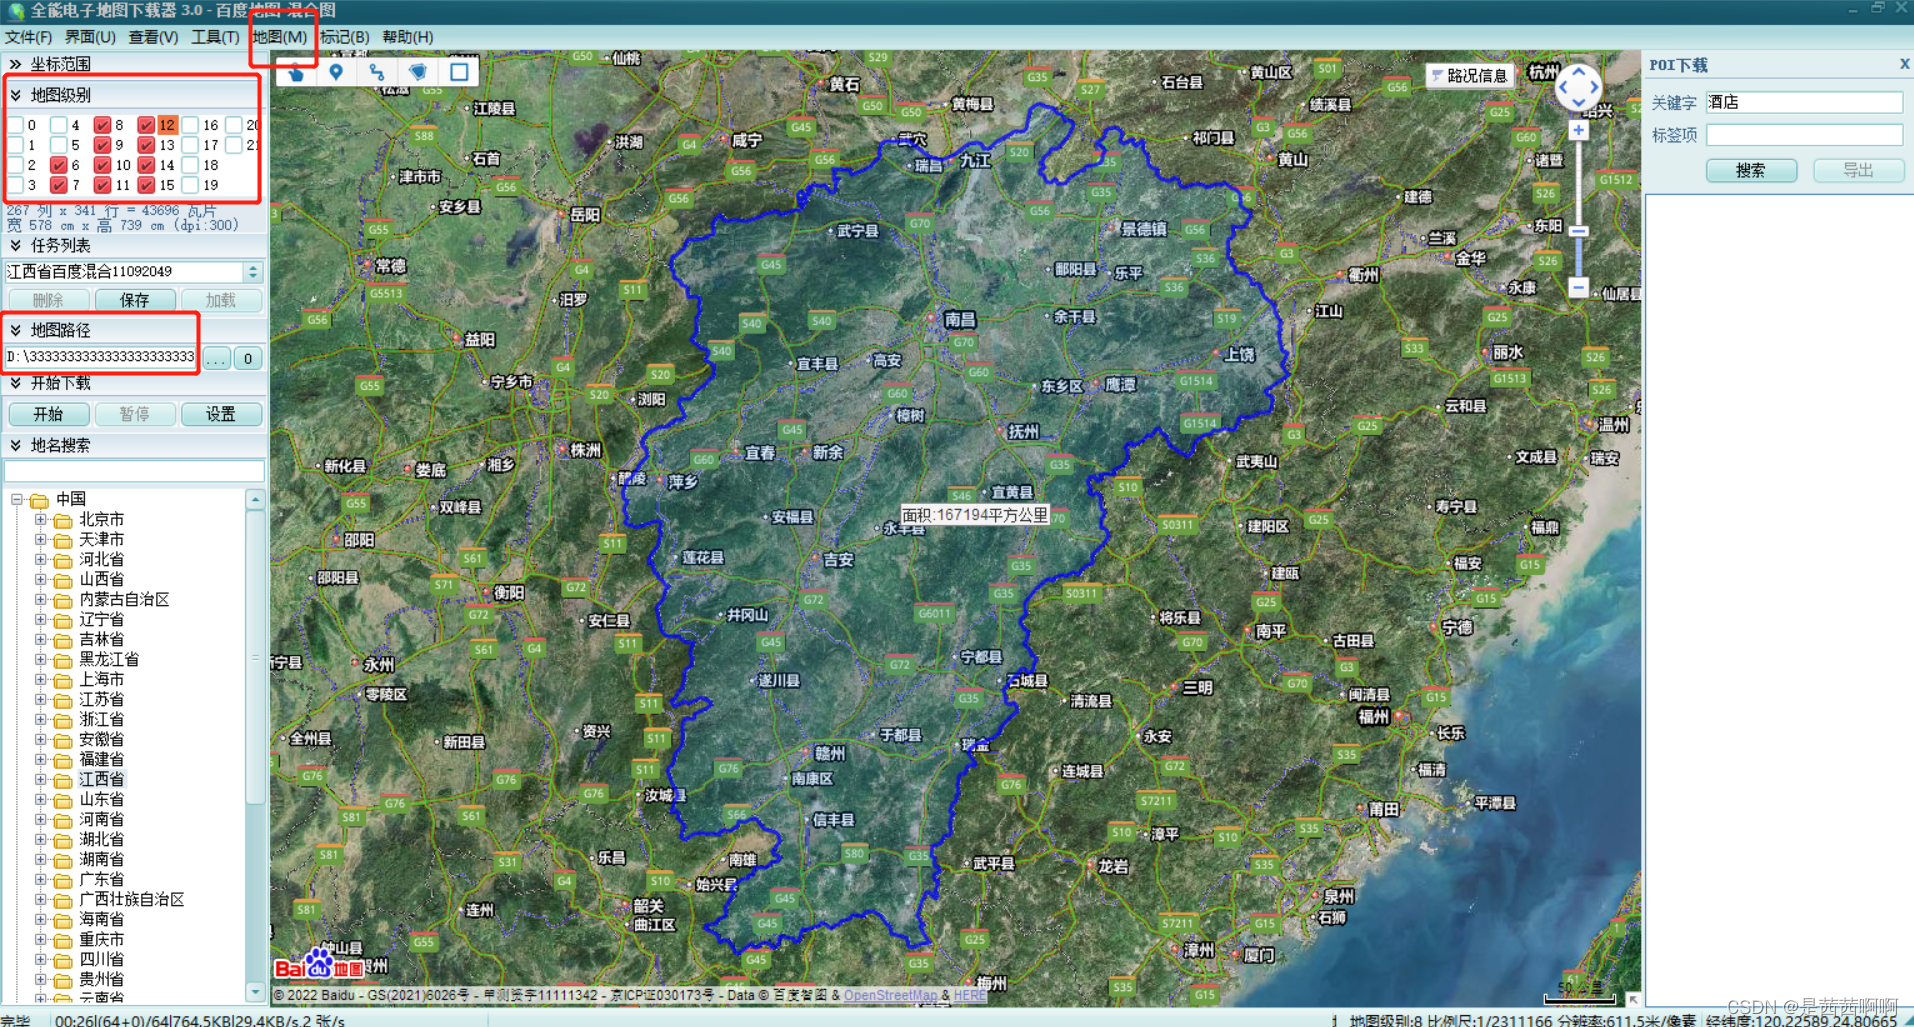
实现效果:

思路:把离线地图瓦片全部下载下来 然后自己在内网起个提供瓦片图请求的服务 从服务器加载,(或者前端静态资源)。
实现步骤:
1.下载全能电子地图下载器。下载地图瓦片。
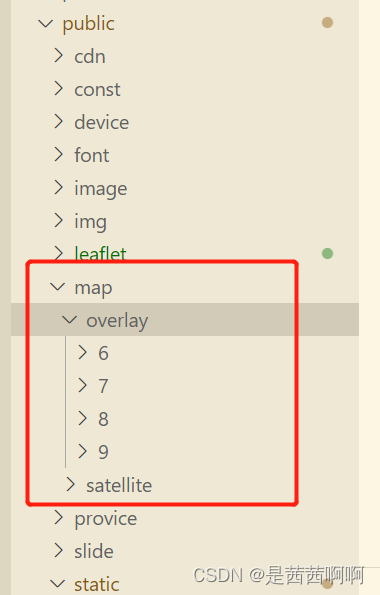
2.把下载的图层放到public文件夹下,瓦片过多时候,也可以部署到nginx代理上。
3.安装地图相关的插件
"leaflet": "^1.9.2",
"ol": "^7.1.0",
"proj4": "^2.8.0",
"proj4leaflet": "^1.0.2",
"vue2-leaflet": "^2.7.1"
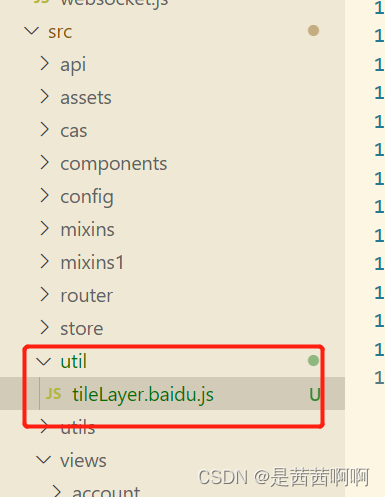
4.tileLayer.baidu.js 待项目中引用.放到指定路径下。
require('proj4')
require('proj4leaflet')
const L = require('leaflet')
// 本地百度地图离线瓦片地图   项目需要叠加底图,所以要两个。不需要叠加的,一个就好
const titleO = '/map/overlay/{z}/{x}/{y}.png'
const titleS = '/map/satellite/{z}/{x}/{y}.jpg'

var urlPath = titleO
var urlPathS = titleS
//请引入 proj4.js 和 proj4leaflet.js
L.CRS.Baidu = new L.Proj.CRS(
  'EPSG:900913',
  '+proj=merc +a=6378206 +b=6356584.314245179 +lat_ts=0.0 +lon_0=0.0 +x_0=0 +y_0=0 +k=1.0 +units=m +nadgrids=@null +wktext  +no_defs',
  {
    resolutions: (function () {
      const level = 19
      var res = []
      res[0] = Math.pow(2, 18)
      for (var i = 1; i < level; i++) {
        res[i] = Math.pow(2, 18 - i)
      }
      return res
    })(),
    origin: [0, 0],
    bounds: L.bounds([20037508.342789244, 0], [0, 20037508.342789244]),
  }
)

L.tileLayer.baidu = function (option) {
  option = option || {}

  var layer
  var subdomains = '0123456789'
  switch (option.layer) {
    //底图
    case 'vec':
    default:
      layer = L.tileLayer(urlPath, {
        name: option.name,
        subdomains: subdomains,
        tms: true,
        zIndex:400
      })

      break
          //卫星图
    case 'vecs':
        layer = L.tileLayer(urlPathS, {
          name: option.name,
          subdomains: subdomains,
          tms: true,
          zIndex:200
        })

        break
    case 'img_d':
      layer = L.tileLayer(
        'http://shangetu{s}.map.bdimg.com/it/u=x={x};y={y};z={z};v=009;type=sate&fm=46',
        {
          name: option.name,
          subdomains: subdomains,
          tms: true,
        }
      )
      break
    case 'img_z':
      layer = L.tileLayer(
        'http://online{s}.map.bdimg.com/tile/?qt=tile&x={x}&y={y}&z={z}&styles=' +
          (option.bigfont ? 'sh' : 'sl') +
          '&v=020',
        {
          name: option.name,
          subdomains: subdomains,
          tms: true,
        }
      )
      break

    case 'custom': //Custom 各种自定义样式
      //可选值:dark,midnight,grayscale,hardedge,light,redalert,googlelite,grassgreen,pink,darkgreen,bluish
      break

    case 'time': //实时路况
      var time = new Date().getTime()
      layer = L.tileLayer(
        'http://its.map.baidu.com:8002/traffic/TrafficTileService?x={x}&y={y}&level={z}&time=' +
          time +
          '&label=web2D&v=017',
        {
          name: option.name,
          subdomains: subdomains,
          tms: true,
        }
      )
      break

    //合并
    case 'img':
      layer = L.layerGroup([
        L.tileLayer.baidu({
          name: '底图',
          layer: 'img_d',
          bigfont: option.bigfont,
        }),
        L.tileLayer.baidu({
          name: '注记',
          layer: 'img_z',
          bigfont: option.bigfont,
        }),
      ])
      break
  }
  return layer
}
5.main.js中引用
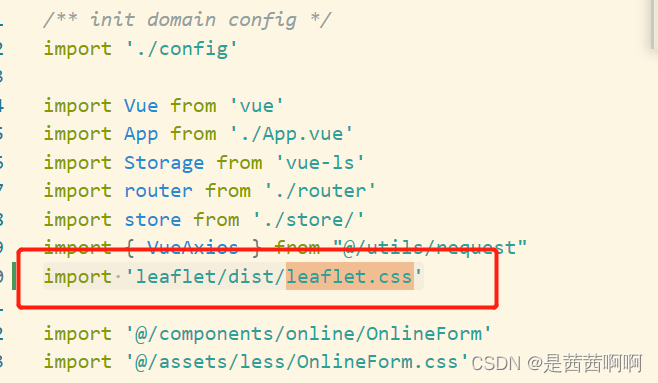
一定要引入,否则底图就有问题。
6.页面使用
<template>
<section>
<div id="leafletMap" class="home" :style="{height: '90vh',width: '100vw' ,background:'#000'}"></div>
</section>
</template>
<script>
import L from 'leaflet'
require('../../../util/tileLayer.baidu.js')
export default {
props: {},
data() {
return {
map: {},
mark1: [{
point: [22.50, 111.31],
data: [30, 60, 58]
},
{
point: [23.35, 111.42],
data: [80, 40, 48]
},
{
point: [24.35, 111.42],
data: [30, 20, 48]
}
],
}
},
mounted() {
this.initMap()
}
methods: {
initMap() {
let that = this
let map = L.map('leafletMap', {
minZoom: 5,
maxZoom: 14,
// center: [37.54, 100.23],
center: [22.50, 111.31],
zoom: 8,
zoomControl: false,
attributionControl: false,
crs: L.CRS.Baidu,
contextmenu: true,
contextmenuWidth: 140, //右键菜单功能
contextmenuItems: [{
text: '设置为起点',
callback: that.setStartPoint,
},
{
text: '设置为中间点',
callback: this.setWaypoints,
},
{
text: '设置为终点',
callback: that.setStopPoint,
},
'-',
{
text: '开始规划',
callback: that.calcRoute,
},
],
})
L.tileLayer.baidu({ //图层1
layer: 'vec'
}).addTo(map)
L.tileLayer.baidu({ //图层2
layer: 'vecs'
}).addTo(map)
that.map = map
that.initWork(that.mark1)
},
initWork(mark) {
let that = this;
if (mark.length != 0) {
for (var a = L.featureGroup().addTo(that.map), t = 0; t < mark.length;t++) {
var n = mark[t].point;
var divIcon;
divIcon = L.divIcon({
iconSize: [0, 0],
popupAnchor: [0, -5],
html: '<div style="width:100px;height:120px;" id="mark' + (t + 1) + '"></div>'
});
var o = L.marker(n, {
icon: divIcon
});
a.addLayer(o);
}
this.setEcharts(mark)
}
},
setEcharts(data) {
if (data && data.length > 0) {
for (let i = 0; i < data.length; i++) {
const dataList = data[i].data
var option = {
// backgroundColor: 'rgb(255, 255, 255)',
color: ['#54CDE9'],
tooltip: {
show: false
},
grid: {
left: '8%',
right: '2%',
top: '10%',
bottom: '20%'
},
xAxis: [{
type: 'category',
data: ['type1', 'type2', 'type3'],
axisTick: {
alignWithLabel: true
},
axisLabel: {
color: '#fff',
interval: 0,
margin: 10,
align: 'center'
}
}],
yAxis: {
show: false,
type: 'value',
min: 0,
max: 100,
},
series: [{
name: '',
type: 'pictorialBar',
symbolSize: [15, 5],
symbolOffset: [0, -2],
symbolPosition: 'end',
z: 12,
label: {
normal: {
show: true,
position: 'top',
color: '#FFDE00',
fontWeight: 'bold'
// "formatter": "{c}%"
}
},
itemStyle: {
normal: {
color: (params) => {
let colors = [new echarts.graphic.LinearGradient(0, 0, 0, 1, [{
offset: 0,
color: 'rgba(254, 174, 162, 1)',
},
{
offset: 1,
color: 'rgba(253, 114, 112, 1)',
},
]), new echarts.graphic.LinearGradient(0, 0, 0, 1, [{
offset: 0,
color: 'rgba(123, 200, 255, 1)',
},
{
offset: 1,
color: 'rgba(53, 157, 245, 1)',
},
]), new echarts.graphic.LinearGradient(0, 0, 0, 1, [{
offset: 0,
color: 'rgba(251, 169, 128, 1)',
},
{
offset: 1,
color: 'rgba(247, 203, 107, 1)',
},
])]
return colors[params.dataIndex]
},
barBorderRadius: [15, 15, 0, 0] //圆角大小
},
},
data: dataList
},
{
type: 'pictorialBar',
symbolSize: [15, 5],
symbolOffset: [0, 2],
z: 12,
itemStyle: {
normal: {
color: (params) => {
let colors = [new echarts.graphic.LinearGradient(0, 0, 0, 1, [{
offset: 0,
color: 'rgba(254, 174, 162, 1)',
},
{
offset: 1,
color: 'rgba(253, 114, 112, 1)',
},
]), new echarts.graphic.LinearGradient(0, 0, 0, 1, [{
offset: 0,
color: 'rgba(123, 200, 255, 1)',
},
{
offset: 1,
color: 'rgba(53, 157, 245, 1)',
},
]), new echarts.graphic.LinearGradient(0, 0, 0, 1, [{
offset: 0,
color: 'rgba(251, 169, 128, 1)',
},
{
offset: 1,
color: 'rgba(247, 203, 107, 1)',
},
])]
return colors[params.dataIndex]
},
},
},
data: dataList
},
{
type: 'bar',
showBackground: false,
backgroundStyle: {
color: 'rgba(216, 229, 247, 0.55)',
borderRadius: [6, 6, 0, 0]
},
itemStyle: {
normal: {
color: (params) => {
let colors = [new echarts.graphic.LinearGradient(0, 0, 0, 1, [{
offset: 0,
color: 'rgba(254, 174, 162, 1)',
},
{
offset: 1,
color: 'rgba(253, 114, 112, 1)',
},
]), new echarts.graphic.LinearGradient(0, 0, 0, 1, [{
offset: 0,
color: 'rgba(123, 200, 255, 1)',
},
{
offset: 1,
color: 'rgba(53, 157, 245, 1)',
},
]), new echarts.graphic.LinearGradient(0, 0, 0, 1, [{
offset: 0,
color: 'rgba(251, 169, 128, 1)',
},
{
offset: 1,
color: 'rgba(247, 203, 107, 1)',
},
])]
return colors[params.dataIndex]
},
},
},
barWidth: '15',
data: dataList
}
]
}
let idName = 'mark' + (i + 1)
echarts.init(document.getElementById(idName)).setOption(option)
}
}
},
clearMarker() {
$(".leaflet-marker-pane").empty()
},
}


 2572
2572

 被折叠的 条评论
为什么被折叠?
被折叠的 条评论
为什么被折叠?
 到【灌水乐园】发言


