


基本上参考 决策树可视化保姆级教程
step1 安装包
pip install graphviz
step2 安装graphviz插件
1 安装插件地址:http://www.graphviz.org,下载对应的插件
2 bin 文件放到 D:\software\Anaconda3\Lib\site-packages\graphviz 目录下
3 配置环境
添加下面两项到系统环境:
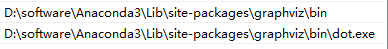
安装之前

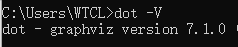
安装完成之后(记得新开一个命令行窗口):
step3 重启 jupyter notebook
import sklearn.datasets as datasets
from sklearn.tree import DecisionTreeClassifier
from sklearn import tree
from matplotlib import pyplot as plt
import pandas as pd

iris = datasets.load_iris()

X_df = pd.DataFrame(iris.data, columns = iris.feature_names)
print(X_df.head(15))

Y=iris.target
print("\nClass Labels for all the data points:\n", Y)


# 数据拟合
dtree = DecisionTreeClassifier()   # (random_state=1234)
model=dtree.fit(X_df,Y)

text_representation = tree.export_text(dtree)
print(text_representation)


# 结果保存
with open("iris_DecisionTree_text.txt", "w") as fout:
    fout.write(text_representation)

# 作图可视化
import graphviz
# DOT format data
dot_data = tree.export_graphviz(dtree, out_file=None,
                                feature_names=iris.feature_names,
                                class_names=iris.target_names,
                                filled=True)
# Draw Decision Tree
graph = graphviz.Source(dot_data, format="png")  # change "png" to "pdf" for PDF format
graph
# 保存数据
graph.render("iris_DecisionTree_graphivz2")


 694
694


 被折叠的 条评论
为什么被折叠?
被折叠的 条评论
为什么被折叠?
 到【灌水乐园】发言


