


 超级会员免费看
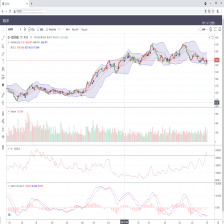
第五天:5天免费搭建个人量化平台 - 自定义功能和指标
1. 修改图形及各式设置
设置默认:https://aitrade.ga/books/tradingview/book/Drawings-Overrides.html
e.g.
linetoolhorzline: {
linecolor: ‘rgba( 128, 204, 219, 1)’,
linewidth: 1.0,
linestyle: LINESTYLE_SOLID,
showPrice: true,
showLabel: false,
text: ‘’,
font: ‘Verdana’,
textcolor: ‘rgba( 21, 119, 96, 1)’,
fontsize: 12,
bold:false,
italic:false,
horzLabelsAlign: ‘center’,
vertLabelsAlign: ‘top’
},
颜色设置:https://tool.oschina.net/commons?type=3
其他基本设置:https://aitrade.ga/books/tradingview/book/Overrides.html
形状设置: https://aitrade.ga/books/tradingview/book/Shapes-and-Overrides.html
帮助文档: https://aitrade.ga/books/tradingview/book/Home.html
2. 自定义指标
如果想要在图表上显示一些自定义数据或指标, 例如增加持仓量:
(1) 为数据创建一个新的ticker,并设置您的服务器返回此ticker有效的SymbolInfo。
(2) 设置服务器以返回此ticker的有效历史数据。
(3) 在tv.html 的new TradingView.widget 中加入custom_indicators_getter
def symbol(request):
symbol= request.GET.get("symbol",'').upper()

dict={}

if '_OI' in symbol:


	dict={

			"name":symbol+'_OI',

			"exchange-traded":"",

			"exchange-listed":"",

			"timezone":"Asia/Shanghai",

			"minmov":1,

			"minmov2":0,

			"pointvalue":1,

			"session":"2100-0100,0900-1130,1330-1500",

			"has_intraday":True,

			"has_empty_bars":False,

			"has_no_volume":False,

			"description":"OI",

			"type":"",

			"supported_resolutions":["15","30","60","D","W","M","6M"],

			"pricescale":1,

			"ticker":symbol+'_OI',

			"has_daily":True
在 def history(request) 加入:
if ‘_OI’ in code.upper():
		out['o']=data['openInt'].values.tolist()

		out['h']=data['openInt'].values.tolist()

		out['l']=data['openInt'].values.tolist()

		out['c']=data['openInt'].values.tolist()

		out['v']=data['openInt'].values.tolist()
在tv.html 的new TradingView.widget 中加入:
custom_indicators_getter: function(PineJS) {
			         return Promise.resolve([

		        	 {

					    name: "OI",

					    metainfo: {

					        "_metainfoVersion": 40,

					        "id": "OI@tv-basicstudies-1",

					        "scriptIdPart": "",

					        "name": "OI",

					        "description": "OI",

					        "shortDescription": "OI",

					        'is_hidden_study': true,

				        	'is_price_study': false,

				        	'isCustomIndicator': true,

					        "plots": [{"id": "plot_0", "type": "line"}],

					        "defaults": {

					            "styles": {

					                "plot_0": {

					                    "linestyle": 0,

					                    "visible": true,

					                    "linewidth": 1,

					                    "plottype": 2,

					                    "trackPrice": true,

					                    "transparency": 40,

					                    "color": "#880000"

					                }

					            },

					            "precision": 1,

					            "inputs": {}

					        },

					        "styles": {

					            "plot_0": {

					                "title": "OI value",

					                "histogramBase": 0,

					            }

					        },

					        "inputs": [],

					    },

					    constructor: function() {

					        this.init = function(context, inputCallback) {

					            this._context = context;

					            this._input = inputCallback;

					            var symbol = PineJS.Std.ticker(this._context).split('"')[1]+'_OI';

					            this._context.new_sym(symbol, PineJS.Std.period(this._context), PineJS.Std.period(this._context));

					        };


					        this.main = function(context, inputCallback) {

					            this._context = context;

					            this._input = inputCallback;

					            this._context.select_sym(1);

					            var v = PineJS.Std.close(this._context);

					            return [v];

					        }

					    }

					}


			         ]);

			     },

			});


			widget.onChartReady(function() {

			     widget.chart().createStudy('OI', false, true);

			 });
这样可以随意增加自己感兴趣的自定义数据或指标。
关注公众号"期权量化adog” 、知识星球"adog量化和AI", 下载相关资料/源码和数据。


 被折叠的 条评论
为什么被折叠?
被折叠的 条评论
为什么被折叠?
 到【灌水乐园】发言


