


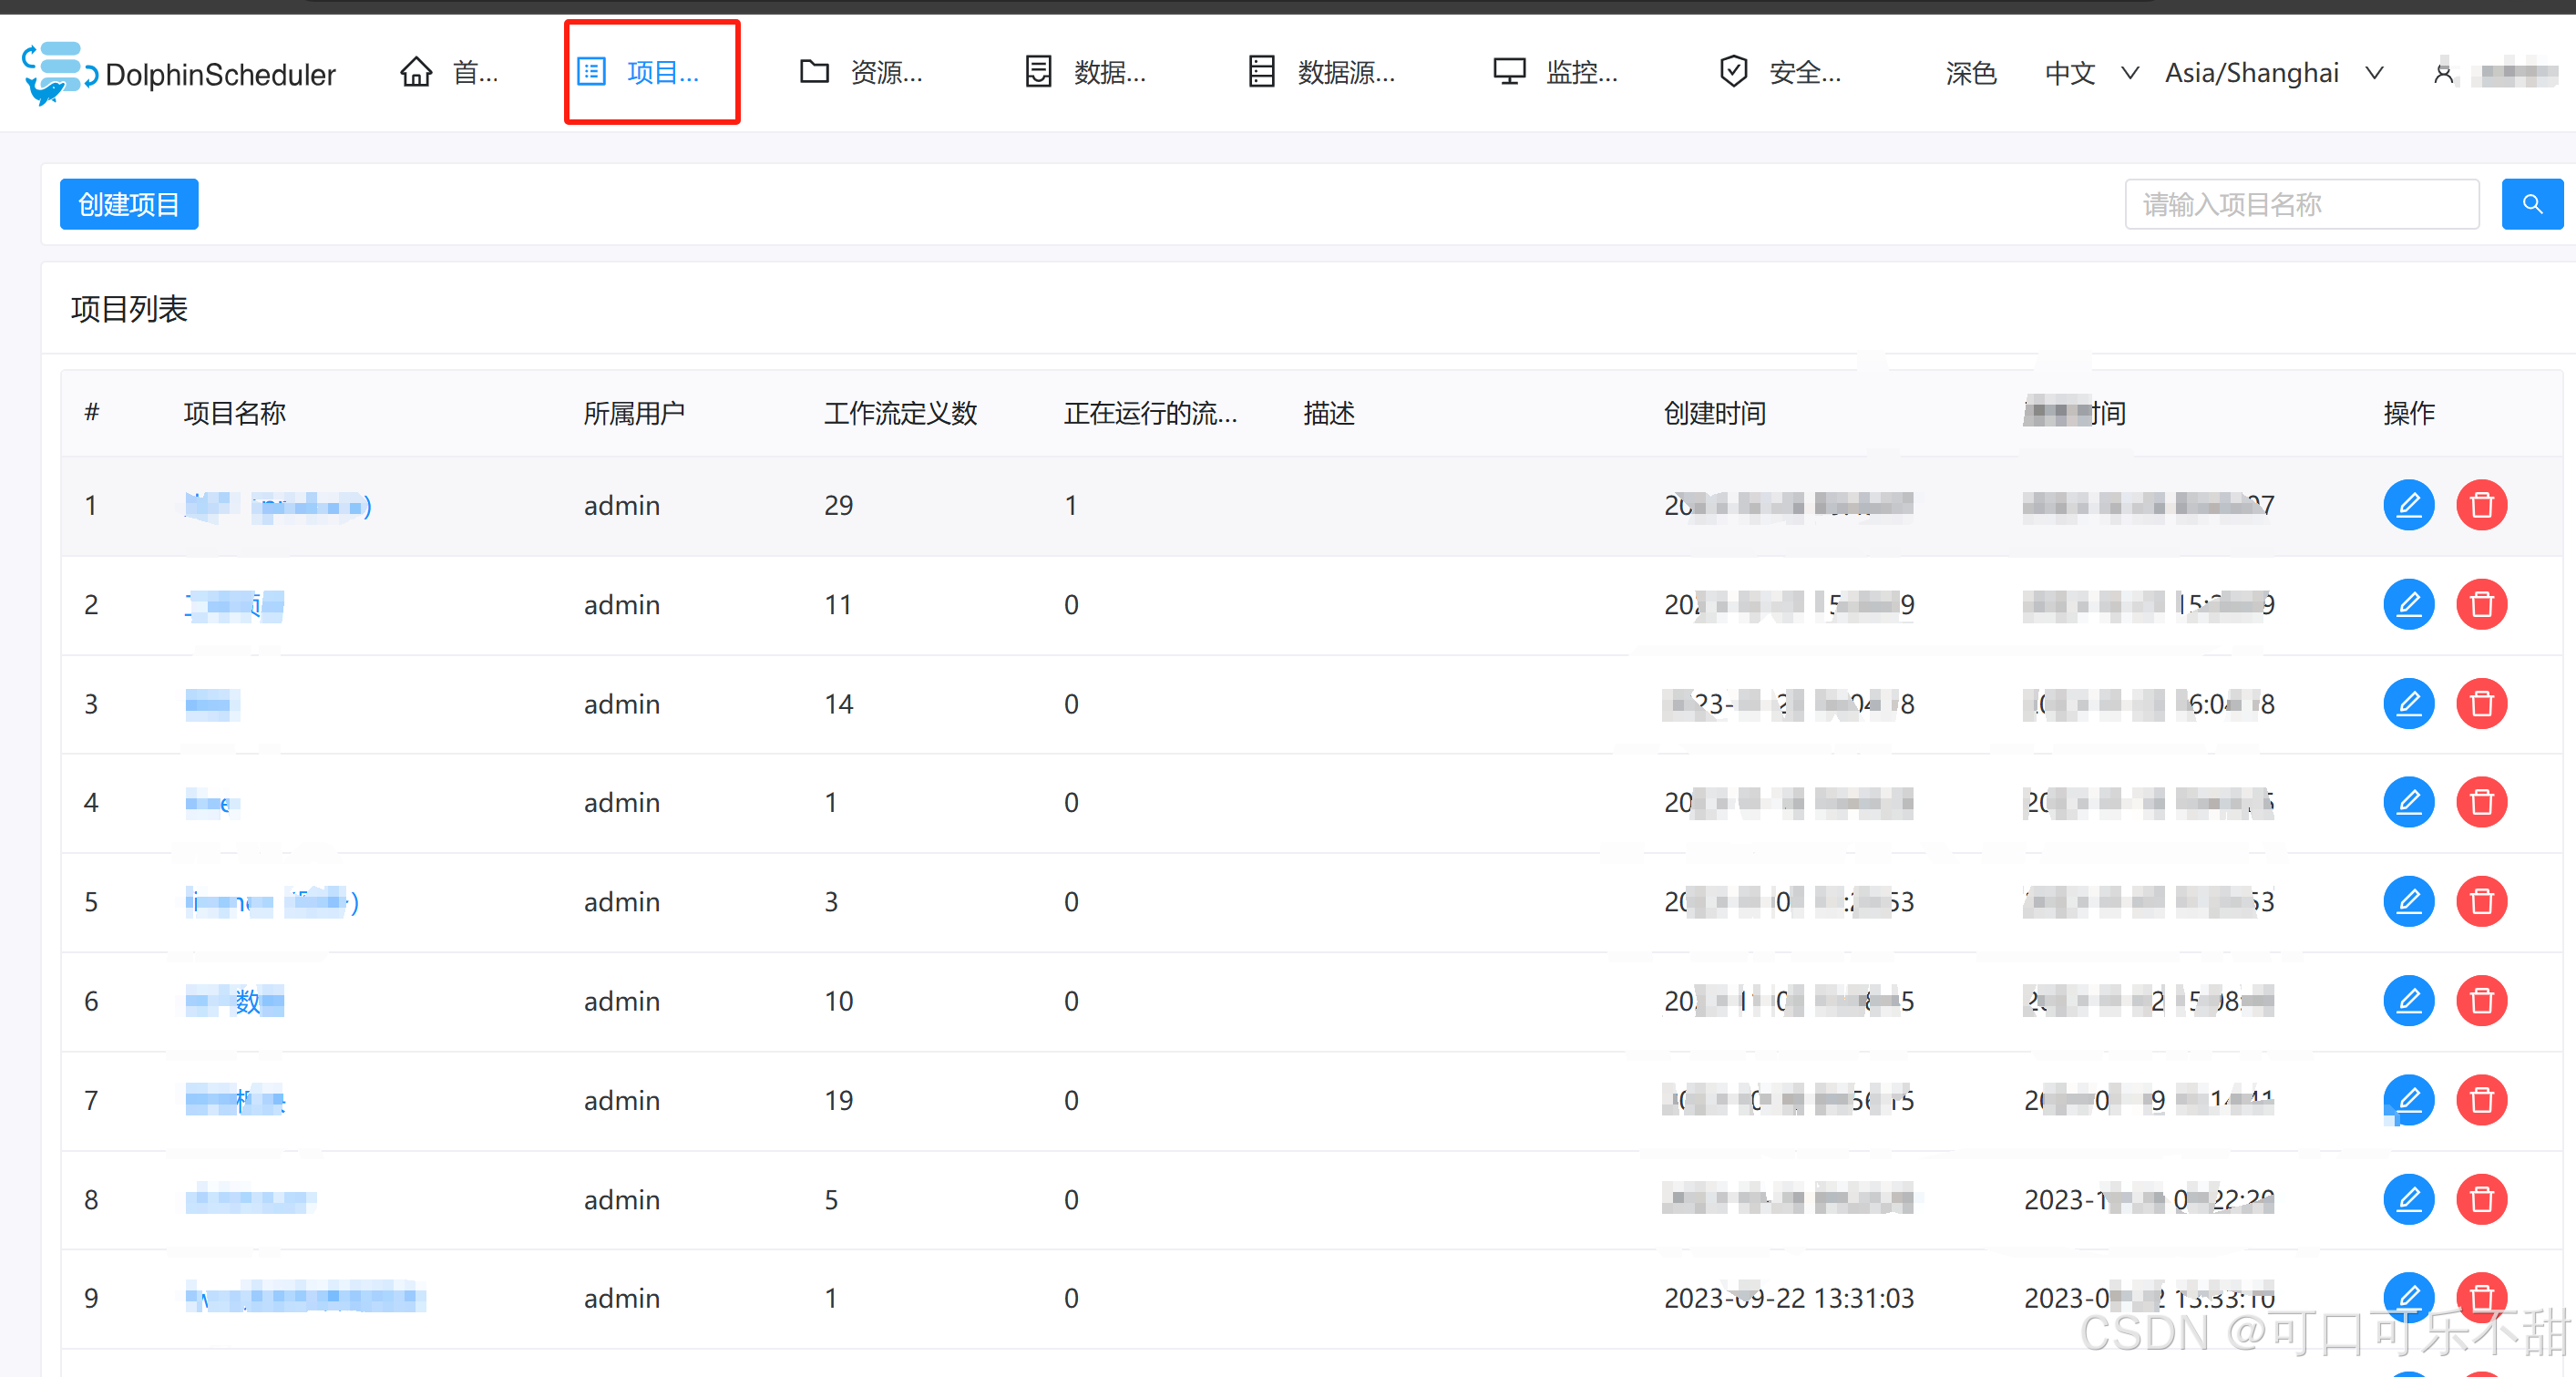
问题现象
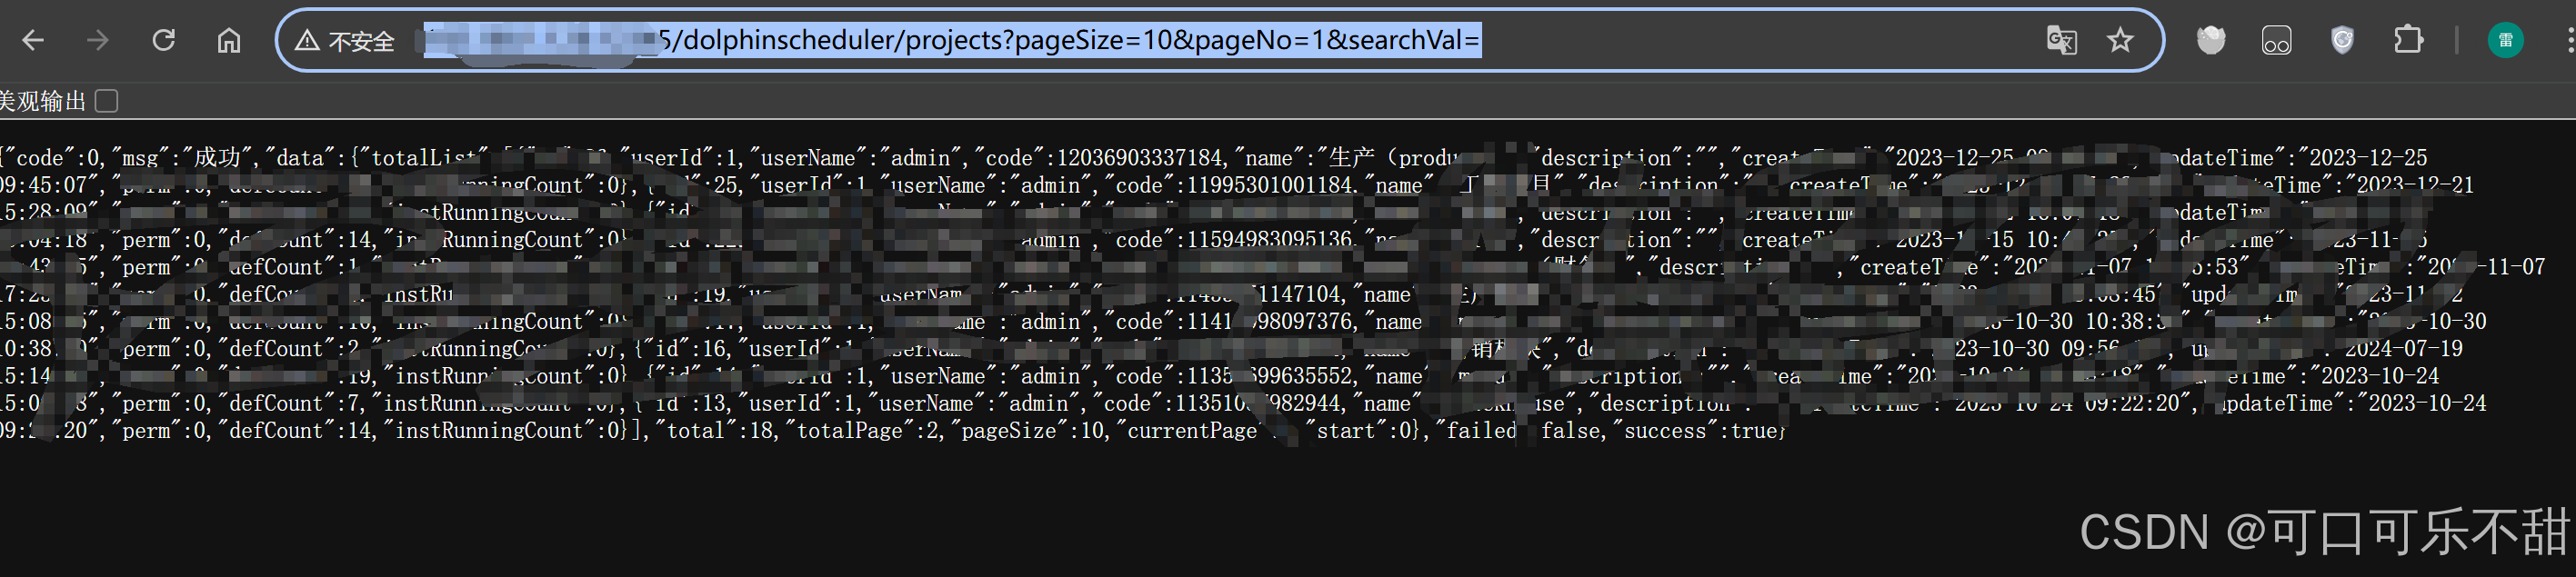
海豚项目管理页面加载不出来,浏览器查看为[http://ip:12345/dolphinscheduler/projects?pageSize=10&pageNo=1&searchVal=]请求超时。
解决思路
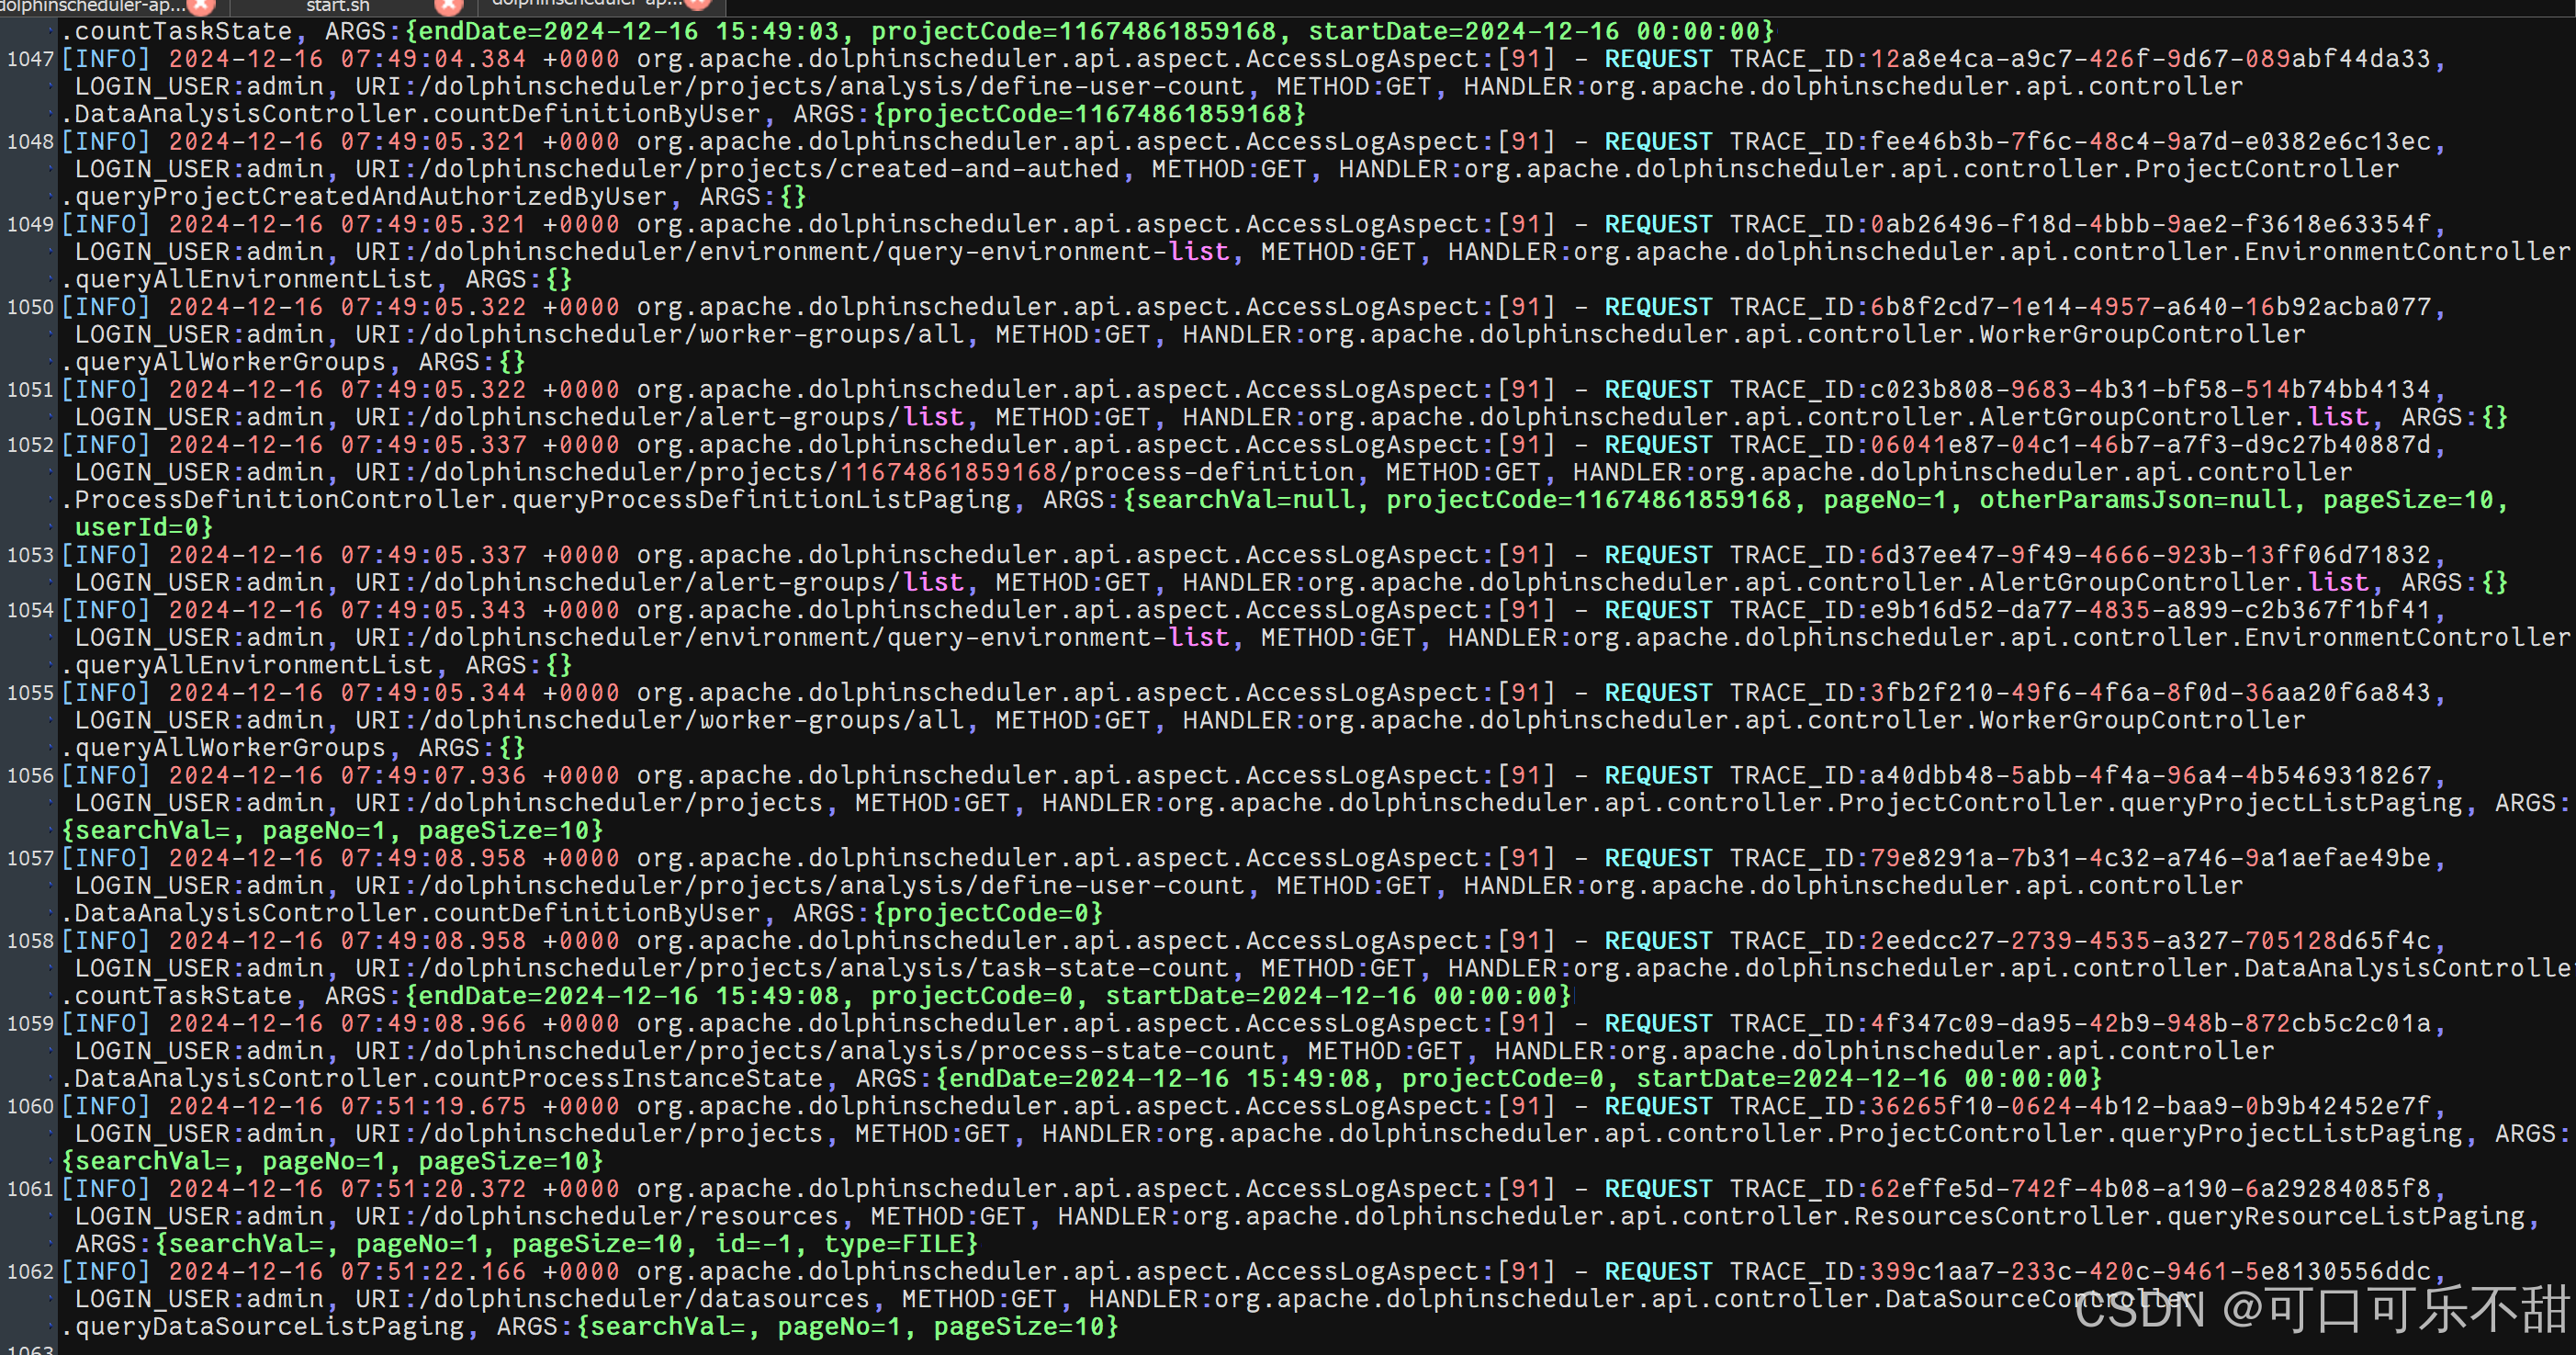
1.查看海豚运行日志(未发现异常)
tail /home/dolphinscheduler/api-server/logs/dolphinscheduler-api.log
2.尝试重启海豚的api-server模块
sh /home/dolphinscheduler/bin/dolphinscheduler-daemon.sh stop api-server
sh /home/dolphinscheduler/bin/dolphinscheduler-daemon.sh start api-server
结果:还是加载不出来
3.尝试请求超时连接发现请求能出数据,但是要十多秒
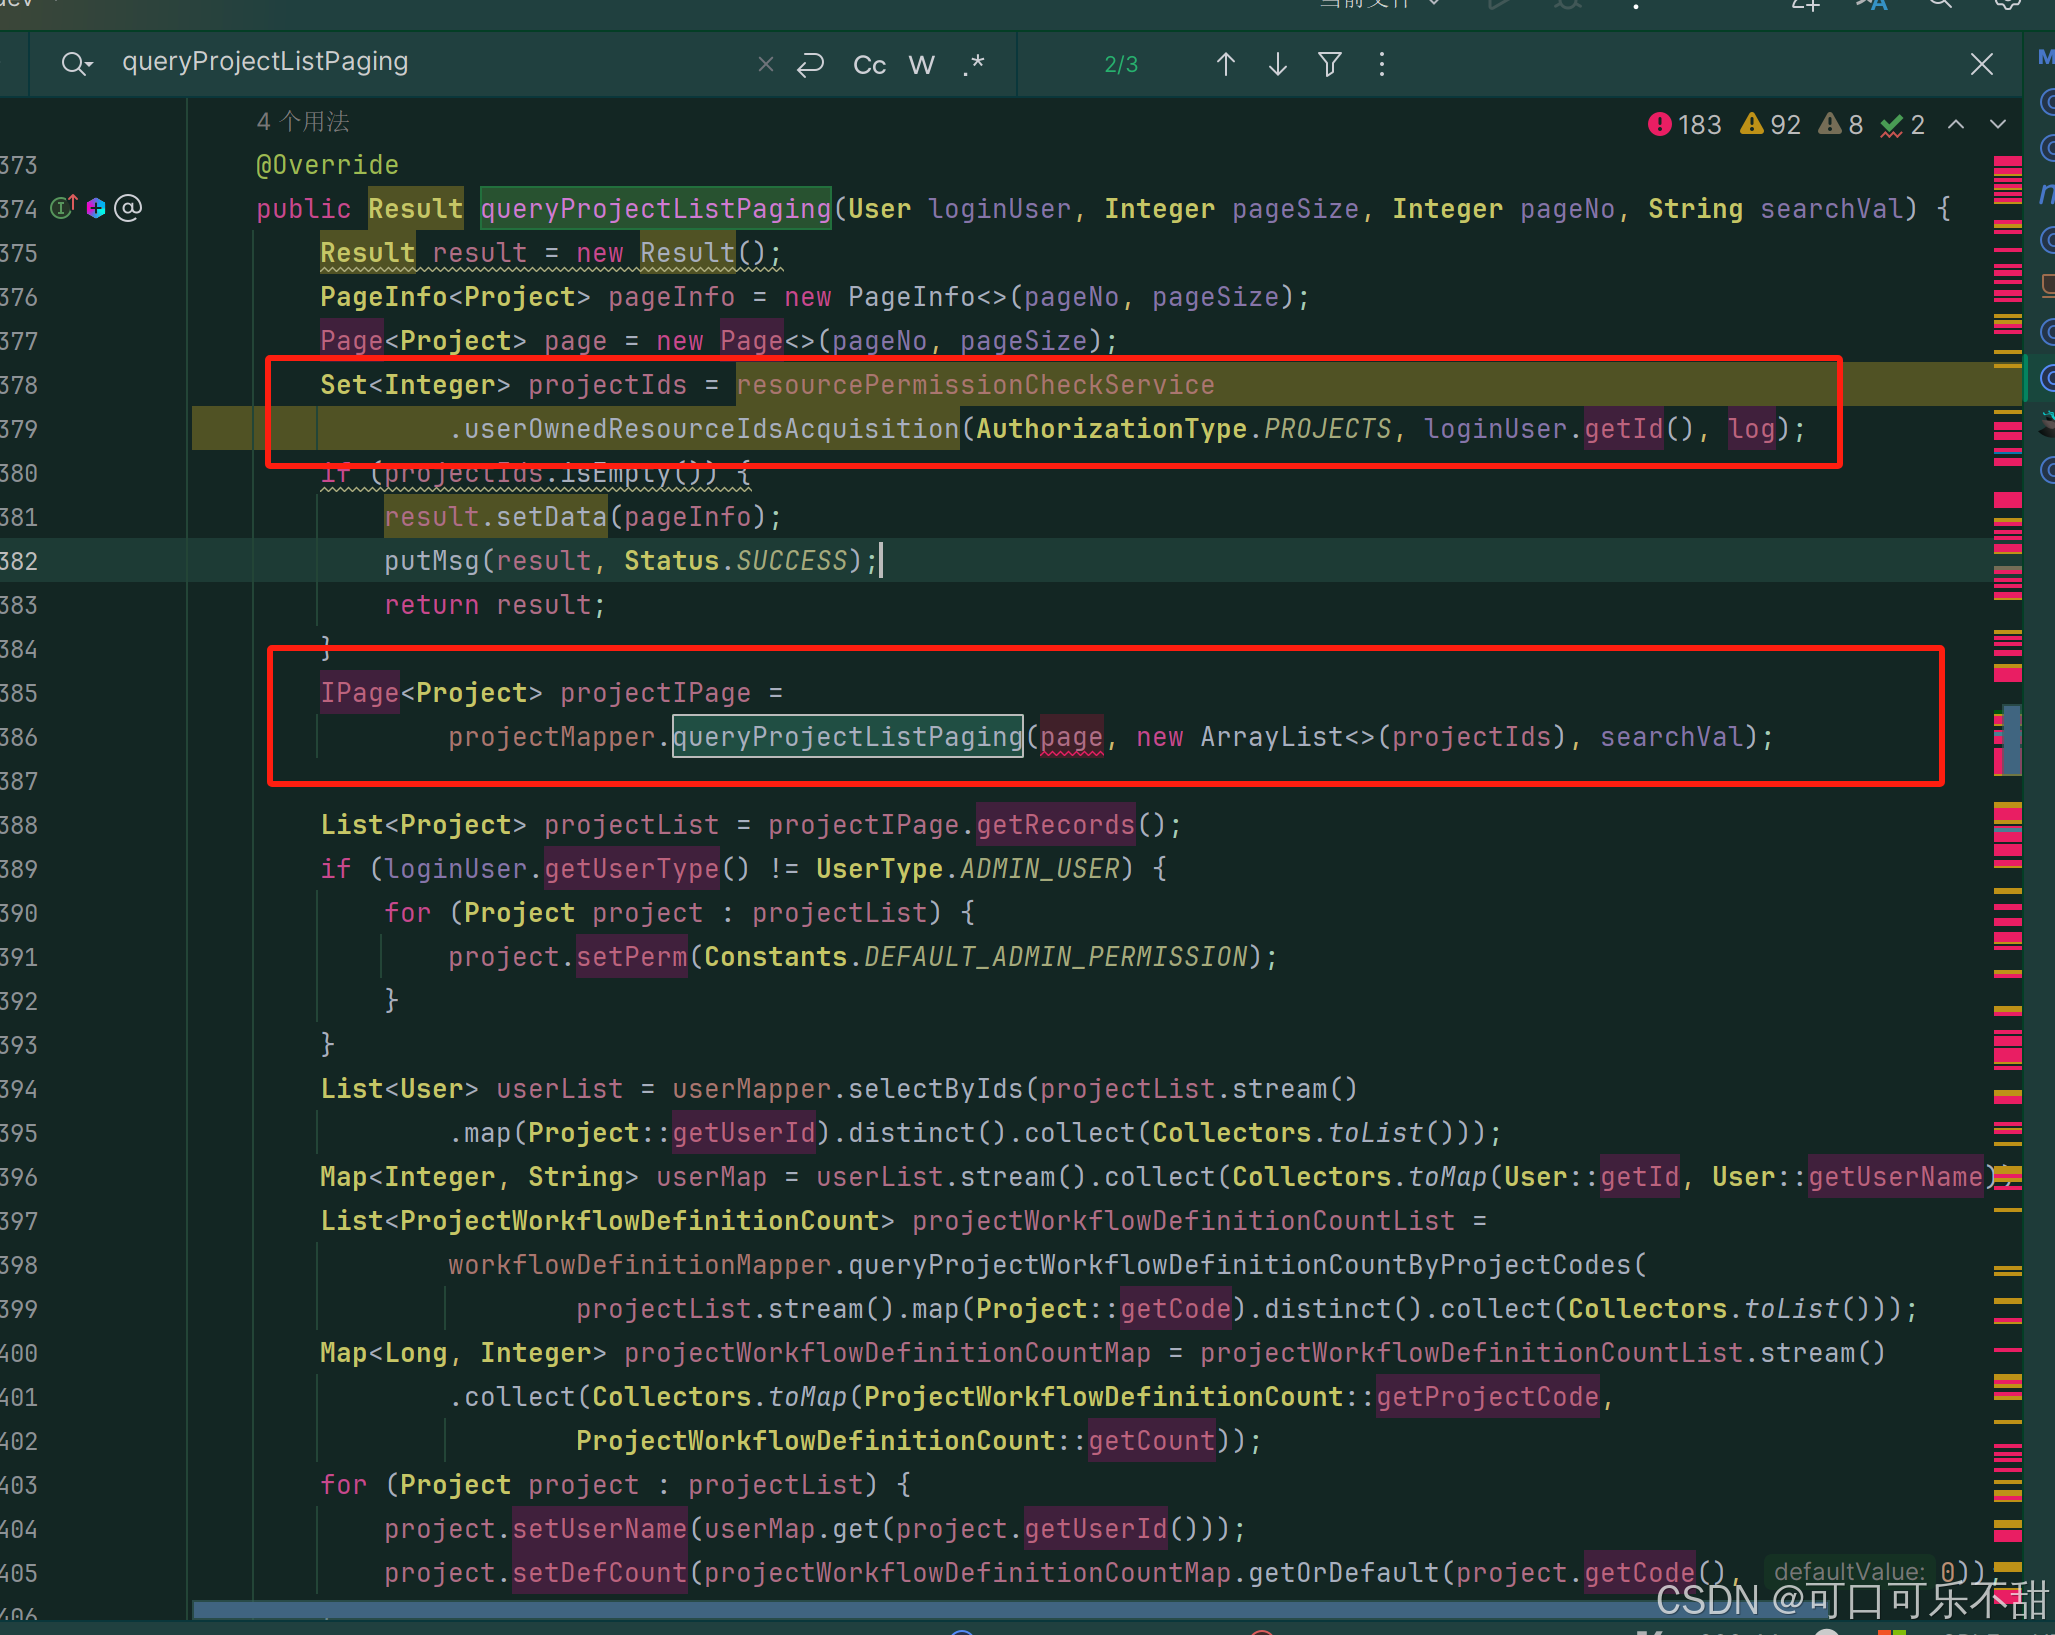
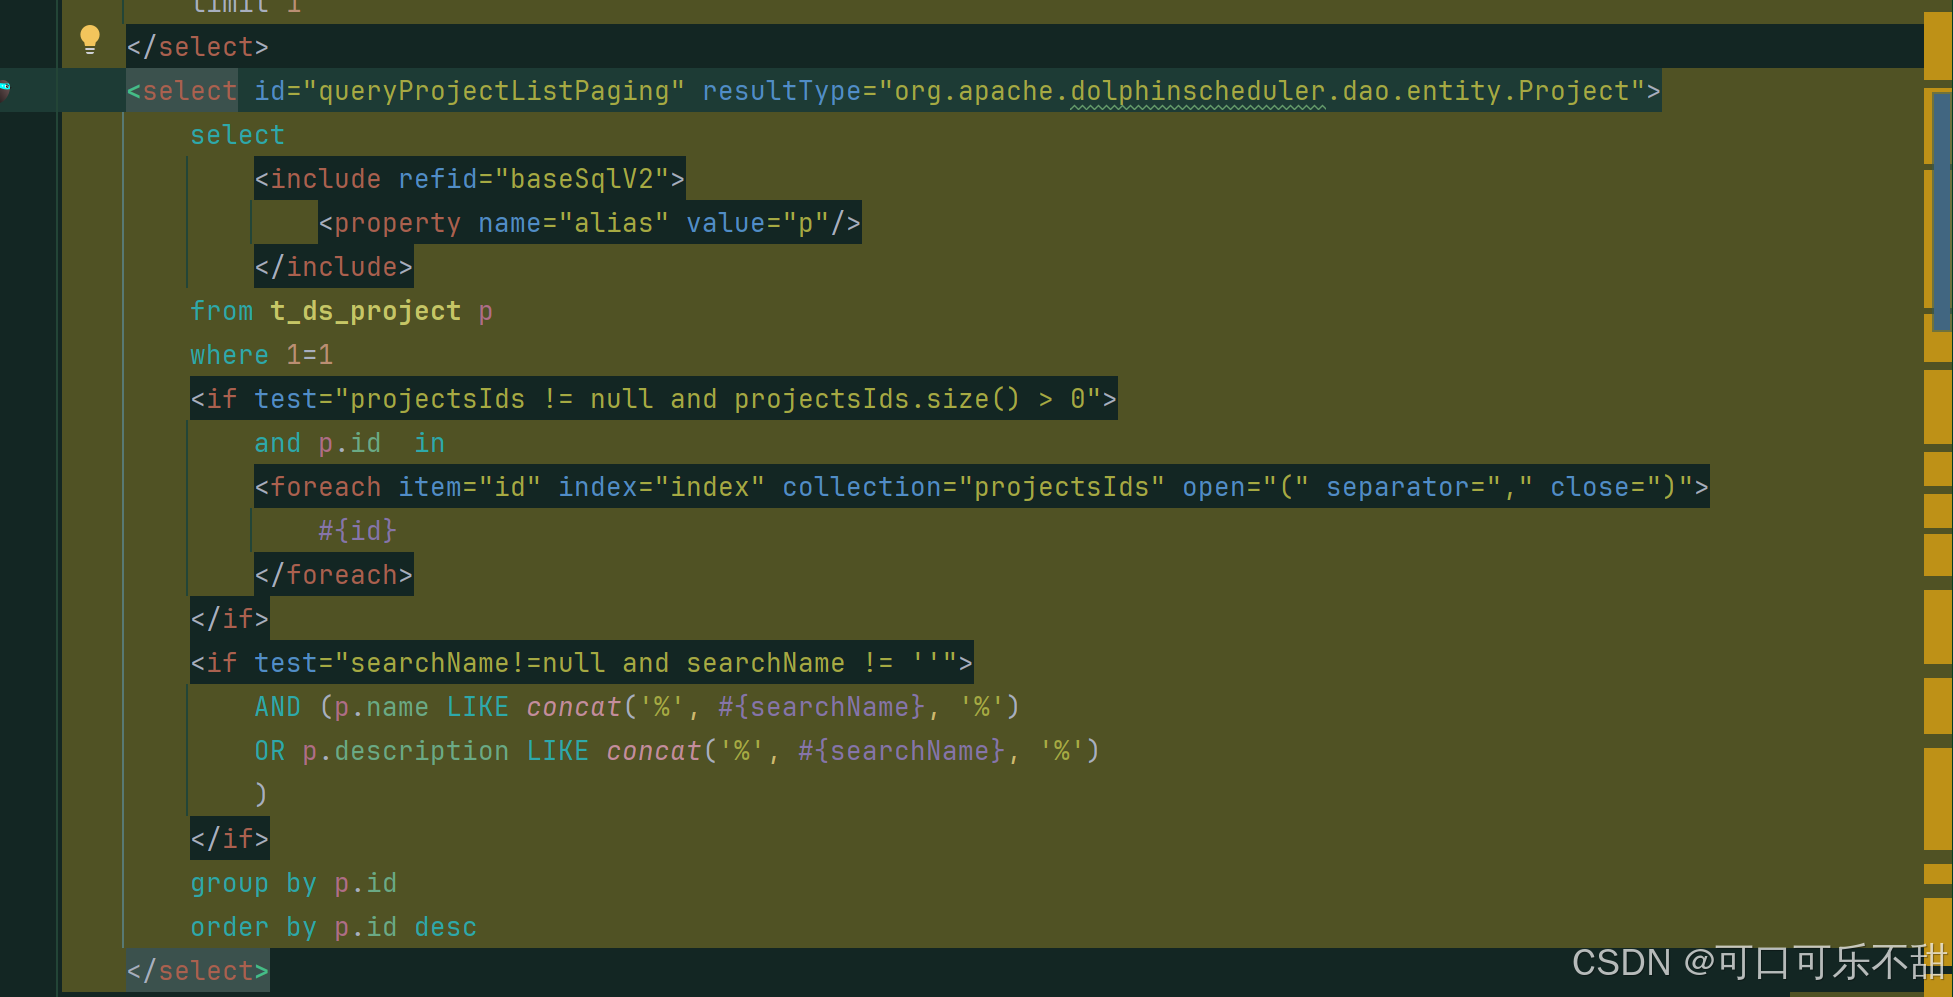
4.尝试查看源码,可能是慢查询
代码位置
5.使用arthas查看运行情况
curl -O https://arthas.aliyun.com/arthas-boot.jar
java -jar arthas-boot.jar
#找dolphinscheduler-api的那个就是,我的是第一个就看到了
查看运行状况,查看是哪里运行时间长。可以看到是queryProjectListPaging方法。
trace org.apache.dolphinscheduler.api.service.impl.ProjectServiceImpl queryProjectListPaging -n 1
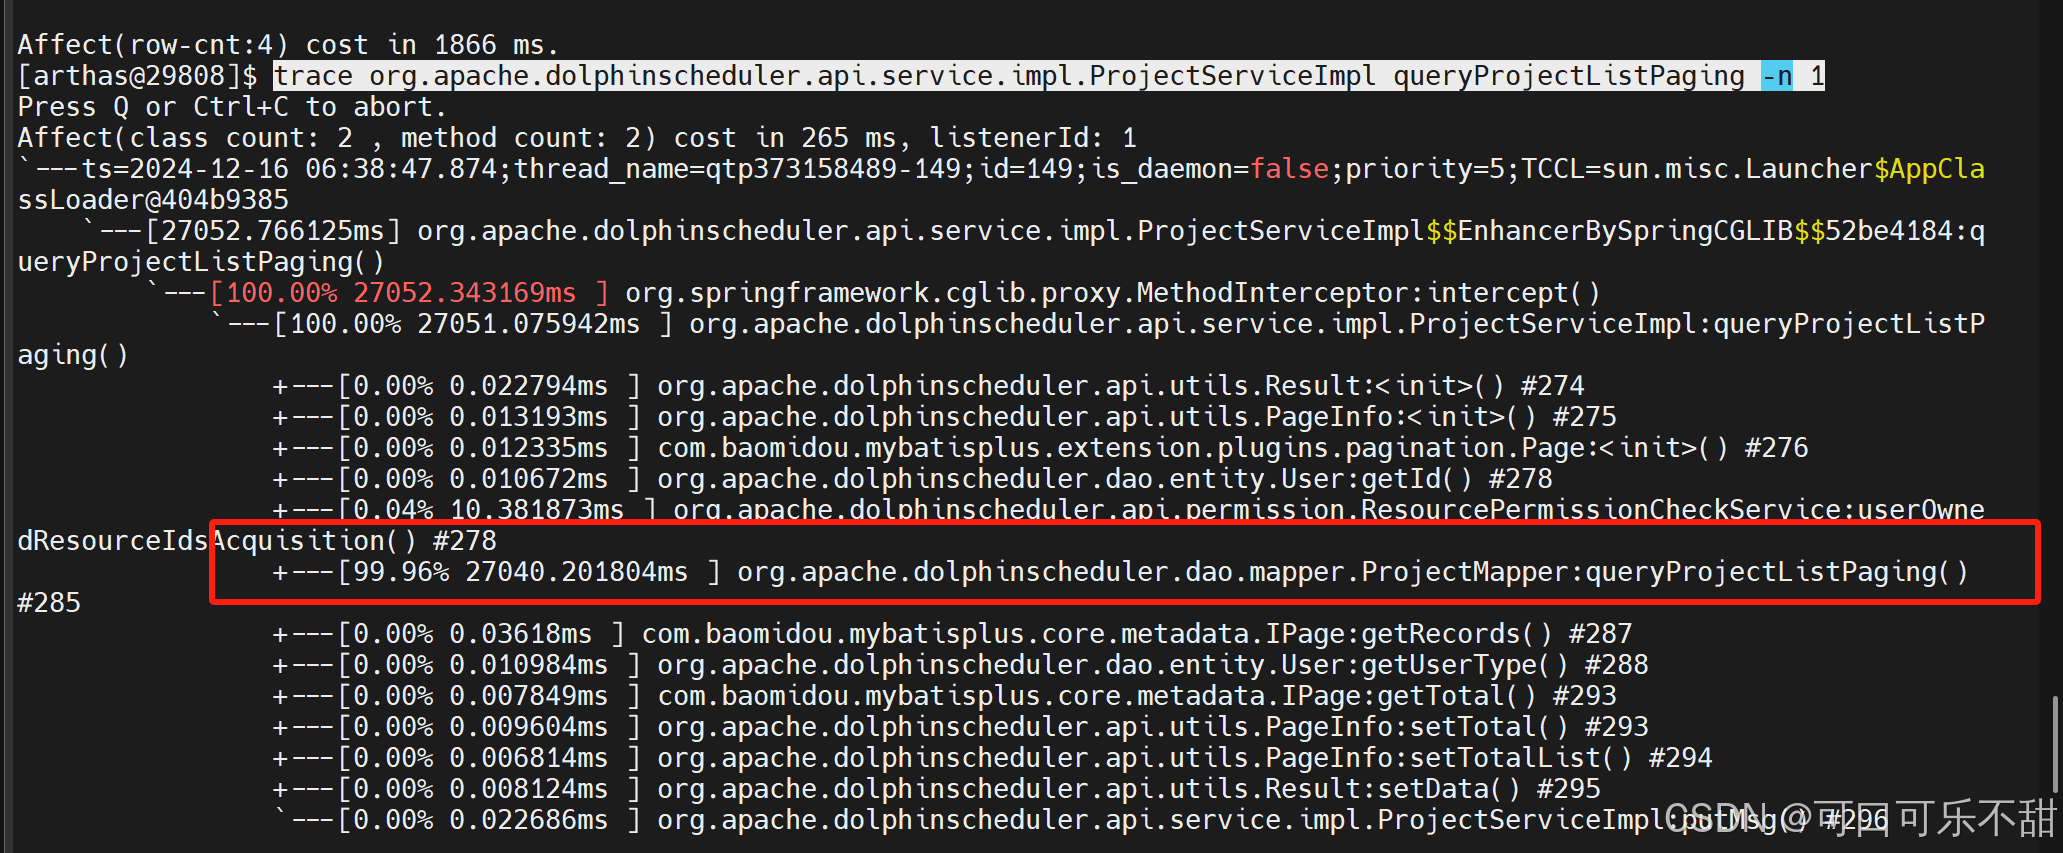
进入queryProjectListPaging方法
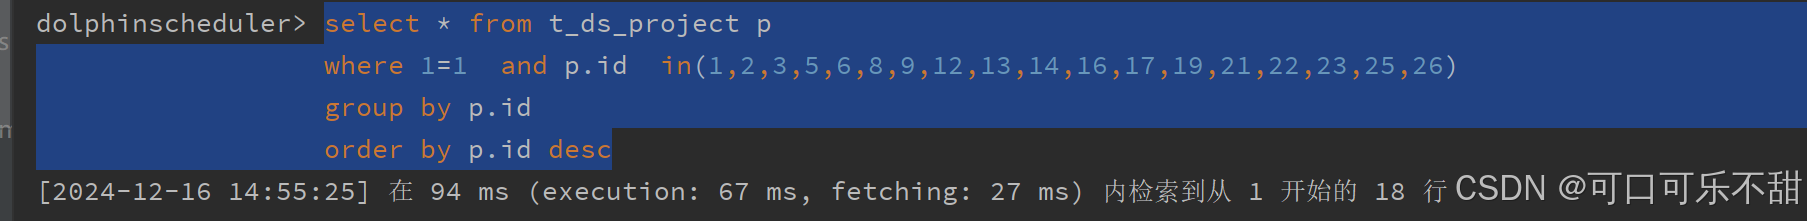
尝试运行sql,发现没有很慢。
select * from t_ds_project p
                  where 1=1  and p.id  in(1,2,3,5,6,8,9,12,13,14,16,17,19,21,22,23,25,26)
                  group by p.id
                  order by p.id desc
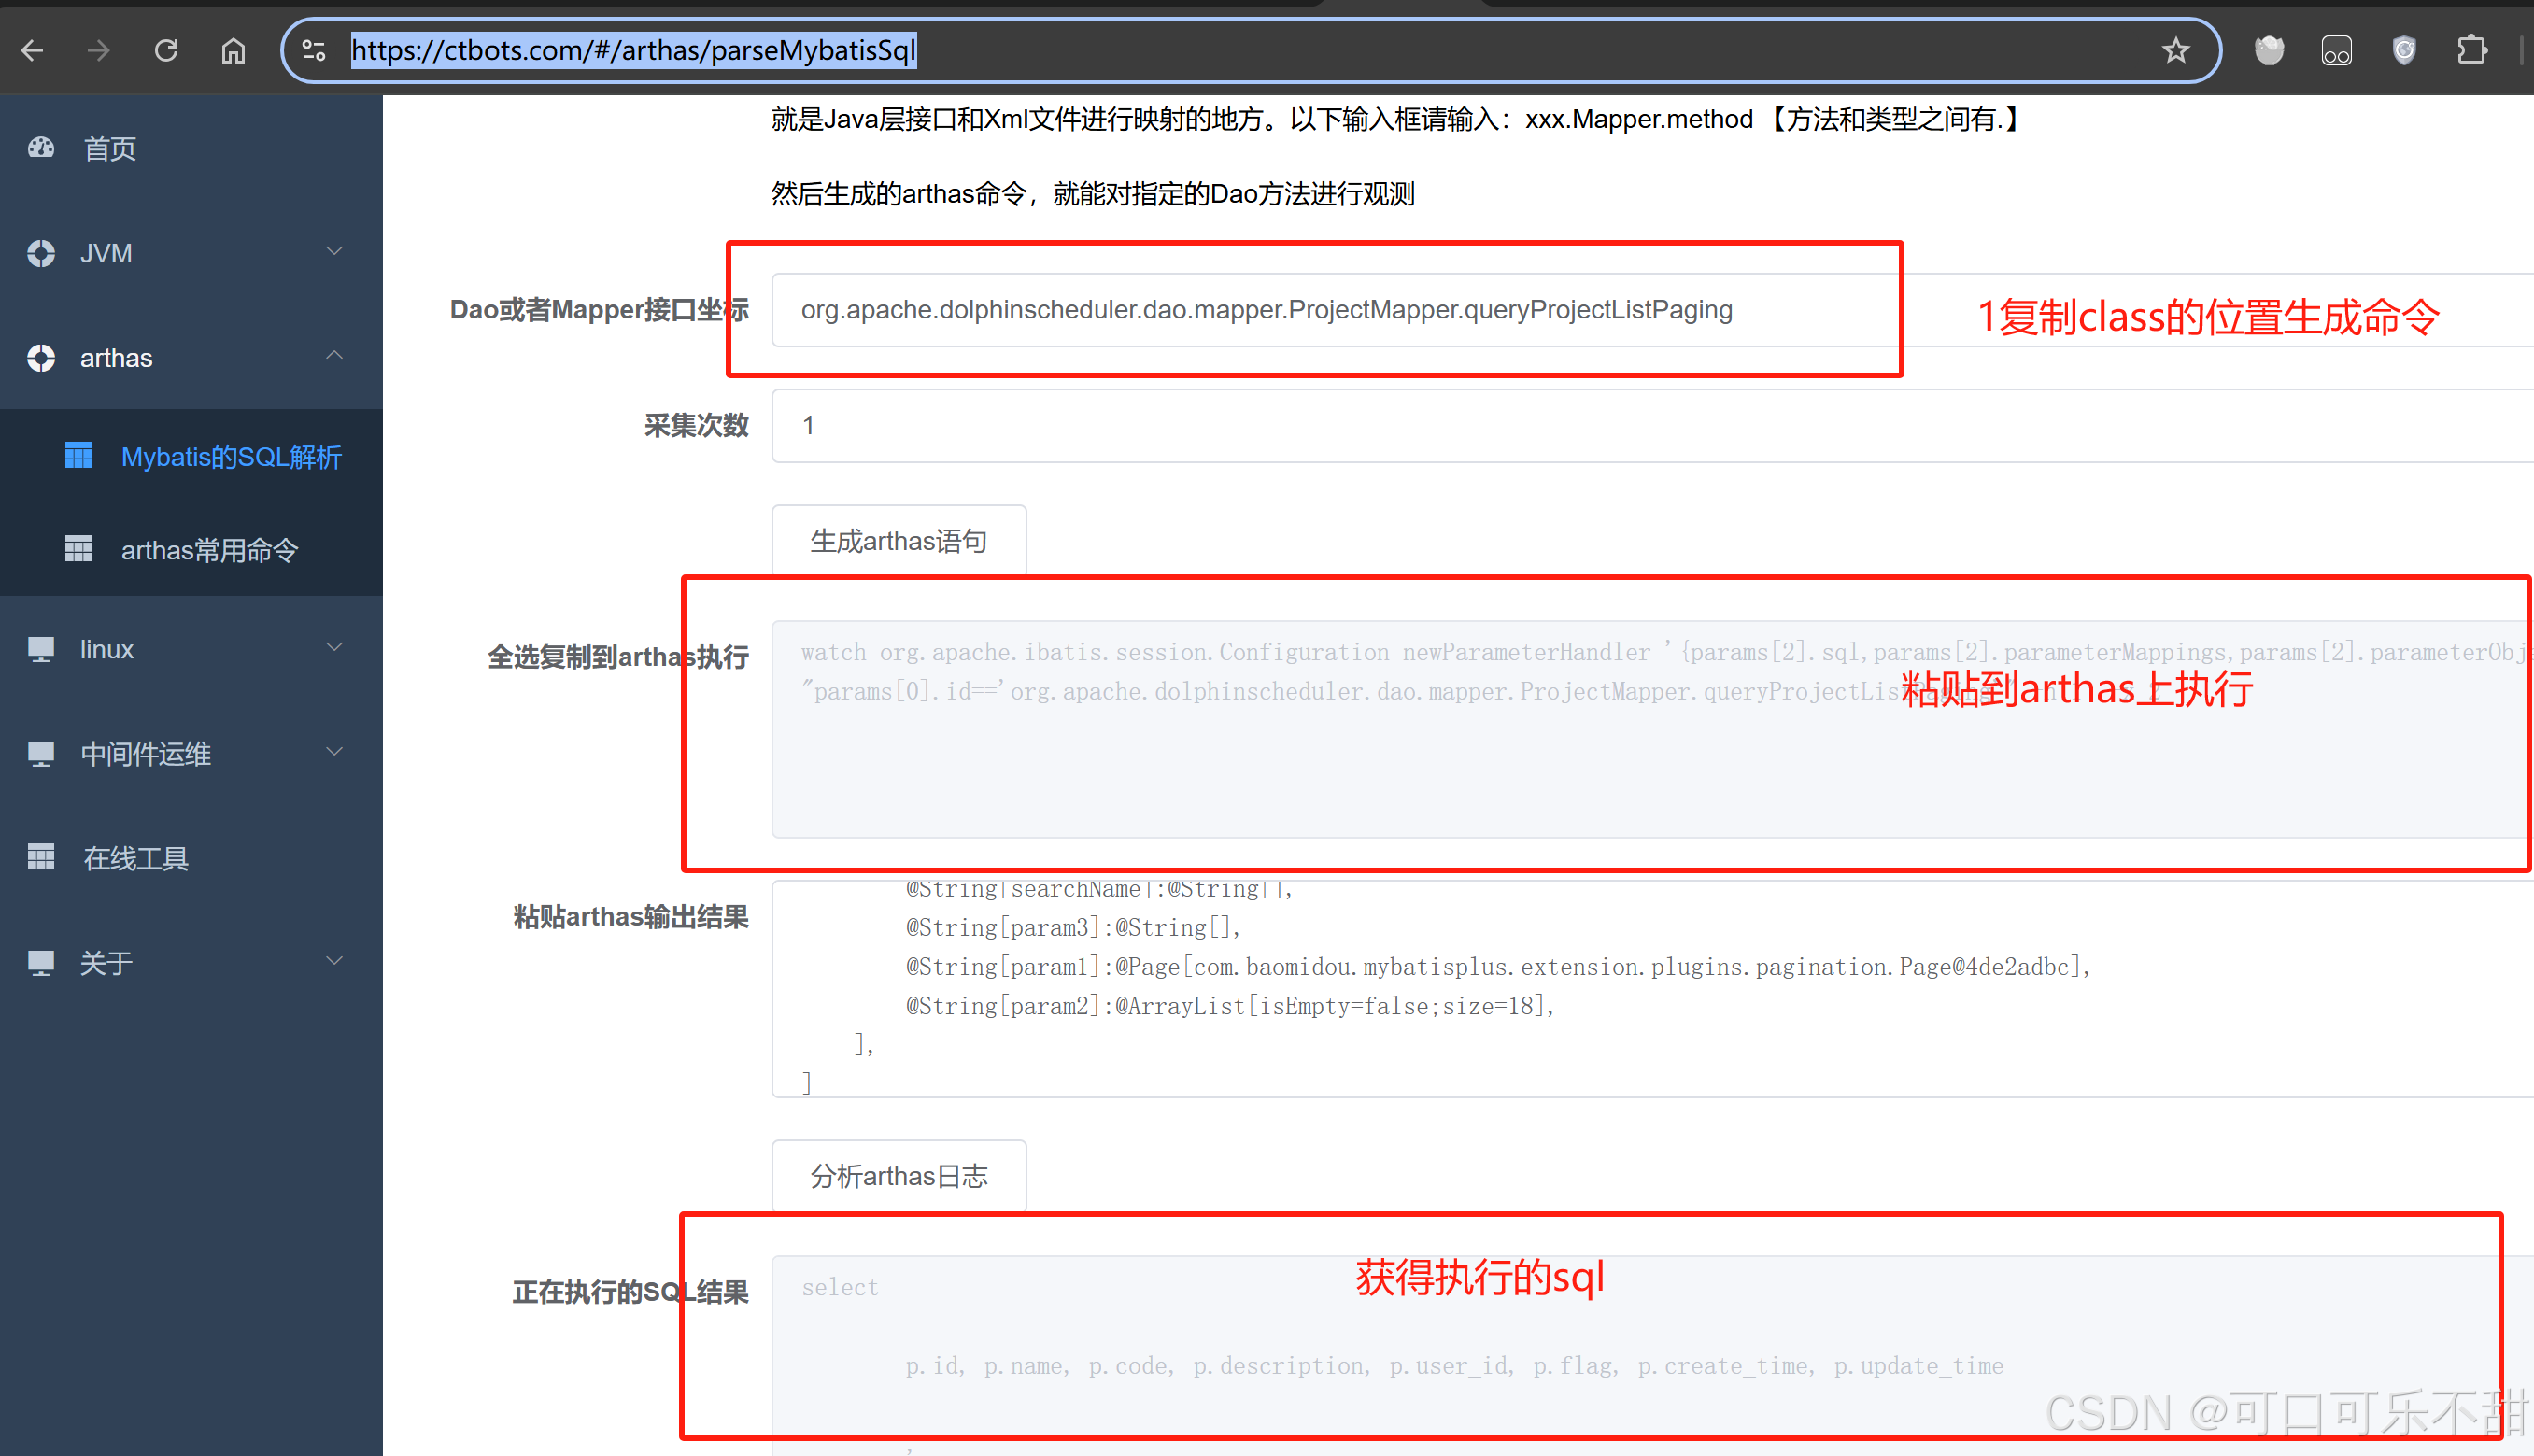
尝试运行海运再运行中的sql,这里使用了arthas加上https://ctbots.com/#/arthas/parseMybatisSql辅助获取运行的sql。
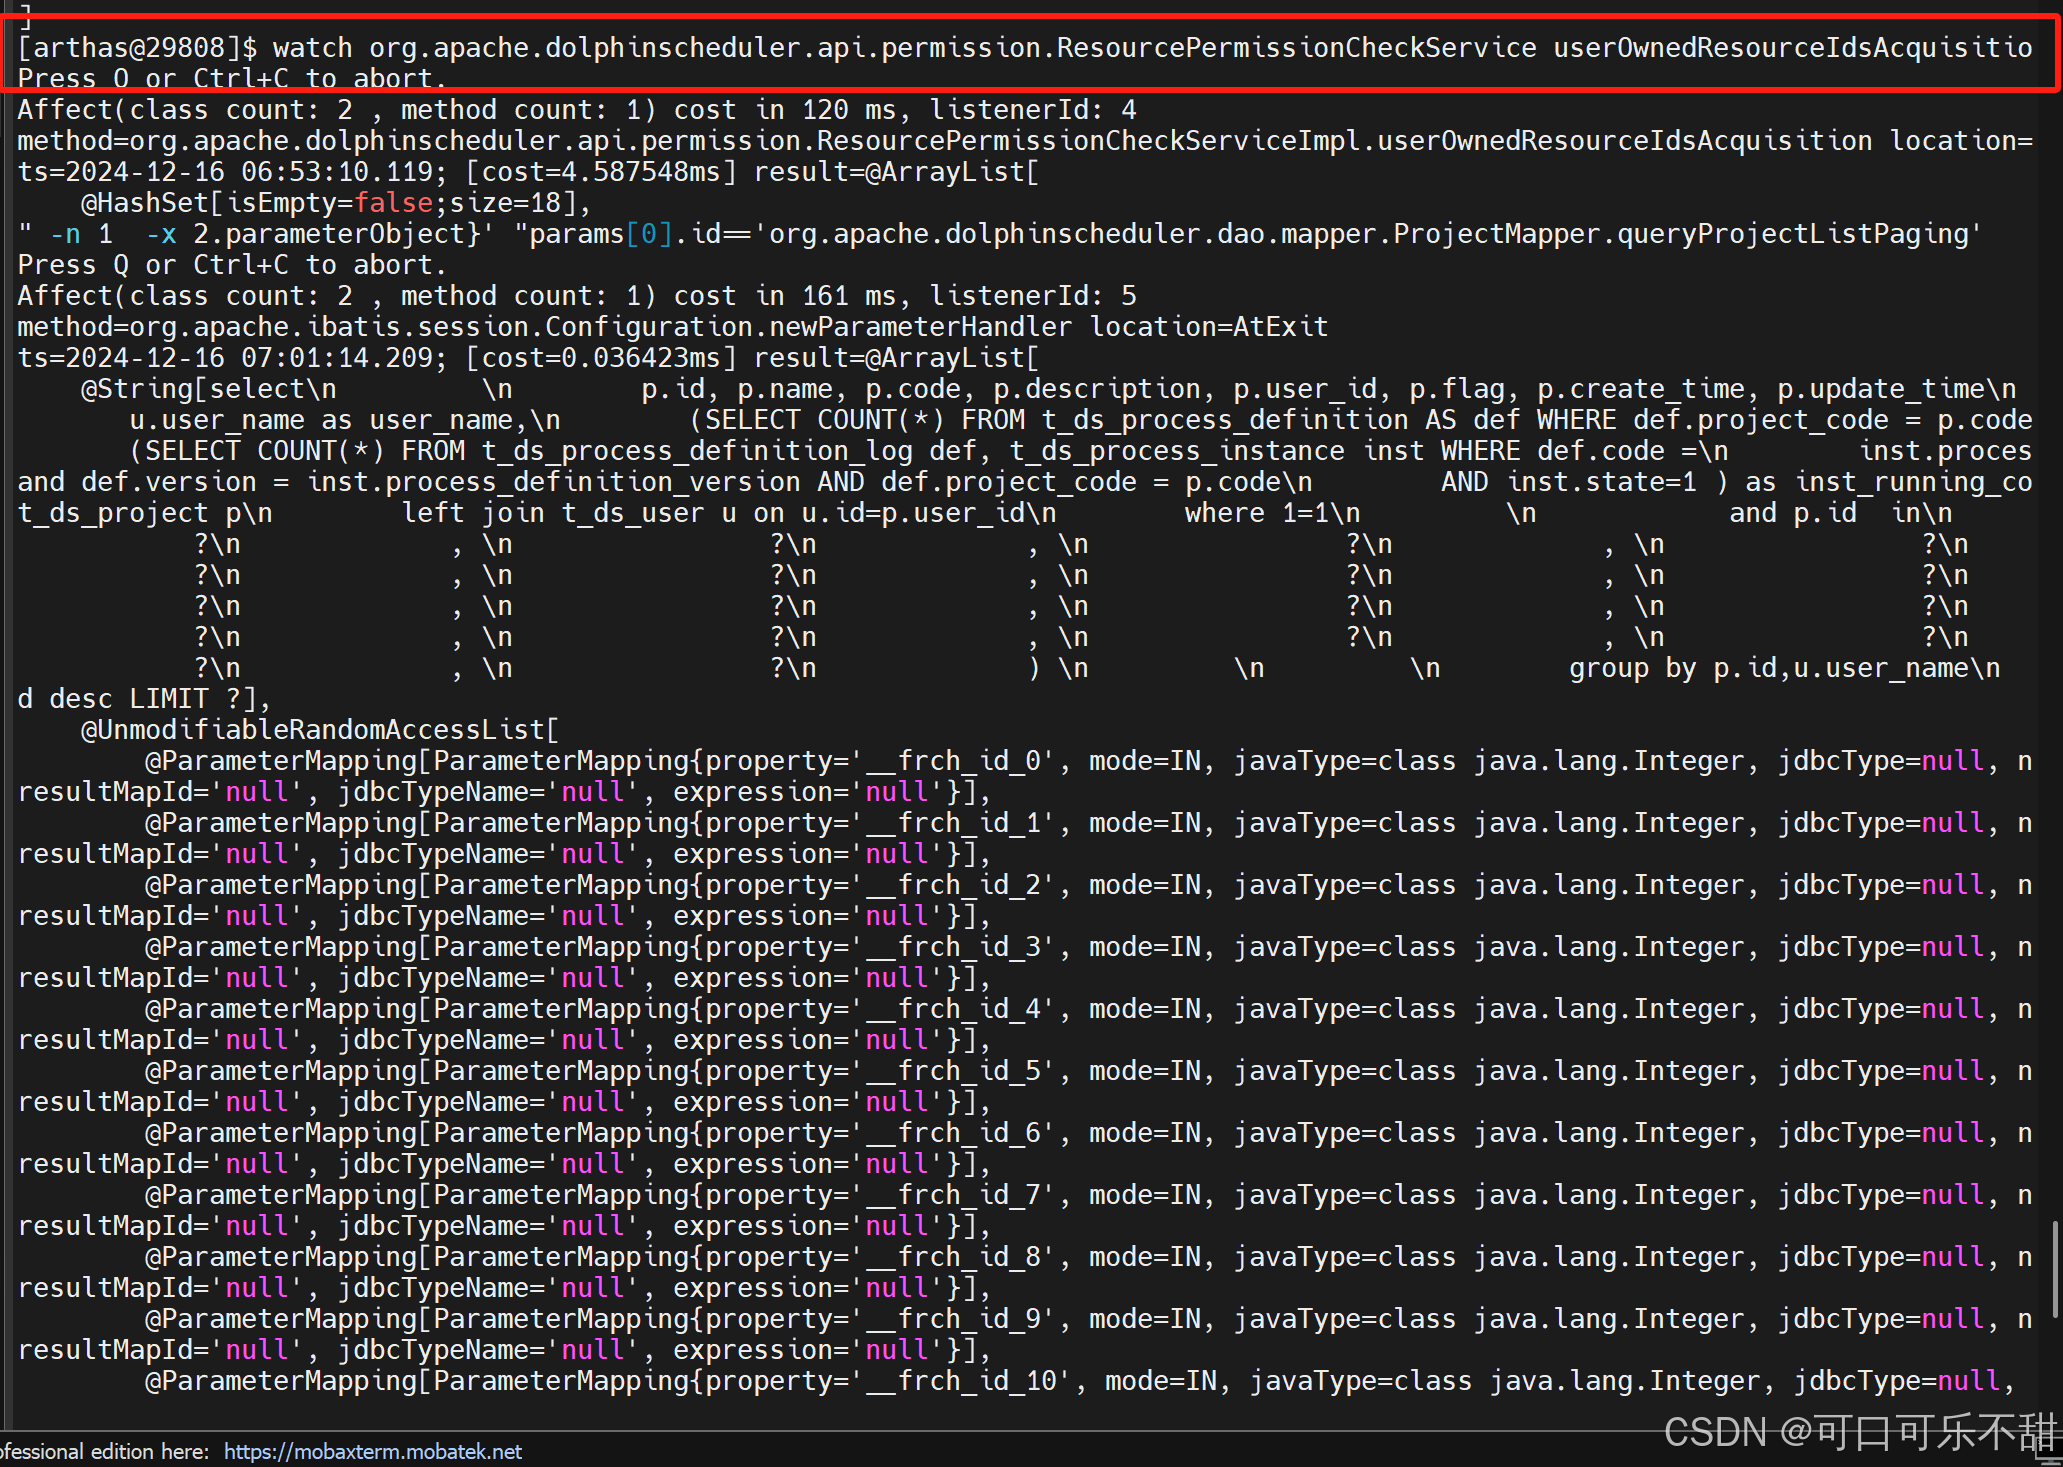
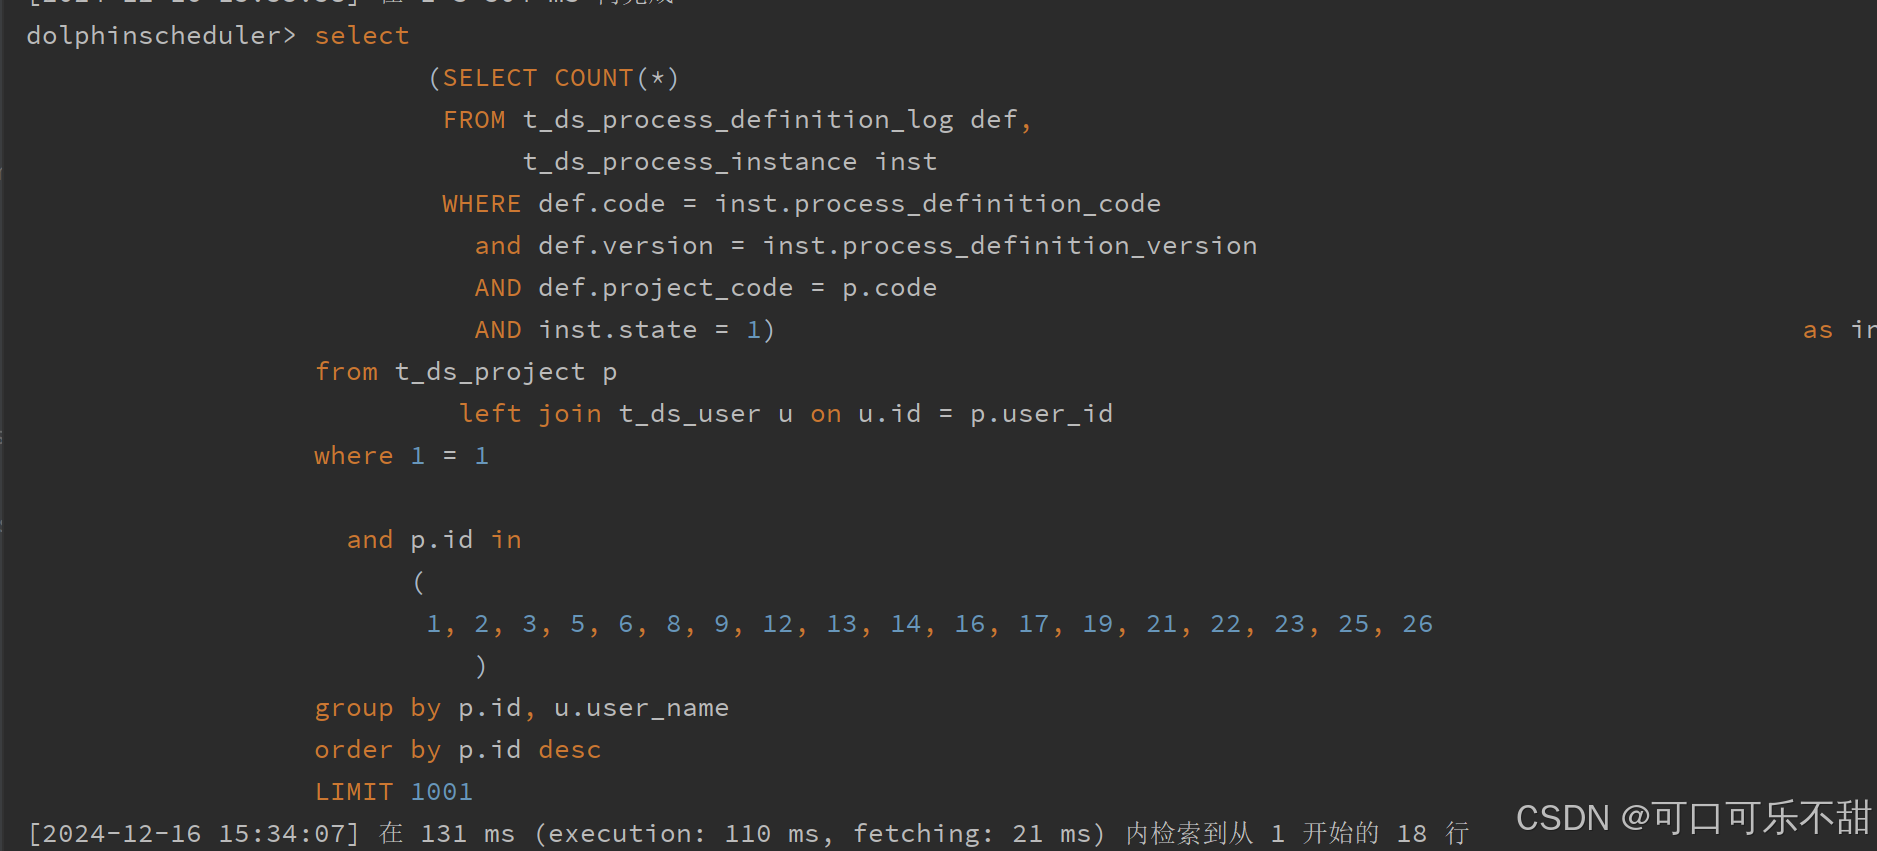
6.获得慢sql,进行分析
select

    p.id, p.name, p.code, p.description, p.user_id, p.flag, p.create_time, p.update_time

        ,
    u.user_name as user_name,
    (SELECT COUNT(*) FROM t_ds_process_definition AS def WHERE def.project_code = p.code) AS def_count,
    (SELECT COUNT(*) FROM t_ds_process_definition_log def, t_ds_process_instance inst WHERE def.code =
                                                                                            inst.process_definition_code and def.version = inst.process_definition_version AND def.project_code = p.code
                                                                                        AND inst.state=1 ) as inst_running_count
from t_ds_project p
         left join t_ds_user u on u.id=p.user_id
where 1=1

  and p.id  in
      (1, 2, 3, 5, 6, 8, 9, 12, 13, 14, 16, 17, 19, 21, 22, 23, 25, 26)
group by p.id,u.user_name
order by p.id desc LIMIT 100
通过explain分析sql可知是inst_running_count这里查询慢。查看t_ds_process_definition表就28万多数据,t_ds_process_definition_log表有1千数据。
由此可知是日志数据太多了。尝试优化这个查询。给t_ds_process_instance加索引
create index qwl_diy_index
    on t_ds_process_instance (process_definition_code, process_definition_version, state);
添加后验证,确实是快了。页面也恢复正常了。


 1315
1315

 被折叠的 条评论
为什么被折叠?
被折叠的 条评论
为什么被折叠?
 到【灌水乐园】发言


