


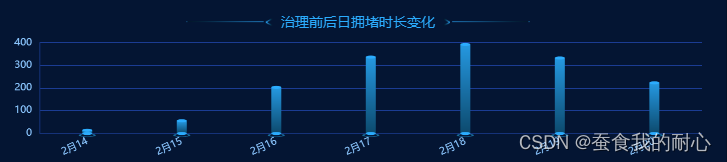
 该文章展示了一段Echarts的代码示例,用于创建具有3D效果的柱状图。通过配置项包括tooltip、xAxis、yAxis和series,实现了柱状图的绘制,包括底部、主体和顶部的柱子以及底部的圆环,以达到3D视觉效果。
原型图要求echarts显示3D
提示:无
例如:项目场景:显示3d 柱状图
使用代码
例如:echarts 配置Documentation - Apache EChartsApache ECharts,一款基于JavaScript的数据可视化图表库,提供直观,生动,可交互,可个性化定制的数据可视化图表。https://echarts.apache.org/zh/option.html#title代码:
 echartsInfo() {
      var chartDom = document.getElementById("scChangeId");
      var myChart = echarts.init(chartDom);
      var option;

      option = {
        tooltip: {
          trigger: "axis",
          axisPointer: {
            type: "shadow",
          },
        },
        grid: {
          top: "10%",
          left: "0",
          right: "0",
          bottom: "3%",
          containLabel: true,
        },
        xAxis: [
          {
            type: "category",
            data: [
              "2月14",
              "2月15",
              "2月16",
              "2月17",
              "2月18",
              "2月19",
              "2月20",
            ],
            axisTick: {
              show: false,
            },
            axisLabel: {
              show: true,
              rotate: 25,
              textStyle: {
                color: "#84C4FB",
                fontSize: 10,
              },
            },
            axisLine: {
              lineStyle: {
                color: "#033479",
              },
            },
          },
        ],
        yAxis: [
          {
            type: "value",
            axisTick: {
              alignWithLabel: true,
            },
            splitLine: {
              show: true,
              lineStyle: {
                color: "#033F93",
              },
            },
            axisLabel: {
              show: true,
              textStyle: {
                color: "#84C4FB",
                fontSize: 10,
              },
            },
            axisLine: {
              show: true,
              lineStyle: {
                color: "#033479",
              },
            },
            axisTick: {
              show: false,
            },
          },
        ],
        series: [
          {
            //柱子底部
            name: "",
            type: "pictorialBar",
            symbolSize: [10, 3],
            symbolOffset: [0, 2],
            z: 12,
            itemStyle: {
              normal: {
                color: "#00AEFF",
              },
            },
            data: [10, 52, 200, 334, 390, 330, 220],
          },
          {
            //柱体
            name: "",
            type: "bar",
            barWidth: 10,
            barGap: "0%",
            itemStyle: {
              normal: {
                color: {
                  x: 0,
                  y: 0,
                  x2: 0,
                  y2: 1,
                  type: "linear",
                  global: false,
                  colorStops: [
                    { offset: 0, color: "#019AE1" },
                    { offset: 1, color: "#014B6E" },
                  ],
                },
              },
            },
            data: [10, 52, 200, 334, 390, 330, 220],
          },
          {
            //柱子顶部
            name: "",
            type: "pictorialBar",
            symbolSize: [10, 3],
            symbolOffset: [0, -2],
            z: 12,
            symbolPosition: "end",
            itemStyle: {
              normal: {
                color: "#00AEFF",
              },
            },
            data: [10, 52, 200, 334, 390, 330, 220],
          },
          {
            //底部的圈
            name: '',
            type: 'pictorialBar',
            symbolSize: [15, 3],
            symbolOffset: [0, 4],
            z: 10,
            itemStyle: {
                normal: {
                    color: 'transparent',
                    borderColor: '#046C9C',
                    borderWidth: 1
                }
            },
            data: [10, 52, 200, 334, 390, 330, 220],
          },
        ],
      };

      option && myChart.setOption(option);
    },


 2万+
2万+

 被折叠的 条评论
为什么被折叠?
被折叠的 条评论
为什么被折叠?
 到【灌水乐园】发言


