


文章目录
I. Introduction of two-zone models
1.1 Introduction of two-zone models
During last simulation of one-zone models, we have established an ideal model for a closed, non-reacting system and assume the enclosed fluid is homogenous. However this kind of system doesn’t exchange mass. So on this basis, then we developed two-zone models which contain gas-exchange models for backflow, crossflow and intake, exhaust mass flow, combustion models and heat loss models. A two-zone model is defined to split the total cylinder volume in two distinct zones: and unburnt zone and a burnt zone which separated by a flame front. This flame front propagates into the unburnt zone and thereby converts fresh mixture into burnt gasses. This process is described by a conservation law for mass, the first law of thermodynamics and the equation of state. And then, we can get a system of equations to be solved as follows:
(
0
m
u
C
v
,
u
(
T
u
)
0
−
p
0
0
m
b
C
v
,
b
(
T
b
)
p
V
u
−
m
u
(
R
‾
M
u
)
0
−
p
V
b
0
−
m
b
(
R
‾
m
b
p
)
)
⎵
M
(
∂
p
∂
t
∂
T
u
∂
t
∂
T
b
∂
t
∂
V
b
∂
t
)
=
(
R
H
1
R
H
2
R
H
3
R
H
4
)
R
H
1
=
−
e
u
∂
m
u
∂
t
+
∂
Q
u
∂
t
−
∂
V
∂
t
+
∑
p
o
r
t
[
h
p
∂
m
u
∂
t
]
g
a
s
e
x
c
h
.
−
[
h
u
∂
m
b
∂
t
]
r
e
a
c
R
H
2
=
−
e
b
∂
m
b
∂
t
+
∂
Q
b
∂
t
+
∑
p
o
r
t
[
h
p
∂
m
b
∂
t
]
g
a
s
e
x
c
h
.
+
[
h
u
∂
m
b
∂
t
]
r
e
a
c
R
H
3
=
−
p
∂
V
∂
t
+
T
u
(
R
‾
M
~
u
)
∂
m
u
∂
t
R
H
4
=
T
b
(
R
‾
M
~
b
)
∂
m
b
∂
t
\underbrace{ \begin{pmatrix} 0 & {m_uC_{v,u}(T_u)} & 0& -p \\ 0 & 0 & {m_bC_{v,b}(T_b) }& p\\ V_u & -m_u(\frac{\overline{R}}{M_u}) & 0 & -p\\ V_b & 0 & -m_b(\frac{\overline{R}}{m_b} & p) \end{pmatrix}}_{\text{M}} {\begin{pmatrix} \frac{\partial p}{\partial t}\\\\ \frac{\partial T_u}{\partial t}\\\\ \frac{\partial T_b}{\partial t}\\\\ \frac{\partial V_b}{\partial t}\end{pmatrix}}=\begin{pmatrix}RH_1\\RH_2\\RH_3\\RH_4 \end{pmatrix}\\ RH_1\ =\ -e_u\frac{\partial{m_u}}{\partial t}+\frac{\partial Q_u}{\partial t}-\frac{\partial V}{\partial t}+\sum^{port}{\bigg[h_p \frac{\partial m_u}{\partial t}\bigg]}_{gas\ exch.}-\bigg[h_u \frac{\partial m_b}{\partial t} \bigg]_{reac} \\RH_2 \ =\ -e_b\frac{\partial{m_b}}{\partial t}+\frac{\partial Q_b}{\partial t}+\sum^{port}{\bigg[h_p \frac{\partial m_b}{\partial t}\bigg]}_{gas\ exch.}+\bigg[h_u \frac{\partial m_b}{\partial t} \bigg]_{reac} \\ RH_3\ = \ -p\frac{\partial V}{\partial t}+T_u \bigg(\frac{\overline R}{\widetilde M_u}\bigg)\frac{\partial m_u}{\partial t} \\RH_4 \ =\ T_b\bigg(\frac{\overline R}{\widetilde M_b}\bigg)\frac{\partial m_b}{\partial t}
M
⎝⎜⎜⎜⎛00VuVbmuCv,u(Tu)0−mu(MuR)00mbCv,b(Tb)0−mb(mbR−pp−pp)⎠⎟⎟⎟⎞⎝⎜⎜⎜⎜⎜⎜⎜⎜⎛∂t∂p∂t∂Tu∂t∂Tb∂t∂Vb⎠⎟⎟⎟⎟⎟⎟⎟⎟⎞=⎝⎜⎜⎛RH1RH2RH3RH4⎠⎟⎟⎞RH1 = −eu∂t∂mu+∂t∂Qu−∂t∂V+∑port[hp∂t∂mu]gas exch.−[hu∂t∂mb]reacRH2 = −eb∂t∂mb+∂t∂Qb+∑port[hp∂t∂mb]gas exch.+[hu∂t∂mb]reacRH3 = −p∂t∂V+Tu(M
uR)∂t∂muRH4 = Tb(M
bR)∂t∂mb
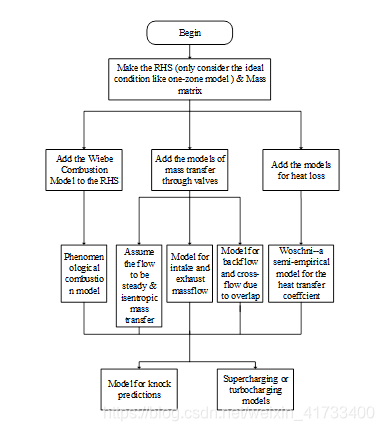
In order to close this system, coupled ODE’s sub-models have to be supplied. The important point is in the RHS(right hand side). Here we construct kinematic model of the crankshaft con-rod movement; combustion models; models for mass transfer through valves; heat loss models.
In our models, combustion model is one of the most well-known phenomenological models for SI engines----the Wiebe Law. For gas exchange through valves, we apply models for isentropic ducted flow in which the flow is assumed to be steady the conservation of energy. And we can take into account the backflow and crossflow and choke. Also, the discharge coefficient can be defined to indicate a real intake or exhaust runner friction and aerodynamic losses due to the curvature of the runner occur. And we should know the effective minimum cross-sectional surface.
After that, we could add models for knock predictions and supercharging or turbocharging. The whole structure of our system is as figure 1.
1.2 Results and analysis of the basic models
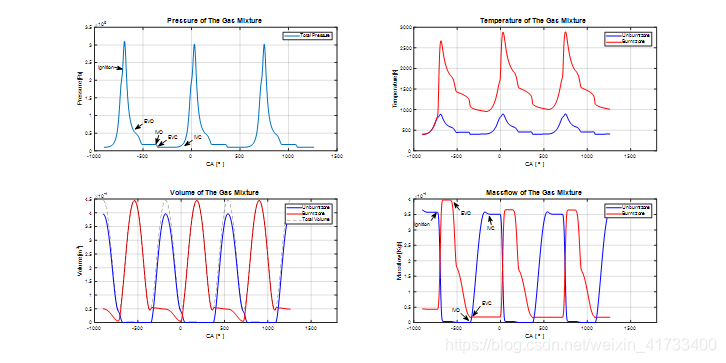
After running the main program with all the functions, we can get the results as follows:
,
,
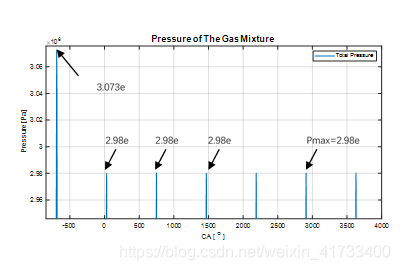
We can expand the range of CA, that means do different quantities of iteration and we can know when it will converge. As we can see in figure 3, actually, from the second cycle our pressure has converged, which indicates our choosing 3rd cycle is reasonable.
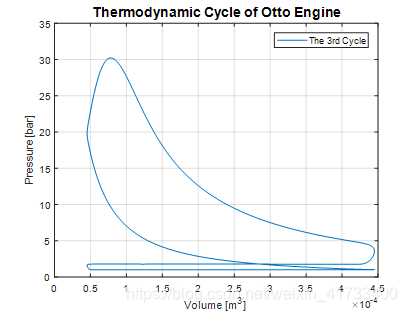
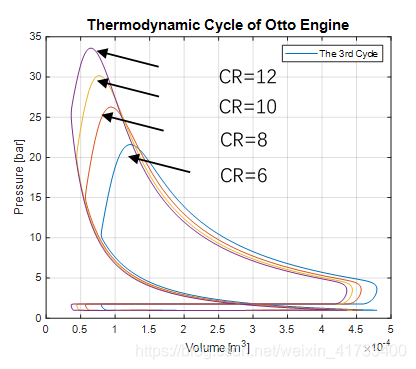
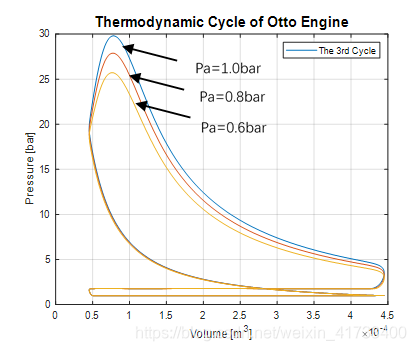
Finally we can plot the diagram of pressure-volume of the 3rd cycle in figure 4, it is like a typical Otto cycle in real circumstance. If we change different engine parameters, the cycle can be different.
,
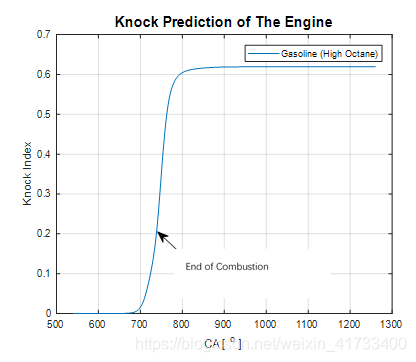
In order to know the knock issue, we can know from the figure 5, where we plot the KI(knock index) with CA, so we can say that if KI value at the end of combustion is less than 1, the engine knock won’t occur else it will. In our condition here, KI is 0.2<1, so there is no knock.
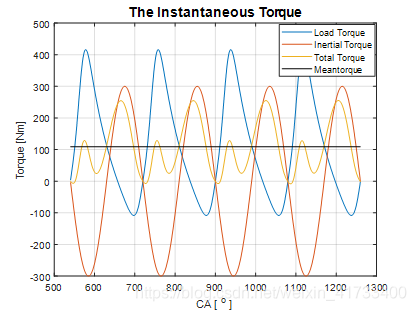
In figure 6, we can know the instantaneous torque, and total torque of our 4-cylinder engine. We can also calculate the ratio between total torque with mean torque to know our engines performance.
II. Influence of design parameters on performance
In this part, we want to perform some tests on engine performance when changing the design parameters by using our models to know how it works.
2.1 Influence of compression ratio
,
,
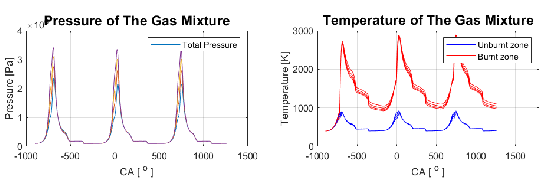
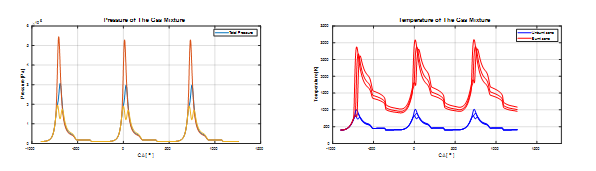
We do a testing loop to change the value of compression ratio from 2 to 30 bar. From figure 7 and figure 8, P-V diagram and the pressure and temperature variation with CA in typical compression ratios, we can know the trend pressure and temperature will increase with higher compression ratio. That’s because compression ratio can determine the maximum pressure in compression stroke and then maximum temperature can increase with the pressure increasing. And there will be more heat loss so the curve of expansion stroke at the same volume is lower, the end volume of the expansion stroke can be less.
,
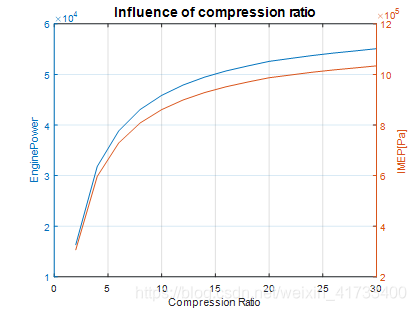
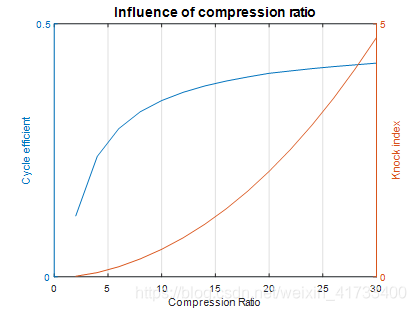
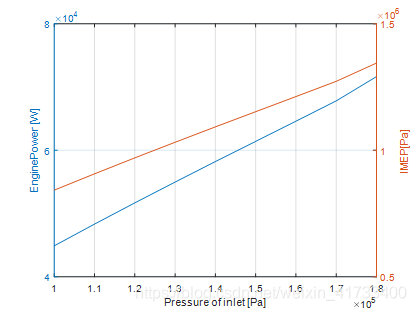
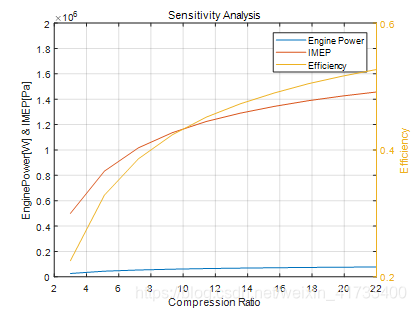
From the figure 9, we compute global engine performance indicators with different compression ratio. The cycle efficiency will increase sharply and then slowly, which indicates the sensibility of the efficiency with CR. As for KI, we can estimate if CR>11 the KI will more than 1, and there can be knock issue. Engine power and IMEP will increase slowly after CR=20, that means increasing CR when CR>20 has little influence with engine output.
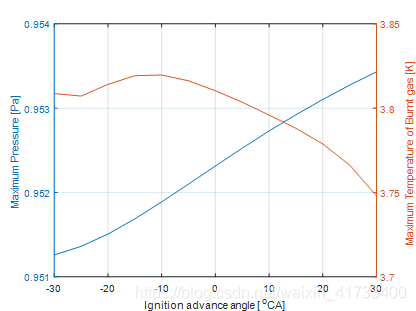
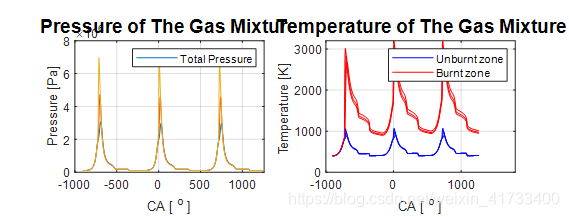
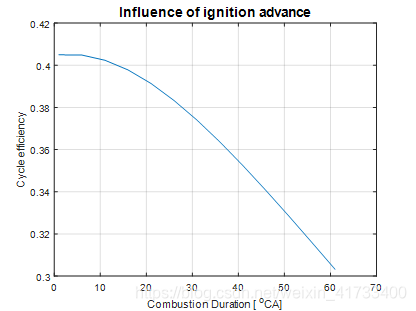
2.2 Influence of spark advance
,
,
,
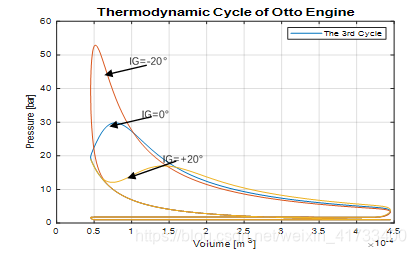
,
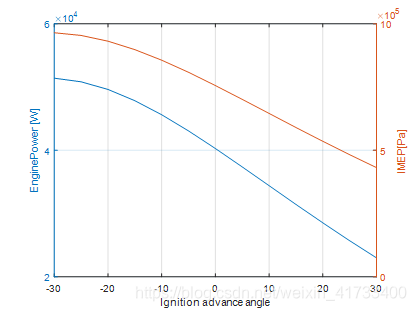
,
2.3 Influence of combustion duration
,
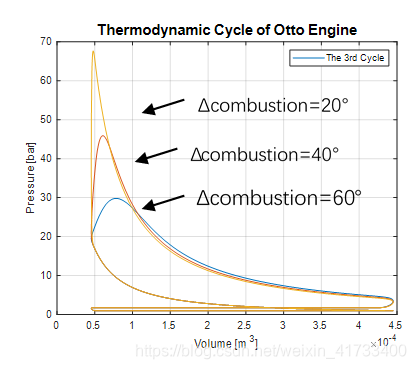
,
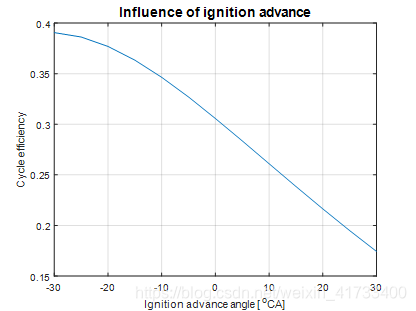
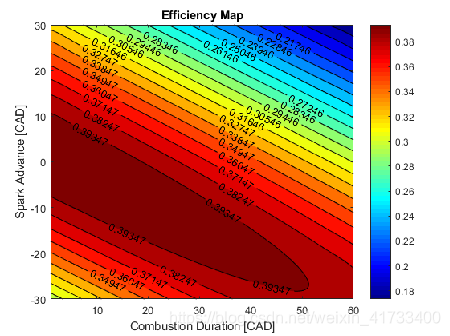
For the cycle efficiency, we plot the contour with spark advance and combustion duration in figure 17, then we can know the trend of changing the two variation. For example, if we fix the combustion duration to 10 cad, and just increase the increase the spark advance, then we know the efficiency increases first and then decreases.
,
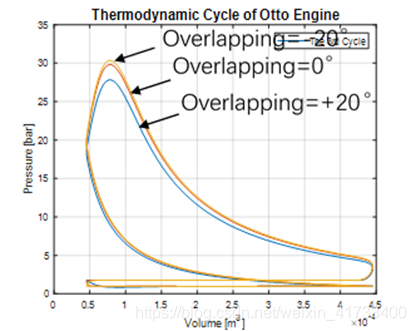
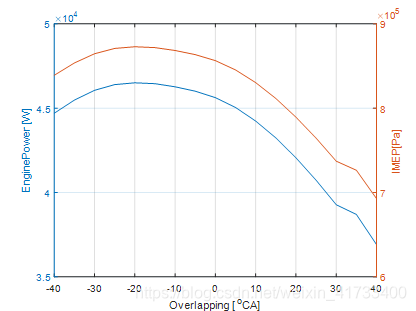
2.4 Influence of valve overlapping
,
,
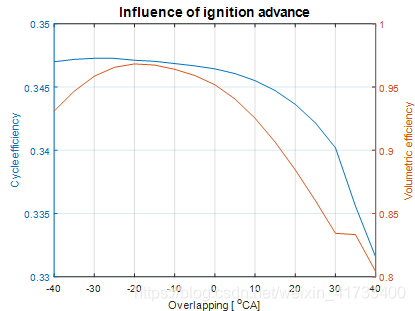
,
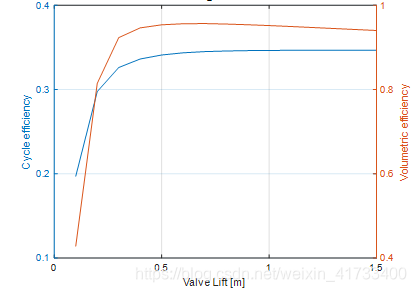
2.5 Influence of valve lift
We can now observe the influence of the total valve lift on the cycle. We can see that very low lift (lower than 0.3x regular value) our engine efficiency is dropping quiet a lot. This is explained by the sonic behavior of the flow through the valves as entering and expelling air has difficulties to go past valves. We can observe this phenomenon on the pumping loop from the cycle, giving high exhaust pressure and low intake pressure. We can also see that for our engine specs, even 0.5x factor in the lift allows for good engine working properties. Cycle efficiency is the highest at the highest lift, but volumetric efficiency prefers the intermediate values ( 0.5-0.8 coefficient ). That means we get better torque at this working point, but the efficiency/fuel consumption is not the best it can be.
,
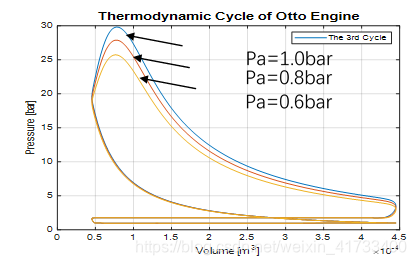
,
This first study of a supercharger considers a stable Pintake at 1atm. Fresh gas loop is without intercooler. And we simulate the effect of a supercharger at different ambient pressure, as if we go up and down in altitude. As we go up in altitude, pressure drops, and we drive the super charger at a higher compression ratio to compensate. As a result, temperature out of the supercharger increases and we get less air into the cylinder (in mass).
,
,
,
,
,
III. Knock predictions in SI IC-engines
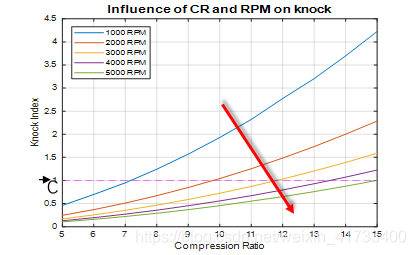
3.1 Influence of compression ratio on engine knock
| RPM | Cr_limit |
|---|---|
| 1000 | 7.2 |
| 2000 | 9.7 |
| 3000 | 11.7 |
| 4000 | 13.5 |
| 5000 | 15.0 |
,
,
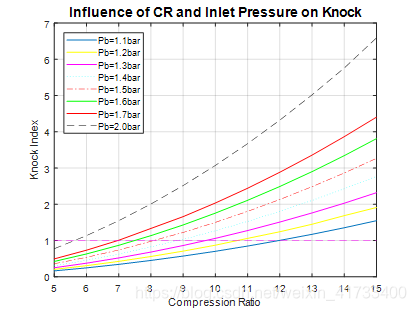
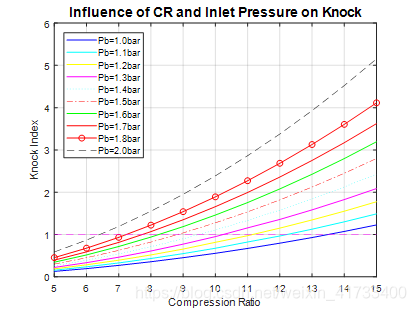
3.2 Influence of supercharging on engine knock occurrence
Using different fuels from a knock stand point is like studying three different factors.
First fuels have different energy density, and stoichiometric ratios. In that regards a fuel with lower AFR will be injected in higher quantities during intake stroke. Every fuels also have its own latent vaporization energy. If you combine both we get the cooling effect of the fuel when injected into the port (for PFI engine) or into the combustion chamber (for GDI).The lower the AFR the more fuel you need to vaporize. The higher the latent vaporization heat the more heat the fuel absorbs. This is very useful for knocking issue as more heat is absorbed, engine is less likely to knock.
Alcohol based fuel is exactly in this case with about 850kJ/kg of LHV, it is more than twice the value of heptane (320kJ/kg), combined with a AFR of 9, it is taking way more heat out of the combustion chamber. Furthermore the Octane number of the fuel is very important value. Gasoline would be rated between 87-93 while pure ethanol reaches 110. This means that auto ignition delays for a mixture of air and ethanol are longer than the gasoline ones, leading to less knock issue at low rpm. We are able to run higher compression ratio with the better fuels described above, with the same combustion characteristics, hence increasing overall engine efficiency.
3.3 Influence of supercharging on engine knock occurrence
,
,


 3074
3074

 被折叠的 条评论
为什么被折叠?
被折叠的 条评论
为什么被折叠?
 到【灌水乐园】发言


