


 该博客介绍了如何利用SimpleITK库对三幅相邻的下肢X光图像进行配准和融合,形成全景图像。通过预估平移变换,采用详尽优化器和启发式探索方法提高配准的鲁棒性,最终选择最佳转换方案完成图像拼接。
由于自己的课题需要,本人近期在研究Simpleitk的配准相关代码,刚好看到了其中169的DEMO,很有参考价值,把其分享给需要的朋友。
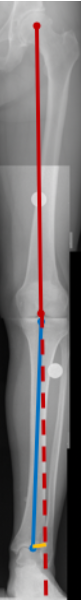
这个DEMO的主要工作是对三幅相邻的图像进行配准和融合,拼接成一幅全景的下肢图像。
其中提到了HKA的概念,大致是一种诊断标准,有兴趣的朋友可以自行去了解。
import SimpleITK as sitk
import numpy as np
import os.path
import copy

%matplotlib notebook
import gui
import matplotlib.pyplot as plt

#utility method that either downloads data from the Girder repository or
#if already downloaded returns the file name for reading from disk (cached data)
%run update_path_to_download_script
from downloaddata import fetch_data as fdata
加载图像
data_directory = os.path.dirname(fdata("leg_panorama/readme.txt"))

hip_image =  sitk.ReadImage(os.path.join(data_directory,'hip.mha'))
print(hip_image.GetSize())
knee_image =  sitk.ReadImage(os.path.join(data_directory,'knee.mha'))
print(knee_image.GetSize())
ankle_image =  sitk.ReadImage(os.path.join(data_directory,'ankle.mha'))
print(ankle_image.GetSize())
gui.multi_image_display2D([hip_image, knee_image, ankle_image], figure_size=(10,4));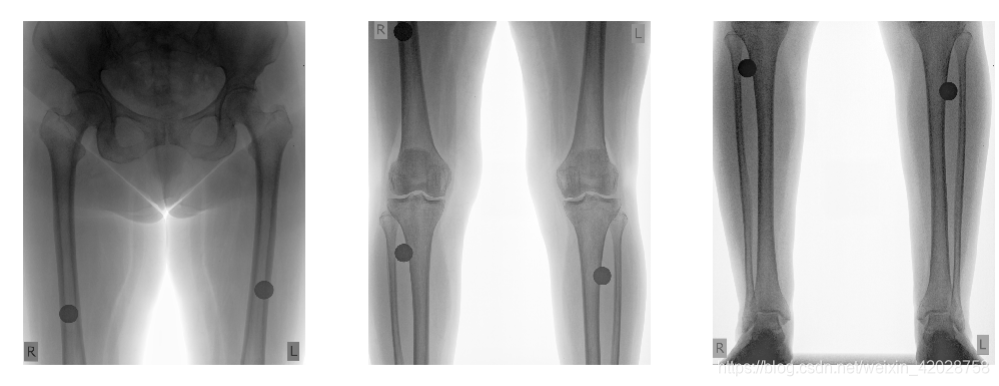
由于我们的目标是对图像进行配准,所以需要确定一个适当的相似性度量和转换类型。
显示一张图的灰度直方图分布
intensity_profile_image =ankle_image
fig = plt.figure()
plt.hist(sitk.GetArrayViewFromImage(intensity_profile_image).flatten(),bins=100);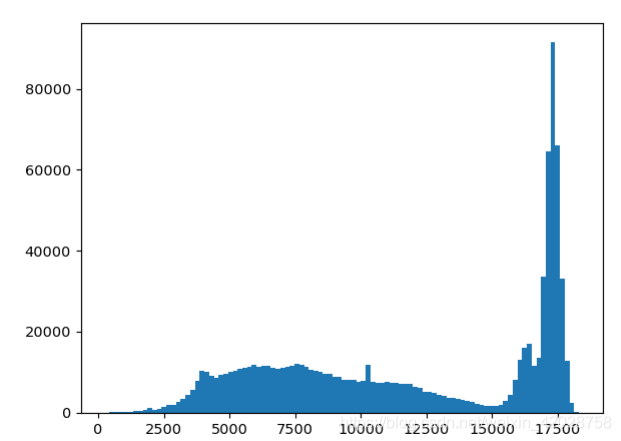
我们可以观察到,图像有一个高动态的范围。在显示时映射到一个低动态范围,因此我们不能观察所有潜在的强度变化。理想情况下,x射线图像的强度变化只发生在被成像对象发生变化时。
我们预估转换类型是平移变换,在观察图像的时候,我们观察到重叠区域的大小,预期平移,有显著的可变性,本文使用的是启发式探索——开发方法来提高我们的配准方法的鲁棒性。
由于图像重叠有相当大的变化,我们将使用详尽优化器获得几个起点,我们的探索步骤。然后,我们使用这些初始的转换估计,即我们的开发步骤,开始一个标准的注册。最后从开发阶段选择最佳的转换方案。
定义一个类——估计二维平移的相关性。假设固定图像和移动图像之间的一般关系(固定在移动图像的下面)。我们使用详尽的优化器对可能的翻译集进行抽样,并使用一个观察者将结果制成表格。
使用python中的字典dict——每一个key都有一个values.
class Evaluate2DTranslationCorrelation:def __init__(self, metric_sampling_percentage, min_row_overlap,
max_row_overlap, column_overlap, dx_step_num,
dy_step_num):
# metric_sampling_percentage:测度函数的抽样百分比
#min_row_overlap:两幅图片的最小重叠行
#max_row_overlap:两幅图片的最大重叠行
#column_overlap:在正或者负方向上,列的最大转换
#dx_step_num:参数空间中用于平移的样本数.x axis is 2*dx_step_num+1.
#dy_step_num:参数空间中用于平移的样本数.y axis is 2*dy_step_num+1.
'''
self._registration_values_dict = {} #创建一个字典用于存储values的值
self.X = None
self.Y = None
self.C = None
self._metric_sampling_percentage = metric_sampling_percentage
self._min_row_overlap = min_row_overlap
self._max_row_overlap = max_row_overlap
self._column_overlap = column_overlap
self._dx_step_num = dx_step_num
self._dy_step_num = dy_step_num
def _start_observer(self):
#定义开始观察
self._registration_values_dict = {}
self.X = None
self.Y = None
self.C = None
def _iteration_observer(self, registration_method):
    #获取x,y现在的位置
最低0.47元/天 解锁文章


 2331
2331

 被折叠的 条评论
为什么被折叠?
被折叠的 条评论
为什么被折叠?
 到【灌水乐园】发言


