


任务:绘制函数 y = 7x / (8-7*x) 的图形
备注:代码表示形式为VBScript
最终正确形式:
clc;
x = 0:0.01:1;
y = (7*x)./(8-7*x)
plot(x,y)
xlabel('向量化百分比');
ylabel('加速比');
axis([0 1 0 7]);
grid on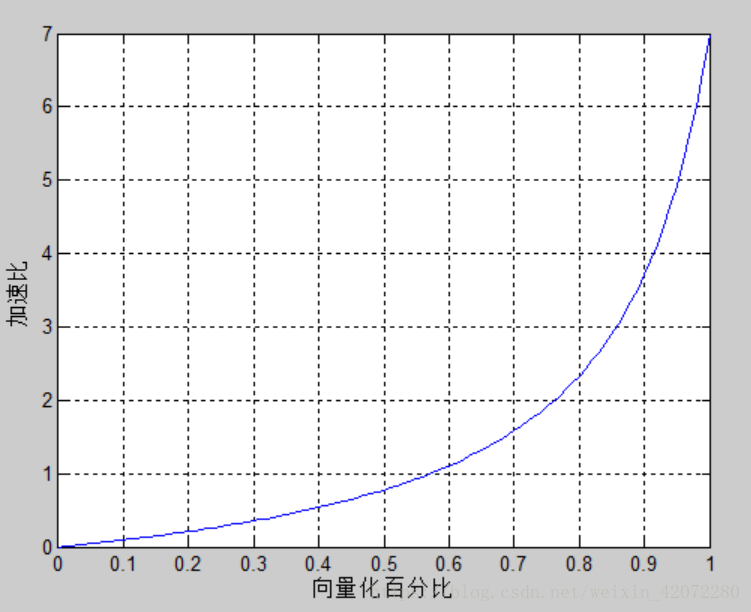
错误形式1:x = 0:1;
% matlab程序

clc;
x = 0:1;
y1 = 7*x
y2 = 8-7*x
y = y1 ./ y2
%axis([xmin xmax ymin ymax]) %xmin是x最小,xmax是x最大,ymin,ymax类似
subplot(311);plot(x,y1)
subplot(312);plot(x,y2)
subplot(313);plot(x,y)
axis([0 1 0 7]);
grid on  %绘制网格线
结果如下:
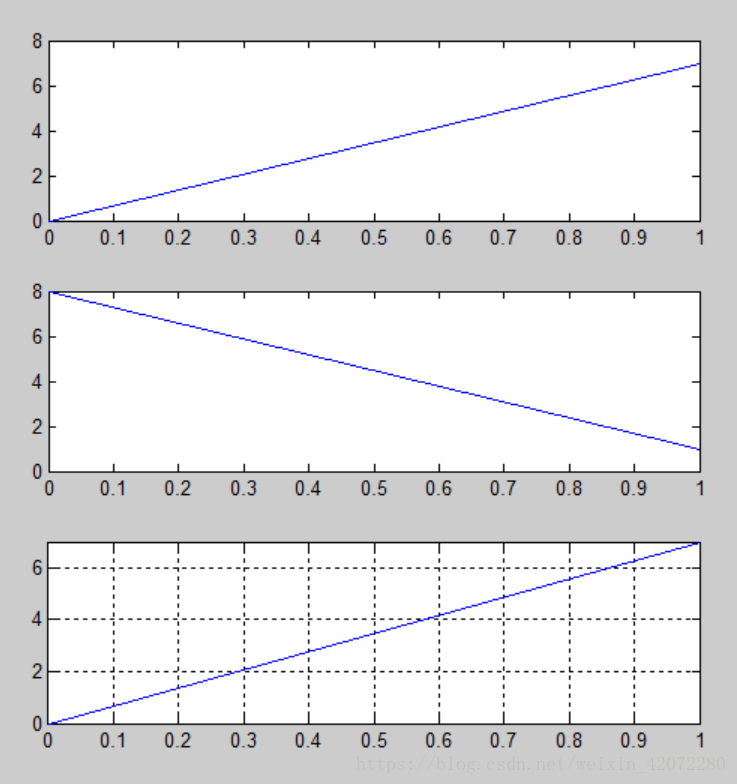
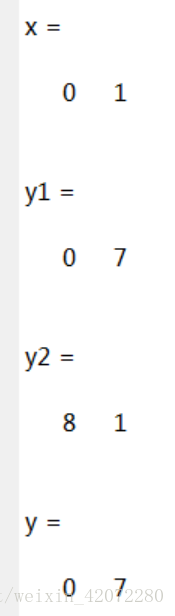
分析:这种形式下x是一个1*2矩阵,只有两个元素,分别是0和1;所以绘制出的曲线直接将x为0和1表示的点进行连接,故而是一条直线
错误形式2:x = rand(3);
% matlab程序

clc;
x = rand(3);
y1 = 7*x
y2 = 8-7*x
y = y1 ./ y2
%axis([xmin xmax ymin ymax]) %xmin是x最小,xmax是x最大,ymin,ymax类似
subplot(311);plot(x,y1)
subplot(312);plot(x,y2)
subplot(313);plot(x,y)
axis([0 1 0 7]);
grid on 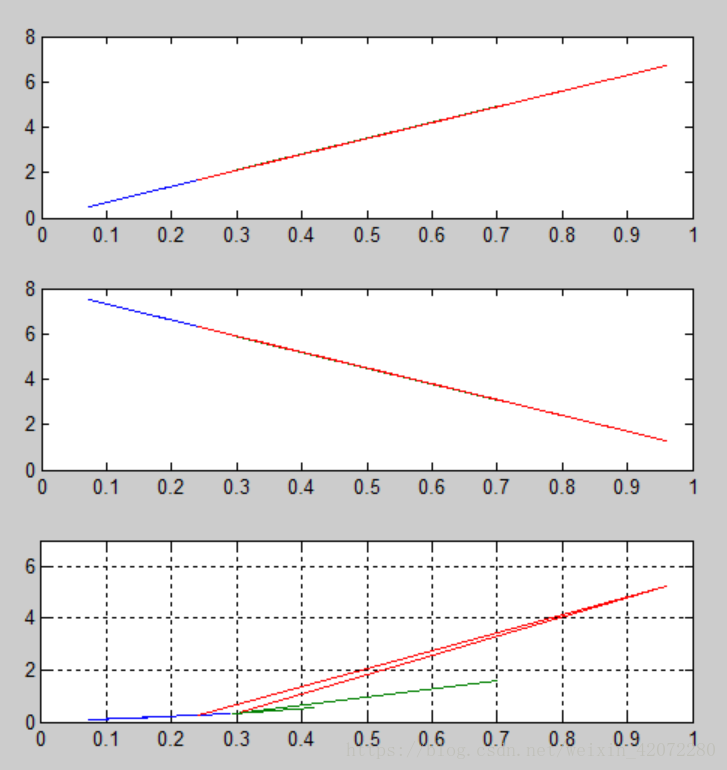
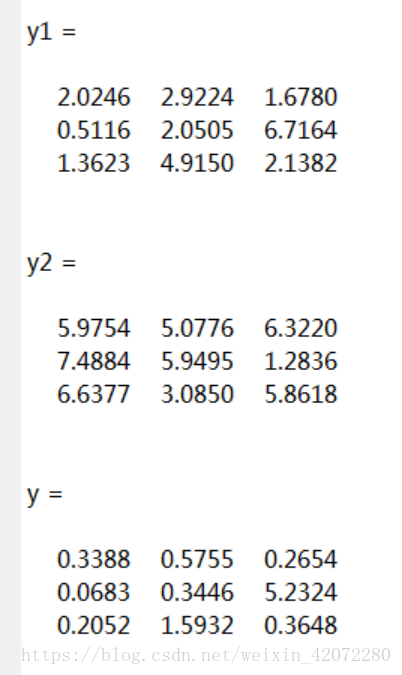
分析:rand(a,b):产生a行b列由在(0, 1)之间均匀分布的随机数组成的数组。
正确形式:x = 0:0.01:1;
% matlab程序

clc;
x = 0:0.01:1;
y1 = 7*x
y2 = 8-7*x
y = y1 ./ y2
%axis([xmin xmax ymin ymax]) %xmin是x最小,xmax是x最大,ymin,ymax类似
subplot(311);plot(x,y1)
subplot(312);plot(x,y2)
subplot(313);plot(x,y)
axis([0 1 0 7]);
grid on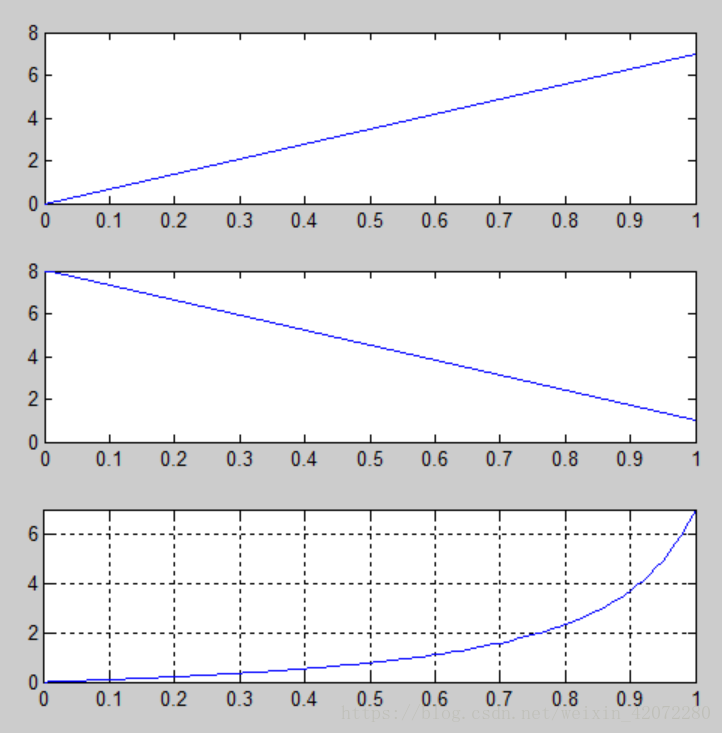


 8868
8868

 被折叠的 条评论
为什么被折叠?
被折叠的 条评论
为什么被折叠?
 到【灌水乐园】发言


