


 本文详细介绍了如何在MATLAB中绘制一元函数、二元函数的图像,包括多个函数在同一图像上的绘制方法,并展示了如何使用hold on和legend函数添加图例。
1.一元函数
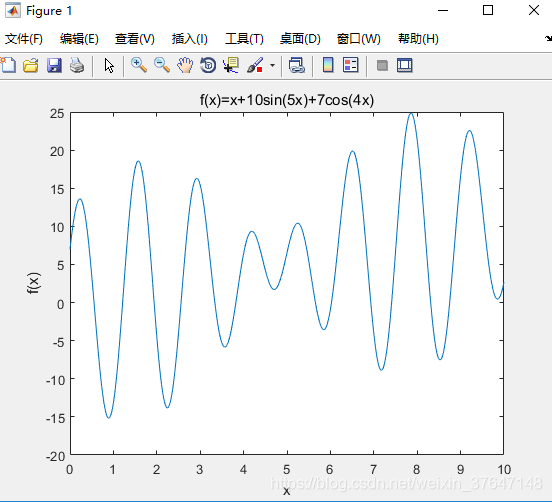
比如 f(x)=x+10sin(5x)+7cos(4x)
%%%%%%%%%f(x)=x+10sin(5x)+7cos(4x)%%%%%%%%%%
clear all;              %清除所有变量
close all;              %清图
clc;                    %清屏
x=0:0.01:10;
y=x+10*sin(5*x)+7*cos(4*x);
plot(x,y)
xlabel('x')
ylabel('f(x)')
title('f(x)=x+10sin(5x)+7cos(4x)')
结果
2.二元函数
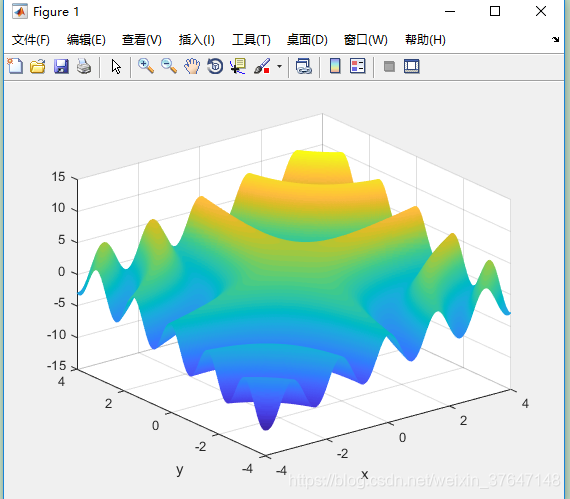
比如f(x,y)=3cos(xy)+x+y
%%%%%%%%%f(x,y)=3cos(xy)+x+y%%%%%%%%%%
clear all;              %清除所有变量
close all;              %清图
clc;                    %清屏
x=-4:0.02:4;
y=-4:0.02:4;
N=size(x,2);
for i=1:N
    for j=1:N
         z(i,j)=3*cos(x(i)*y(j))+x(i)+y(j);
    end
end
mesh(x,y,z)
xlabel('x')
ylabel('y')
结果
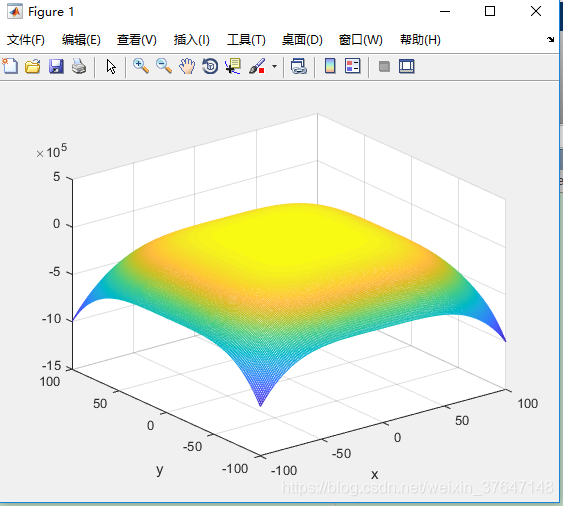
比如f(x,y)=-((x^2+y-1).^2+(x+y^2-7)^2)/200+10
%%%%%%%%f(x,y)=-((x^2+y-1).^2+(x+y^2-7)^2)/200+10%%%%%%%%
clear all;              %清除所有变量
close all;              %清图
clc;                    %清屏
x=-100:1:100;
y=-100:1:100;
N=size(x,2);
for i=1:N
    for j=1:N
        z(i,j)=-((x(i)^2+y(j)-1).^2+(x(i)+y(j)^2-7)^2)/200+10;
    end
end
mesh(x,y,z)
xlabel('x')
ylabel('y')
结果
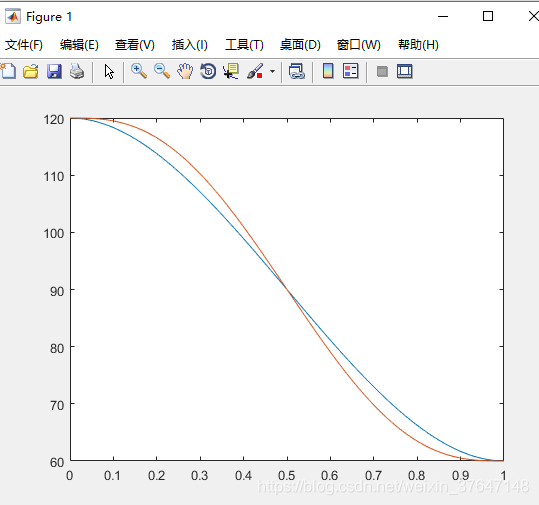
(1)多条曲线画在同一个图像里
tip:使用 hold on 函数
t=[0:0.01:1];
q1=120-180*t.^2+120*t.^3;
q2=120-600*t.^3+900*t.^4-360*t.^5;
plot(t,q1);hold on;
plot(t,q2);
结果
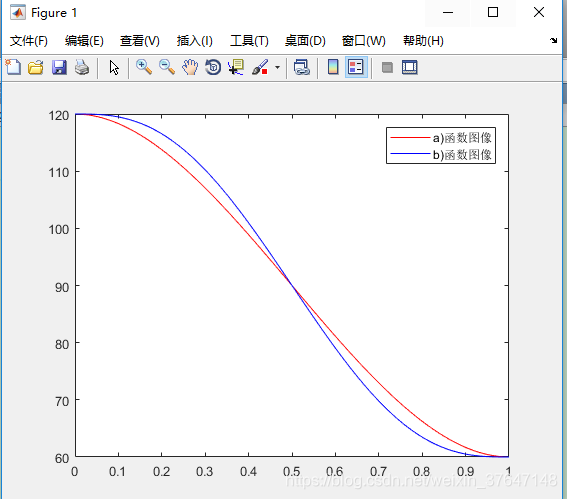
增加图例
利用l egend 函数
t=[0:0.01:1];
q1=120-180*t.^2+120*t.^3;
q2=120-600*t.^3+900*t.^4-360*t.^5;
plot(t,q1,'r'); hold on;
plot(t,q2,'b');
legend('a)函数图像','b)函数图像')  %要按函数的顺序来添加
参考文献
https://blog.csdn.net/weixin_42279993/article/details/89401523


 8871
8871

 被折叠的 条评论
为什么被折叠?
被折叠的 条评论
为什么被折叠?
 到【灌水乐园】发言


