


最近一直在处理金融方面的数据,其中比较难搞定的是财务报表里面的表格数据。很多非常有用的信息全部浓缩在表格里面,比如如下:

这个算是比较规整的、行列整齐的表格。下面的就稍微难一些些:

于是,研究了几天,做出了一版基本可用的单元格切割方案。
脚本见:https://github.com/yfyvan/table_crop
基本思路如下:

(1)横竖线定位用的是卷积
    img = cv2.imread(file_name, 0)

    # 定义单元格
    for name in ['raw_img', 'img_vertical', 'img_horizontal', 'img_add', 'img_add2', 'img_point']:
        cv2.namedWindow(name, 0)
        cv2.resizeWindow(name, 1000, 800)
        cv2.moveWindow(name, 200, 20)

    """
    step 1: 图像基本处理
    """
    # 二值处理
    _, img = cv2.threshold(img, 127, 255, cv2.THRESH_BINARY)

    if show_pro:
        cv2.imshow('raw_img', img)

    # 膨胀腐蚀
    rows, cols = img.shape

    # 识别横线,卷积加粗
    kernel = cv2.getStructuringElement(cv2.MORPH_RECT, (cols // scale1, 1))
    img_vertical = cv2.erode(img, kernel, iterations=1)
    if show_pro:
        cv2.imshow("img_vertical", img_vertical)

    # 识别竖线,卷积加粗
    kernel = cv2.getStructuringElement(cv2.MORPH_RECT, (1, rows // scale2))
    img_horizontal = cv2.erode(img, kernel, iterations=1)
    if show_pro:
        cv2.imshow("img_horizontal", img_horizontal)

    # 叠加取点
    img_add = cv2.add(img_vertical, img_horizontal)
    if show_pro:
        cv2.imshow("img_add", img_add)

    # 叠加去噪
    img_add2 = cv2.dilate(img_add, np.ones((3, 3)), iterations=1)
    if show_pro:
        cv2.imshow("img_add2", img_add2)
N x 1的卷积和1 x N的卷积分别是用来加粗横线和竖线的,加粗后变成如下的样子:

到这里横线竖线非常清晰可见了。接下来我们把坐标点找出来!
(2)坐标点定位
其实第一反应挺直接的,就是横线跟竖线的交点。那直接cv2.add
    # 叠加取点
    img_add = cv2.add(img_vertical, img_horizontal)
    if show_pro:
        cv2.imshow("img_add", img_add)

    cv2.imwrite('tmp/add.png', img_add)

    # 叠加去噪
    img_add2 = cv2.dilate(img_add, np.ones((3, 3)), iterations=1)
    if show_pro:
        cv2.imshow("img_add2", img_add2)
叠加后变成这样:

哇,到这是不是很明显了,交点已经非常直观了,接下来就是找到这些交点就行了。
(3)寻找最优交线坐标
这里,我们根据图2的结果,选取所有可能的横线坐标,在这里我把这个逻辑定义为:存在连续config.horizontal_threshold=300个点都是黑色点的位置为横线线位置
    y_possible = []
    for index in range(img.shape[0]):
        row = img_horizontal[index]
        for i in range(len(row) - horizontal_threshold):
            if sum(row[i: i + horizontal_threshold]) == 0:
                y_possible.append(index)
                break
这里的y就是,以一个像素为单位,所有的可能是横线的坐标(因为有存在密集数据的单元格,在腐蚀膨胀过程过变成噪音)
接下来继续精准定位横线的位置。
    # 扩大y范围,防止单向抑制
    y_final = []
    tmp = []
    for i in range(len(y_possible) - 1):
        # 寻找非跳跃交点,跳跃说明是下一条横线
        if y_possible[i + 1] - y_possible[i] < 3:
            tmp.append(i)
        else:
            # 发现跳跃点,则对当前区域连续点求均值
            y_index = (tmp[-1] + tmp[0]) // 2
            # 并前后各扩展5、10个像素值
            y_final.append(y_possible[y_index - 5: y_index + 10])
            tmp = []
一方面,我们认为,在上一步的结果之后,如果存在连续三个坐标点的像素值都是0,即:黑色。我们认为,这个横线是我们加粗的横向的起始位置(即粗黑线条的第一个像素值的坐标);另一方面,在找到这个值后,我们前后各扩展5、10 个像素值作为下一步计算的数据。
接下来,做最优横线的选取,为什么还不是最优的,我们看:

因为在线的叠加时,会存在格中格,这些单元格在叠加过程中只有一半的叠加线是黑色的,如上,我们可能选出了5条备选线,但是只有第3条是正确的,但是只要在3到5之间的线,都是可用的。
    # 定位x
    y_final_cnt = []
    # 加上底线区域
    y_final.append(list(range(shape[0] - 30, shape[0])))

    # 求区域内交点个数最大的第一条线
    # (第二第三无所谓,理论上第一条与最后一条的均值是最合适的,但是逻辑太复杂。。。)
    # (第一条线会导致矩形方框的下底整体上移)
    for y_scope in y_final:
        cnt = 0
        y_scope_tmp = []
        for y_index in y_scope:
            y_value = img_add2[y_index]
            for flag_index in range(len(y_value) - 1):
                if y_value[flag_index] == 0 and y_value[flag_index + 1] != 0:
                    cnt += 1
            y_scope_tmp.append(cnt)
            cnt = 0
        y_final_cnt.append(y_scope_tmp)
    # 取出最大的第一条的坐标值
    y_final_cnt = list(filter(lambda x: x != [], y_final_cnt))
    max_cnt_indexs = list(map(lambda x: x.index(max(x)), y_final_cnt))
    # 取出x该点的y轴坐标值
    y_cors = [y_final[y_cor_index][max_cnt_indexs[y_cor_index]] for y_cor_index in range(len(max_cnt_indexs))]
这一步定义为:选择备选线中黑色交点最多的第一条线
上面这步,可就是选取这一步黑线的代码。到此,最优横线已找到。
不管找的是横线还是竖线,逻辑都是一样的,先横后竖,先竖后横都一样。
(4、5)寻找交点,拼接交点
找到了横线,那接下来在叠图的基础上把横线对应的所有坐标中,取出像素值为0的点就OK
    # 定位y
    x_cors = []
    for y in y_cors:
        x_cors_tmp = []
        xs = img_add2[y]
        xx, yy = list(zip(*enumerate(xs)))
        x_index = 0
        while x_index < len(xs):
            if xs[x_index] == 0:
                x_cors_tmp.append(x_index)
                x_index += 20
                if x_index >= len(yy):
                    break
            x_index += 1
        x_cors.append(x_cors_tmp)

    # 所有可能的y轴坐标
    # print(y_cors)
    # 每个y轴坐标对应的所有可能的x轴坐标
    # print(x_cors)

    """
    step 4: 拼接所有可能区域坐标集

    """
    cors = []

    # 拼接坐标点
    index = 0
    while index < len(y_cors):
        ys_tmp = y_cors[index]
        xs_tmp_list = x_cors[index]
        for xs_tmp in xs_tmp_list:
            cors.append((ys_tmp, xs_tmp))
        index += 1
然后,我们提取所有的可能的交点坐标
    cors = []

    # 拼接坐标点
    index = 0
    while index < len(y_cors):
        ys_tmp = y_cors[index]
        xs_tmp_list = x_cors[index]
        for xs_tmp in xs_tmp_list:
            cors.append((ys_tmp, xs_tmp))
        index += 1

    cors = sorted(set(cors))
    # (219, 368), (219, 694), (284, 368), (284, 694)

    # 分割行
    new_cors = {}
    for cor in cors:
        if cor[0] not in new_cors:
            new_cors[cor[0]] = []
        new_cors[cor[0]].append(cor)

    new_cors = list(new_cors.values())
其结果抽象出来如下:
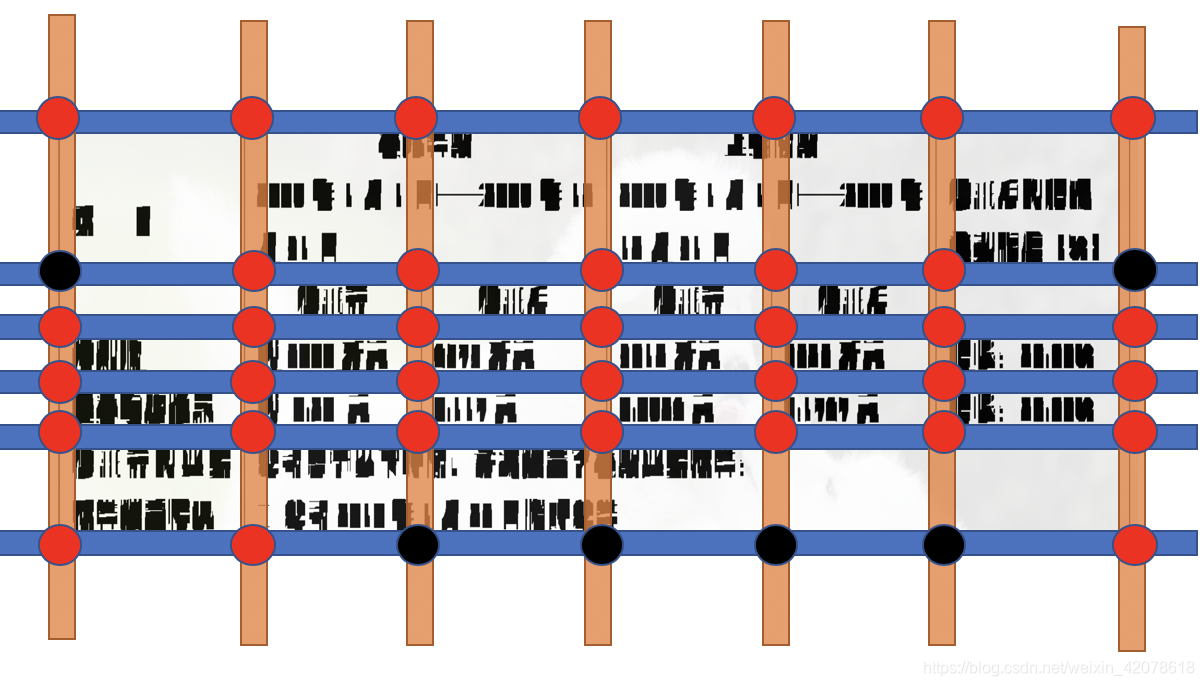
我们会得出所有的直线交点,黑色点是错误的,后面咱们再处理
然后,咱们拼出所有的矩形框的四个坐标点
    # 拼接所有可能的矩形框
    i = 0
    result = []
    while i < len(new_cors) - 1:
        j = i + 1
        while j < len(new_cors):
            new_lis1, new_lis2 = combine(new_cors[i], new_cors[j])
            j += 1
            # y轴排列组合
            for ii in new_lis1:
                # x轴排列组合
                for jj in new_lis2:
                    if judge(ii, jj):
                        result.append([ii[0], ii[1], jj[0], jj[1], area([ii[0], ii[1], jj[0], jj[1]])])
        i += 1
(6)iou + nms算法选择单元格
基础思路,从一个单元格开始,计算其余单元格个该单元格的IOU值,大于0.08的视为同一个单元格。使用nms算法,把这些单元格进行剔除。
首先,去除黑点
    next_result = []
    for i in result:
        # (y, x)
        p1, p2, p3, p4, area_ = i
        if p1[1] < 50:
            if (img_add2[p1[0], p1[1] + 1] == 0 or img_add2[p1[0], p1[1] - 1] == 0) and \
                    (img_add2[p3[0], p3[1] + 1] == 0 or img_add2[p3[0], p3[1] - 1] == 0):
                next_result.append([p1, p2, p3, p4, area_])
        else:
            next_result.append([p1, p2, p3, p4, area_])

    result = next_result
其次,iou + nms,nms前我们先排序,保证最小单元格能一定被捕捉到
    result = list(filter(lambda x: x[-1] >= min_anchor_size, result))
    # 根据坐标和单元格面积排序
    result = sorted(result, key=lambda x: (x[0][0], x[0][1], x[-1]))
nms_result = nms(result, [], ratio=ratio)因为一些手撕的逻辑算法都在utils里面,各位移步:https://github.com/yfyvan/table_crop/blob/master/utils.py
(7)异常值处理
接下来最后做一些处理,去除一些异常值(噪音造成的错误框),再去除一些近似值(iou阈值造成的近似框)
    new_result = []
    for i in range(len(nms_result)):
        tmp = list(map(lambda x: x, nms_result[i][:4]))
        # (y1, x1), (y2, x2), (y3, x3), (y4, x4)
        if tmp[1][1] - tmp[0][1] < 40:
            continue
        new_result.append(tmp)

    img = cv2.imread(file_name)
    for i in new_result:
        cv2.rectangle(img, (i[0][1], i[0][0]), (i[-1][1], i[-1][0]), random.choice([(255, 0, 0), (0, 0, 255), (0, 255, 0)]), thickness=3)
    new_result = abno_data_detete(new_result)
    new_result = simi_data_delete(new_result)
(8)图形切割
根据以上生成的各个点的坐标,切割小单元格
    img = cv2.imread(file_name, 0)
    pics = []
    files = []
    index = 0
    if not os.path.exists(data_root + '/' + str(notice_id)):
        os.mkdir(data_root + '/' + str(notice_id))
    file_root = data_root + '/' + str(notice_id)

    for i in anchors:
        index += 1
        img2 = img[i[0][0]:i[2][0], i[0][1]:i[1][1]]
        new_file_name = '%s/%s_%s.png' % (file_root, index, str(i))
        cv2.imwrite(new_file_name, img2)
        pics.append(img2)
        files.append(new_file_name)
OVER
注意几点:
(1)参数调整
a、config.scale2 = 20
这是竖线的scale绝对值,不同的长度的表格这个值不一样,长表格这个值需要大一些,什么80, 100, 都有可能,你可以根据长宽自己拟出一个比例进行动态调整
b、ratio = 0.08
nms判断的阈值,这个有点不好调,表格比较密集的,这个值可以大一些,稀疏的可以小一些0.05-0.3不等
c、min_anchor_size = 10000
这个是最小单元格的阈值,图片的像素值不同,这个值肯定也不同
调优策略:
(1)这是个初版分割方案,有非常多的地方可以调优。比如:动态调整scale值,多处pop以append代替,先剔除异常值在做排序和nms等,都能加速
(2)物体识别走yolo和frcnn会非常非常高地提高准确度,大家可以移步yolo3和frcnn的github。陷于数据标注的成本和缺乏gpu。。。我也很无奈。。。


 512
512

 被折叠的 条评论
为什么被折叠?
被折叠的 条评论
为什么被折叠?
 到【灌水乐园】发言


