


算法学习、4对1辅导、论文辅导、核心期刊
项目的代码和数据下载可以通过公众号滴滴我
文章目录
一、项目背景
空难(air crash),指飞机等在飞行中发生故障、遭遇自然灾害或其他意外事故所造成的灾难。指由于不可抗拒的原因或人为因素造成的飞机失事,并由此带来灾难性的人员伤亡和财产损失。
通常与“空难”意义相同的词汇还有“飞机坠落事件”或“坠机事件”。汉语中对各种飞行器包括各种载人航空飞行器在起飞、飞行或降落过程中,由于人为因素或不可抗拒的原因导致的灾难性损失,对此类事件统称为空难,如对美国哥伦比亚号航天飞机的失事有时称为“哥伦比亚空难”。
二、数据说明
该数据集共超过2w条数据,共8个字段。
| 字段 | 说明 |
|---|---|
| Country | 海洋/国家 |
| date | 日期 |
| Air-craft type | 航空器类型 |
| registration name/mark | 注册名称/标志 |
| operator | 航空公司 |
| fatilites | 生命的损失 |
| location | 位置 |
| category | 事故类别 |
Tips:在category事故类别中,又分为
- A=事故
- I =事件
- H =劫持
- C =犯罪事件(破坏、击落)
- O=其他事件(地面火灾,破坏)
- U=发生类型未知
- 1 =一起全损
- 2 =可修复的损坏
三、数据分析
1、读取数据科学库
import json
import datetime
import random
import pandas as pd
import numpy as np
from pyecharts.charts import *
import pyecharts.options as opts
from pyecharts.commons.utils import JsCode
import warnings
warnings.filterwarnings('ignore')

from pylab import mpl
mpl.rcParams["font.sans-serif"] = ["SimHei"] # 设置显示中文字体 宋体
mpl.rcParams["axes.unicode_minus"] = False #字体更改后,会导致坐标轴中的部分字符无法正常显示,此时需要设置正常显示负号
2、数据读取及预处理
## 数据读取
df = pd.read_csv('aviation_accidents in countries - aviation_accidents.csv')
## 统计伤亡人数
df['casualties'] = df['fatilites'].map(lambda x:eval(x) if str(type(x)) == "<class 'str'>" else x)
## 时间处理
df['date'] = df['date'].map(lambda x:x.title() if str(type(x)) == "<class 'str'>" else x)
## 读取symbol数据
with open("symbol.json", "r", encoding="utf-8") as f:
    symbols = json.load(f)
3、各国历史空难发生次数分布图
## 部分国家名标准化
c_name_map = {'USA':'United States','Congo (former Zaire)':'Congo','South Sudan':'Sudan','U.S. Minor Outlying Islands':\
    'United States','South Korea':'Korea (South)','Virgin Islands (U.S.)':'United States','Czech Republic':'Czech','Dominican Republic':'Dominica',\
    'Eswatini':'Swaziland',"Cote d'Ivoire":'Cote D’Ivoire','St. Kitts and Nevis':'Saint Kitts-Nevis','North Korea':'Korea (North)',\
    'Macedonia (FYROM)':'Macedonia','Cayman Islands':'United Kingdom','British Virgin Islands':'United Kingdom','French Guiana':'Franch Guiana',\
    'Northern Mariana Islands':'United States','East Timor':'Timor-Leste','Sint Maarten':''}
df['Country'] = df['Country'].replace(c_name_map)
tmp = df['Country'].value_counts().reset_index()
attr = tmp['index'].tolist()
values = tmp['Country'].tolist()
map_= (
    Map(init_opts=opts.InitOpts(width='980px'))
    .add("总数",
        [list(z) for z in zip(attr, values)],
        "world",
        is_map_symbol_show=False,
        is_roam=False,
        itemstyle_opts={
            "borderColor": '#FFFFFF',
            "borderWidth": 1,}
        )
    .set_series_opts(
        label_opts=opts.LabelOpts(
            is_show=False)
        )
    .set_global_opts(
        title_opts=opts.TitleOpts(
            title="Distribution of historical air crashes in various countries",
            subtitle='1919-2022',
            pos_left='center',
            title_textstyle_opts=opts.TextStyleOpts(
                font_family='Adobe',
                font_size=22,
                font_weight='lighter'
                )
            ),
        visualmap_opts=opts.VisualMapOpts(
            max_=4500,
            pos_bottom='12%',
            pos_left='10%',
            range_text=['空难次数', ''],
            ),
        legend_opts=opts.LegendOpts(
            is_show=False
            ),
        )
    )
tmp = df['Country'].value_counts().head(3)
p = (PictorialBar(init_opts=opts.InitOpts(width='980px',height='250px',theme='light'))
    .add_xaxis(tmp.index.tolist()[::-1])
    .add_yaxis(
        "",
        tmp.values.tolist()[::-1],
        label_opts=opts.LabelOpts(is_show=False),
        symbol_size=22,
        symbol_repeat="fixed",
        symbol_offset=[0, 0],
        is_symbol_clip=True,
        symbol=symbols['plane'],
    )
    .set_series_opts(
        label_opts=opts.LabelOpts(
            is_show=False,
        ),
        itemstyle_opts=opts.ItemStyleOpts(
            border_color='#5C3719',
        )
    )
    .set_global_opts(
        title_opts=opts.TitleOpts(
            title='Top 3 countries with the largest number of air crashes in history',
            subtitle='1919-2022',
            pos_left='center',
            title_textstyle_opts=opts.TextStyleOpts(
                font_family='Adobe',
                font_weight='lighter',
                font_size=22,
            ),
            pos_top='1%'
        ),
        legend_opts=opts.LegendOpts(
            is_show=False
        ),
        xaxis_opts=opts.AxisOpts(
            is_show=False,
            max_=int(tmp.values.max())
        ),
        yaxis_opts=opts.AxisOpts(
            axisline_opts=opts.AxisLineOpts(
                is_show=False,
            ),
            axistick_opts=opts.AxisTickOpts(
                is_show=False
            ),
            axislabel_opts=opts.LabelOpts(
                font_family='Adobe',
                font_weight='lighter',
                font_size='11'
            )
        ),
        tooltip_opts=opts.TooltipOpts(
            is_show=True,
            trigger='axis',
            trigger_on='mousemove|clike',
            axis_pointer_type='shadow',
        )
    )
    .reversal_axis()
)
page = Page()
page.add(map_,p)
page.render_notebook()
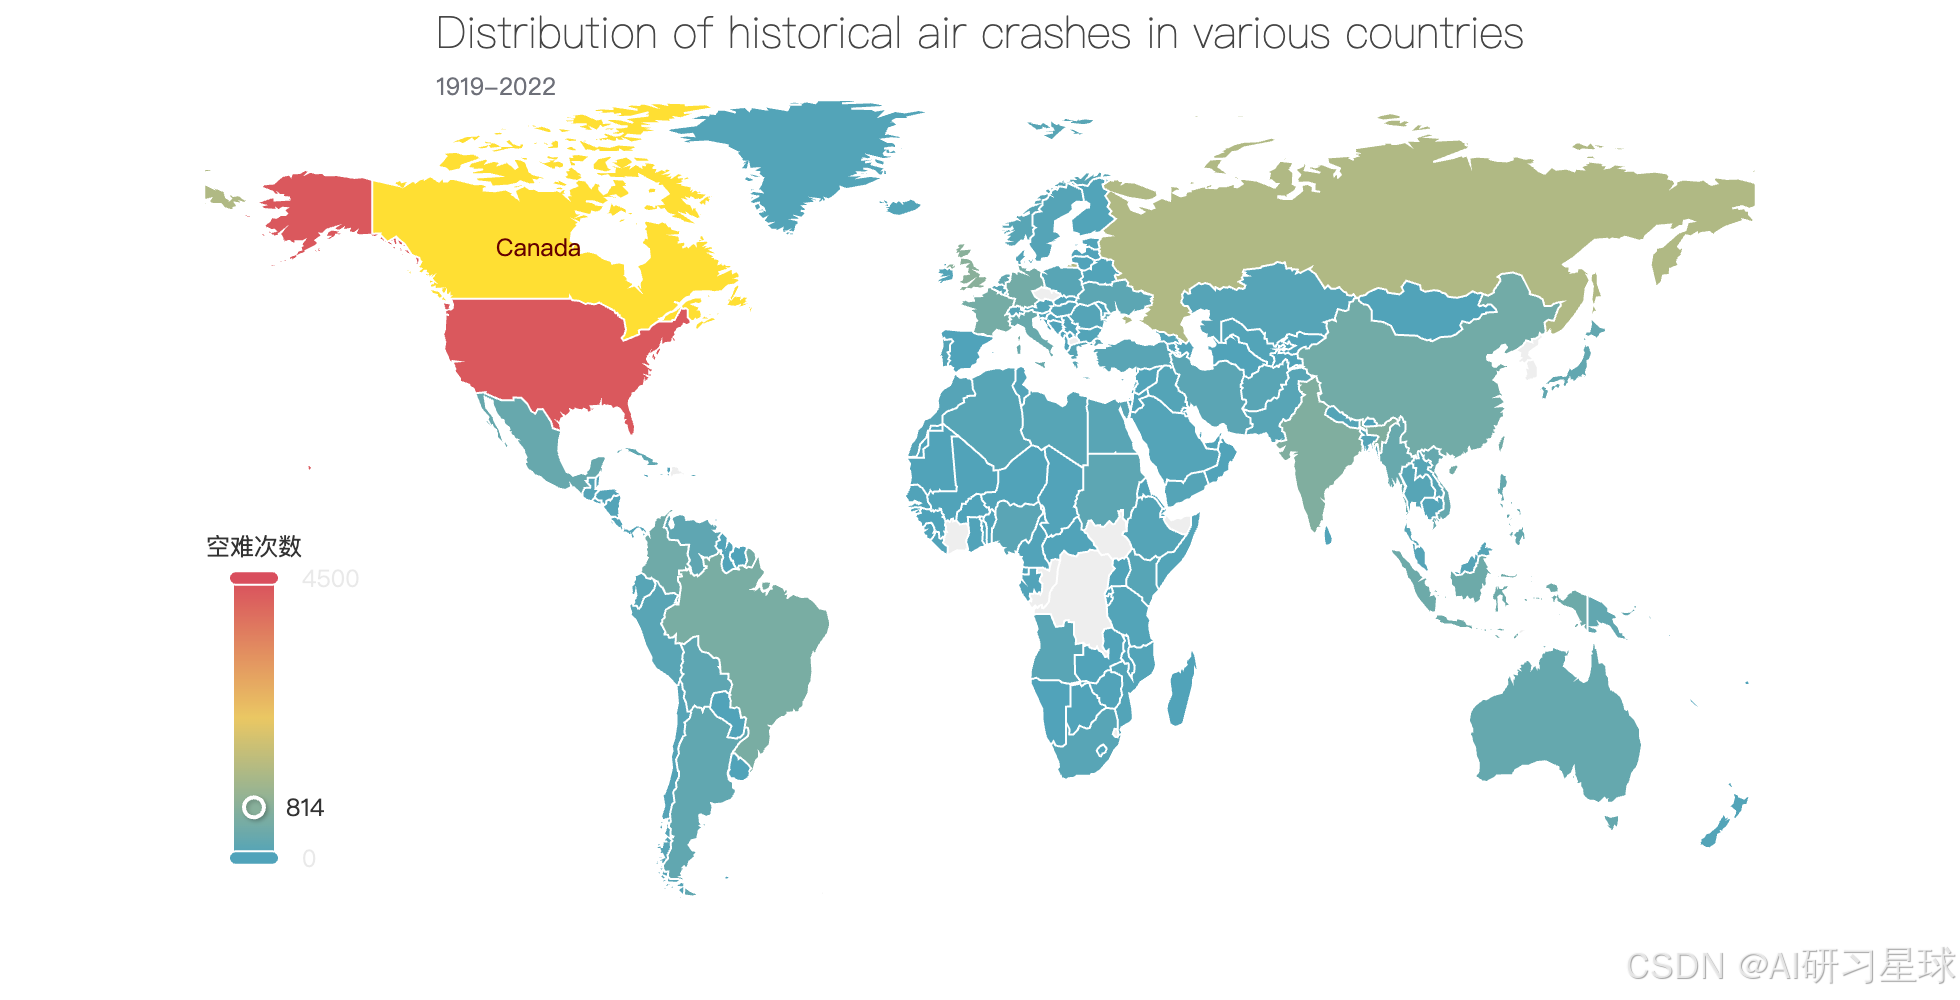
总结:
历史上发生空难最多的国家是美国,高达4320次,其次是俄罗斯及英国,分别有1405次及838次
截至当前,我国共发生了504次空难
4、1919年-2022年历史空难发生次数年变化趋势
df['date_year'] = df['date'].map(lambda x:x[-4:] if str(type(x)) == "<class 'str'>" else x)
df['date_month'] = df['date'].map(lambda x:x[3:6] if str(type(x)) == "<class 'str'>" else x)
df['date_day'] = df['date'].map(lambda x:x[:2] if str(type(x)) == "<class 'str'>" else x)
month_map = {'Jan':'01','Feb':'02','Mar':'03','Apr':'04','May':'05','Jun':'06','Jul':'07',
        'Aug':'08','Sep':'09','Oct':'10','Nov':'11','Dec':'12','???':np.nan,'e U':np.nan}
df['date_month'] = df['date_month'].map(month_map)
tmp = df['date_year'].value_counts().reset_index()
tmp = tmp.sort_values('index')
tmp.drop(tmp.index[(tmp['index'] == 'unk.')],inplace=True)
## LineStyle
line_style = {
    'normal': {
        'width': 4,
        'shadowColor': 'rgba(155, 18, 184, .3)',
        'shadowBlur': 10,
        'shadowOffsetY': 10,
        'shadowOffsetX': 10,
        'curve': 0.5
    }
}

line = (Line(init_opts=opts.InitOpts(theme='light',width='1100px'))
    .add_xaxis(tmp['index'].tolist())
    .add_yaxis('Number of air crashes',
        tmp['date_year'].tolist(),
        is_smooth=True,
        is_symbol_show=False,
        linestyle_opts=line_style
    )
    .set_series_opts(
        label_opts=opts.LabelOpts(
            is_show = False,
        ),
        markpoint_opts=opts.MarkPointOpts(
            data=[
                opts.MarkPointItem(type_="max", name="最大值", symbol=symbols['plane']),
            ]),
        markline_opts=opts.MarkLineOpts(
            data=[
                opts.MarkLineItem(type_="average", name="平均值")
            ])
    )
    .set_global_opts(
        title_opts=opts.TitleOpts(
            title = 'Change trend of air crash number from 1919 to 2022',
            subtitle = 'Only the data of the exact date is counted',
            pos_left = 'center',
            title_textstyle_opts=opts.TextStyleOpts(
                font_family='Adobe',
                font_size=22,
                font_weight='lighter'
            )
        ),
        legend_opts=opts.LegendOpts(
            pos_top = '12%',
            legend_icon = 'circle'
        ),
        xaxis_opts=opts.AxisOpts(
            axislabel_opts={'rotate':90},
            axisline_opts=opts.AxisLineOpts(
                is_show=False
            ),
        ),
        yaxis_opts=opts.AxisOpts(
            name='Number of air crashes',
            axisline_opts=opts.AxisLineOpts(
                is_show=False
            ),
            splitline_opts=opts.SplitLineOpts(
                is_show=True
            )
        ),
        tooltip_opts=opts.TooltipOpts(
            is_show = True,
            trigger = 'axis',
            trigger_on = 'mousemove|click',
            axis_pointer_type = 'shadow'
        ),
    )
)
line.render_notebook()
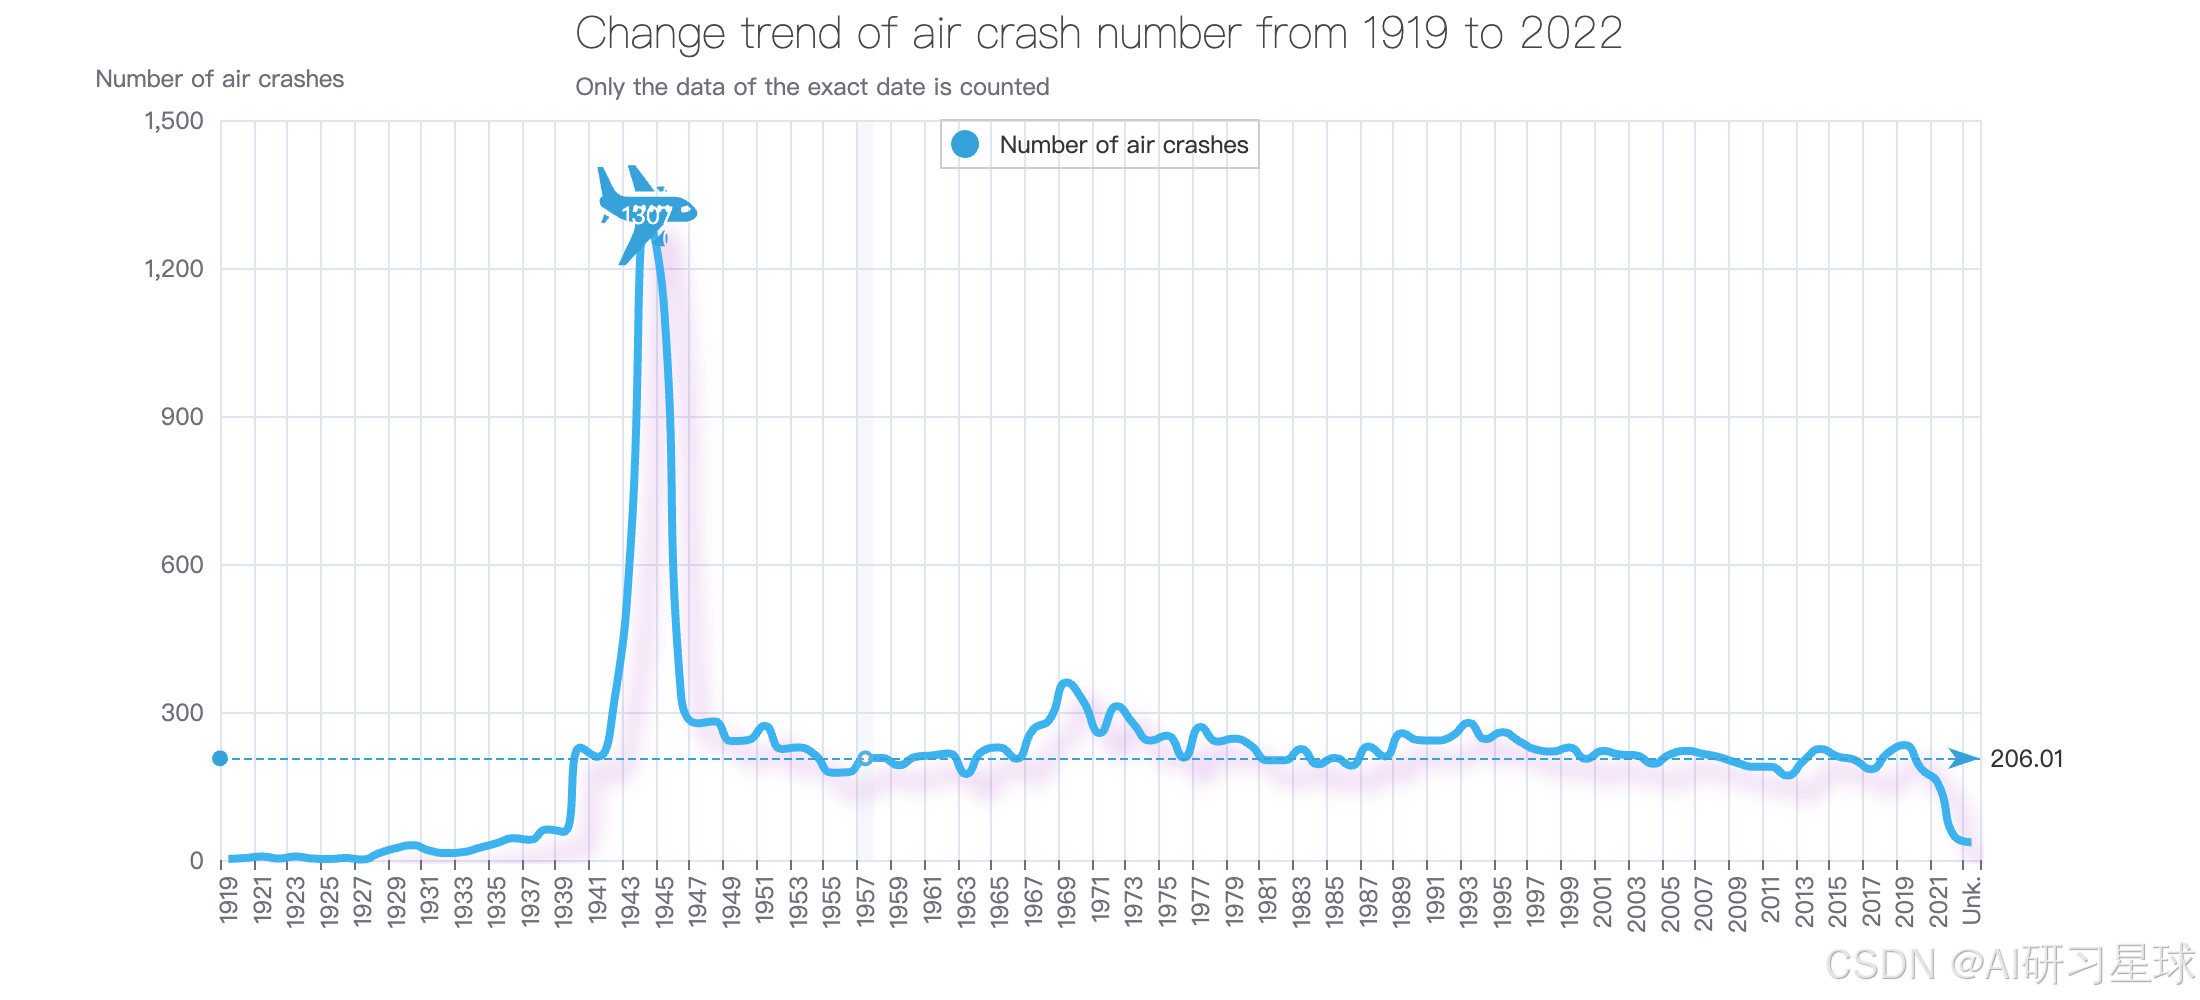
总结:
1944年发生的空难次数高达1307次,此后发生空难的次数年变化趋势较为平缓
1919-2022年共103年间平均每年发生空难次数有206次
5、历史上空难致使伤亡人数Top10
tmp = df.dropna(subset=['casualties'])
tmp = tmp.sort_values('casualties',ascending=False)
tmp1 = tmp.head(10)
tmp1 = tmp.head(10)
p = (PictorialBar(init_opts=opts.InitOpts(height='550px',theme='light'))
    .add_xaxis(tmp1['date'].tolist()[::-1])
    .add_yaxis(
        "",
        tmp1['casualties'].tolist()[::-1],
        label_opts=opts.LabelOpts(is_show=False),
        symbol_size=22,
        symbol_repeat="fixed",
        symbol_offset=[0, 0],
        is_symbol_clip=True,
        symbol=symbols['plane'],
    )
    .set_series_opts(
        label_opts=opts.LabelOpts(
            is_show=False,
        ),
        itemstyle_opts=opts.ItemStyleOpts(
            border_color='#5C3719',
        )
    )
    .set_global_opts(
        title_opts=opts.TitleOpts(
            title='Top 10 countries with the largest number of air crash casualties in history',
            subtitle='1919-2022',
            title_textstyle_opts=opts.TextStyleOpts(
                font_family='Adobe',
                font_weight='lighter',
                font_size=22,
            ),
            pos_top='1%'
        ),
        legend_opts=opts.LegendOpts(
            is_show=False
        ),
        xaxis_opts=opts.AxisOpts(
            is_show=False,
            max_=int(tmp1['casualties'].max())
        ),
        yaxis_opts=opts.AxisOpts(
            axisline_opts=opts.AxisLineOpts(
                is_show=False,
            ),
            axistick_opts=opts.AxisTickOpts(
                is_show=False
            ),
            axislabel_opts=opts.LabelOpts(
                font_family='Adobe',
                font_weight='lighter',
                font_size='14'
            )
        ),
        tooltip_opts=opts.TooltipOpts(
            is_show=True,
            trigger='axis',
            trigger_on='mousemove|clike',
            axis_pointer_type='shadow',
        )
    )
    .reversal_axis()
)
p.render_notebook()
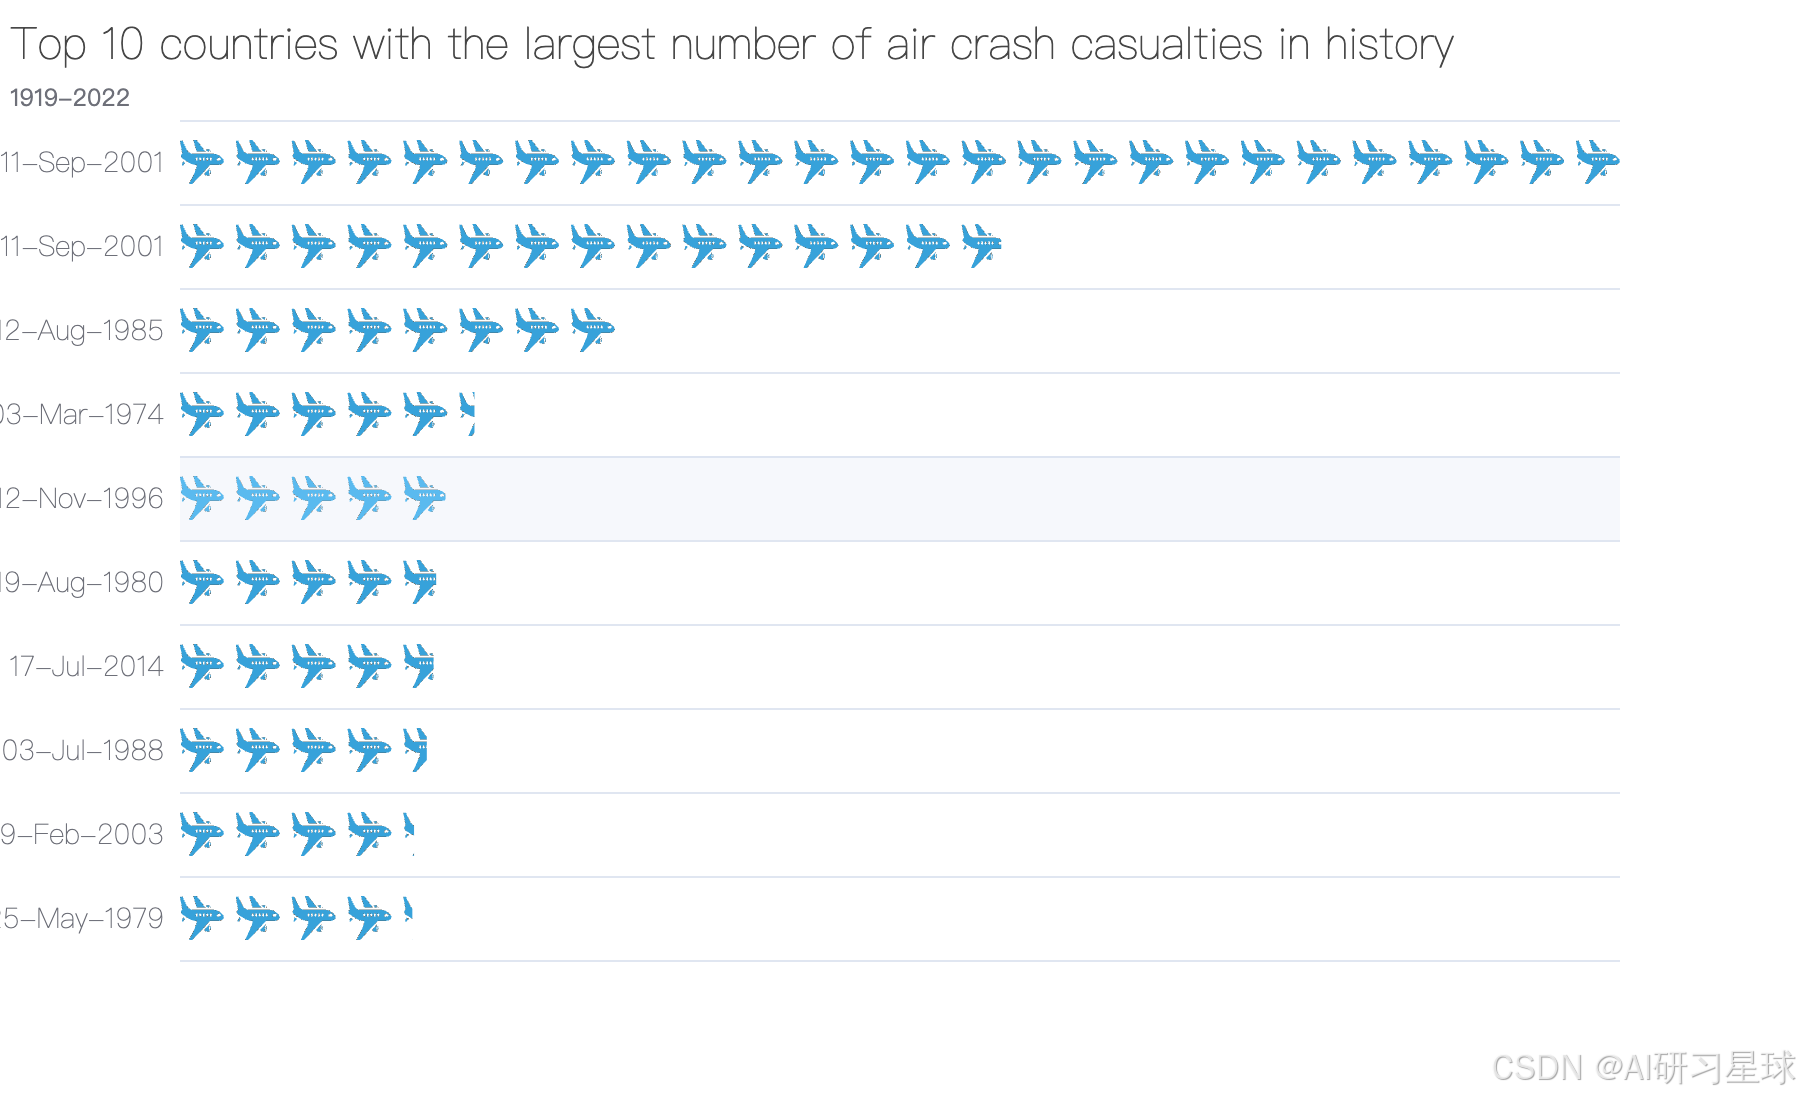
总结:
历史上空难致使伤亡人数最多的一次发生在11-Sep-2001,共有1692人受伤遇难
6、历史空难中不同类型空难损失程度的占比
df['Accident_type'] = df['category'].map(lambda x:x[0] if str(type(x)) == "<class 'str'>" else x)
df['Casualty_type'] = df['category'].map(lambda x:x[1] if str(type(x)) == "<class 'str'>" else x)
Acc_map = {'A':'事故','I':'事件','H':'劫持','C':'犯罪事件','O':'其他事件','U':'未知类型'}
Cas_map = {'1':'全损','2':'可修复'}
df['Accident_type'] = df['Accident_type'].map(Acc_map)
df['Casualty_type'] = df['Casualty_type'].map(Cas_map)
tmp = df.dropna(subset=['category'])
tmp1 = tmp.groupby(['Accident_type','Casualty_type']).agg({'Country':'count'}).reset_index()
tmp1.columns = ['Accident_type','Casualty_type','Count']
rich={
    "a": {"color": "#999", "fontSize":14, "lineHeight": 22, "align": "center"},
    "abg": {
        "backgroundColor": "#e3e3e3",
        "width": "100%",
        "align": "right",
        "height": 28,
        "borderRadius": [4, 4, 0, 0],
    },
    "hr": {
        "borderColor": "#aaa",
        "width": "100%",
        "borderWidth": 0.5,
        "height": 0,
    },
    "b": {"fontSize": 16, "lineHeight": 33},
    "per": {
        "color": "#eee",
        "backgroundColor": "#334455",
        "padding": [2, 4],
        "borderRadius": 2,
    },
    "c": {"align": "right","fontSize":12}
}
tmp2 = tmp1.query('Accident_type == "事故"')
label = tmp2['Casualty_type'].tolist()
value = tmp2['Count'].tolist()
pie = (Pie(init_opts=opts.InitOpts(theme='light',height='400px',width='980px'))
    .add('',[list(z) for z in zip(label,value)],radius=['50%','65%'],center=['25%','60%'])
    .set_series_opts(
        label_opts=opts.LabelOpts(
            is_show=True,
            formatter="{a|{b}}{abg|}\n {hr|}\n {c|{c}例\n 占比{d}%} ",
            rich=rich
        ),
        itemstyle_opts=opts.ItemStyleOpts(
            border_color='#000',
            border_width=2
        )
    )
    .set_global_opts(
        legend_opts=opts.LegendOpts(
            is_show=False
        )
    )
)
tmp2 = tmp1.query('Accident_type != "事故"')
data = []
item = []
for idx, row in tmp2.iterrows():
    if row['Accident_type'] in item:
        data[-1]['children'].append(dict(name=row['Casualty_type'], value=row['Count']))
    else:
        data.append(dict(name=row['Accident_type'], children=[dict(name=row['Casualty_type'], value=row['Count'])]))
    item.append(row['Accident_type'])
sunburst = (Sunburst(init_opts=opts.InitOpts(theme='light'))
    .add("",
        data_pair=data,
        radius=["50%", "80%"],
        center=["75%", "60%"],
        levels=[
            {},
            {
                "r0": "0%",
                "r": "45%",
                "itemStyle": {"borderColor":"white","borderWidth": 2},
            },
            {
                "r0": "45%",
                "r": "65%",
                "label": {"rotate": "tangential","padding": 3, "silent": False,},
                "itemStyle": {"borderColor":"white","borderWidth": 3},
            },
        ],
    )
    .set_series_opts(
        label_opts=opts.LabelOpts(
            formatter='{b}:{c}例',
            position='inner',
        )
    )
    .set_global_opts(
        title_opts=opts.TitleOpts(
            title='Proportion of loss degree of different types of air crashes in historical air crashes from 1919 to 2022',
            subtitle='Accident[left]、Non accident[right]',
            pos_left='center',
            pos_top='4%',
            title_textstyle_opts=opts.TextStyleOpts(
                font_family='Adobe',
                font_size=20,
                font_weight='lighter'
            )
        ),
        legend_opts=opts.LegendOpts(
            is_show=True
            ),
    )
)
grid = Grid(init_opts=opts.InitOpts(theme='light',width='980px'))
grid.add(pie,grid_opts=opts.GridOpts(pos_left='10%'))
grid.add(sunburst,grid_opts=opts.GridOpts(pos_right='10%'))
grid.render_notebook()
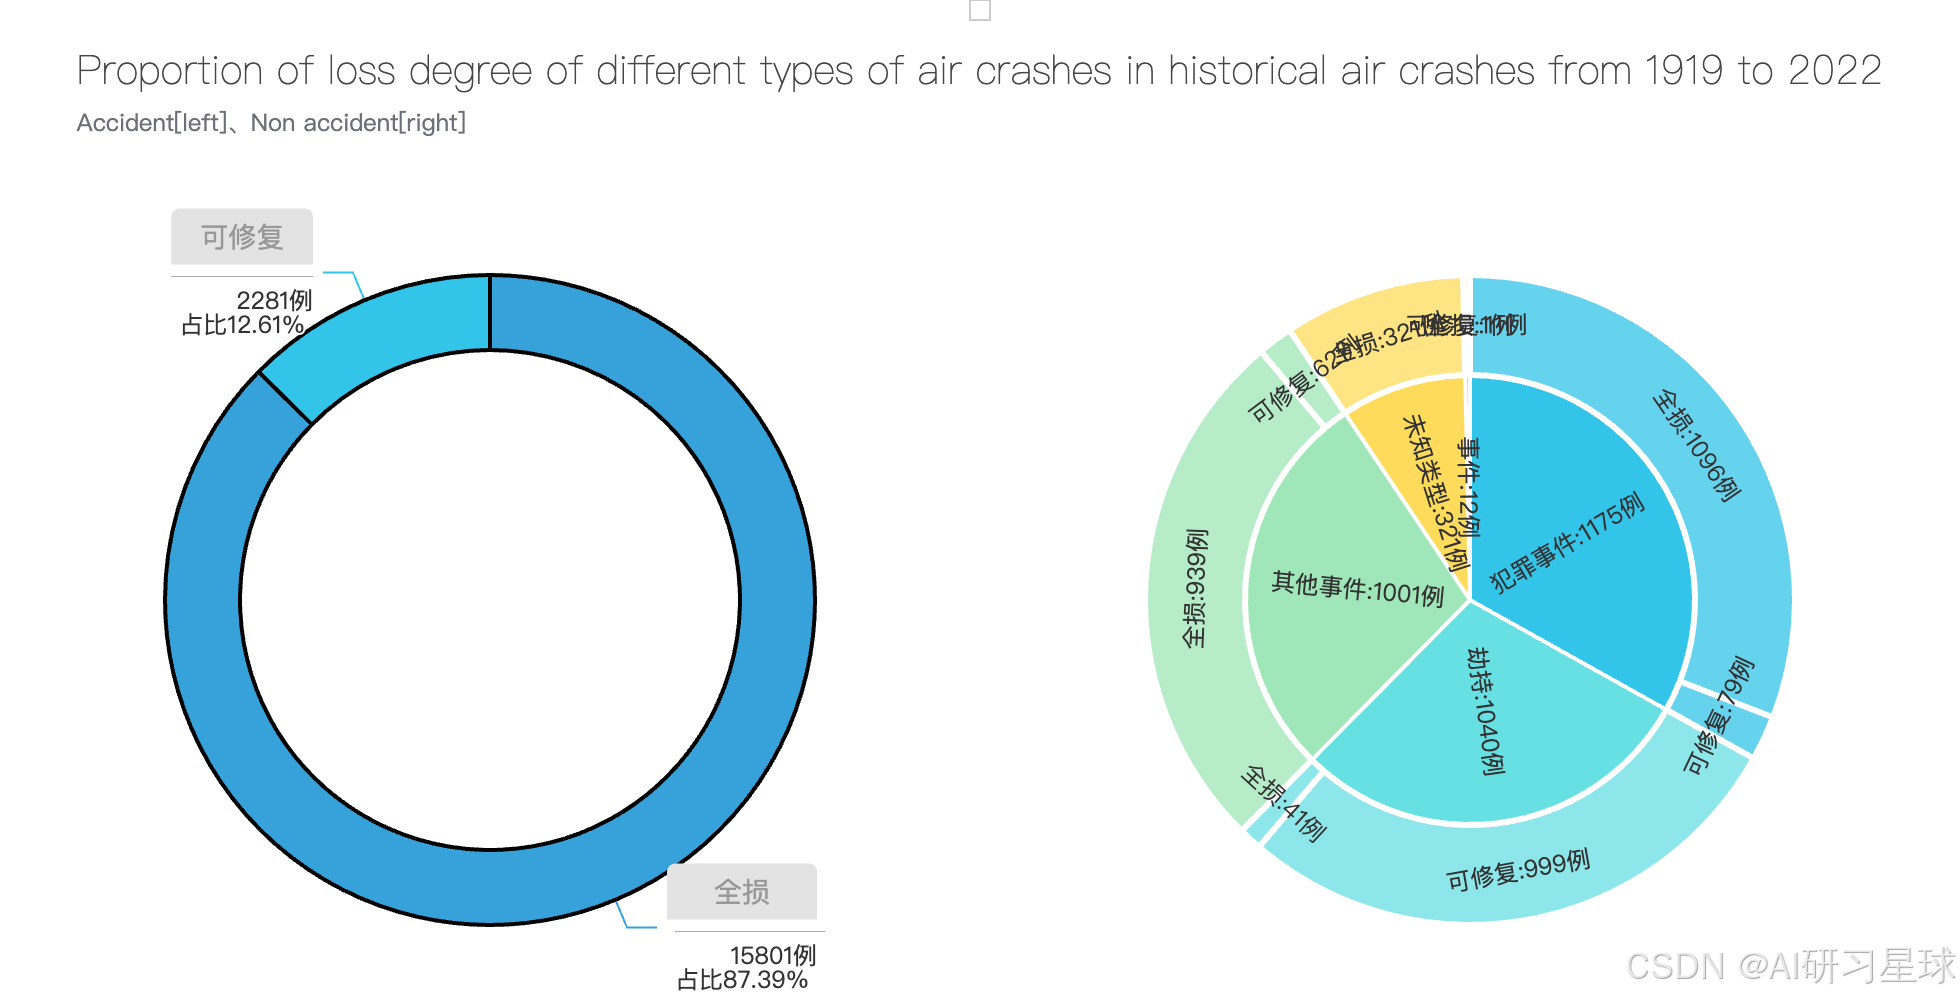
总结:
事故型空难中全损的空难次数占绝大多数,占比达到87.39%
非事故型空难中犯罪事件类型的空难更多,达到1175次
所有的空难事件中导致飞机全损的事件更多
7、历史空难中遇难飞机数量所属航空公司Top10
df['Airline_company'] = df['Air-craft type'].map(lambda x:x.split(' ')[0] if str(type(x)) == "<class 'str'>" else x)
top_company = df['Airline_company'].value_counts().head(10).index.tolist()
tmp = df.query('Airline_company in '+str(top_company))
tmp1 = tmp.groupby(['Airline_company','Air-craft type']).agg({'Country':'count'}).reset_index()
tmp1.columns = ['Airline_company','Air-craft type','Count']
data = []
item = []
for idx, row in tmp1.iterrows():
    if row['Airline_company'] in item:
        data[-1]['children'].append(dict(name=row['Air-craft type'], value=row['Count']))
    else:
        data.append(dict(name=row['Airline_company'], children=[dict(name=row['Air-craft type'], value=row['Count'])]))
    item.append(row['Airline_company'])
tree = TreeMap(
    init_opts=opts.InitOpts(
        theme='light',
        width='980px',
        height='600px',
        ))
tree.add(
    "Airline company",
    data,
    leaf_depth=1,
    roam=False,
    label_opts=opts.LabelOpts(position="inside", formatter='{b}: {c}例'),
    levels=[
            opts.TreeMapLevelsOpts(
                treemap_itemstyle_opts=opts.TreeMapItemStyleOpts(
                    border_color="white", border_width=4, gap_width=4
                )
            ),
            opts.TreeMapLevelsOpts(
                color_saturation=[0.8, 0.5],
                treemap_itemstyle_opts=opts.TreeMapItemStyleOpts(
                    border_color="white",border_color_saturation=0.7, gap_width=4, border_width=8
                ),
            )
        ],
    )
tree.set_global_opts(
    title_opts=opts.TitleOpts(
        title="Number of aircraft killed top 10 airlines from 1919 to 2022",
        subtitle = 'Click enter to view the aircraft types of each airline',
        pos_left='center',
        title_textstyle_opts=opts.TextStyleOpts(
            font_size=22,
            font_family='Adobe',
            font_weight='lighter'
            ),
            pos_top='1%'
        ),
    legend_opts=opts.LegendOpts(
        is_show=False
        )
)
tree.render_notebook()
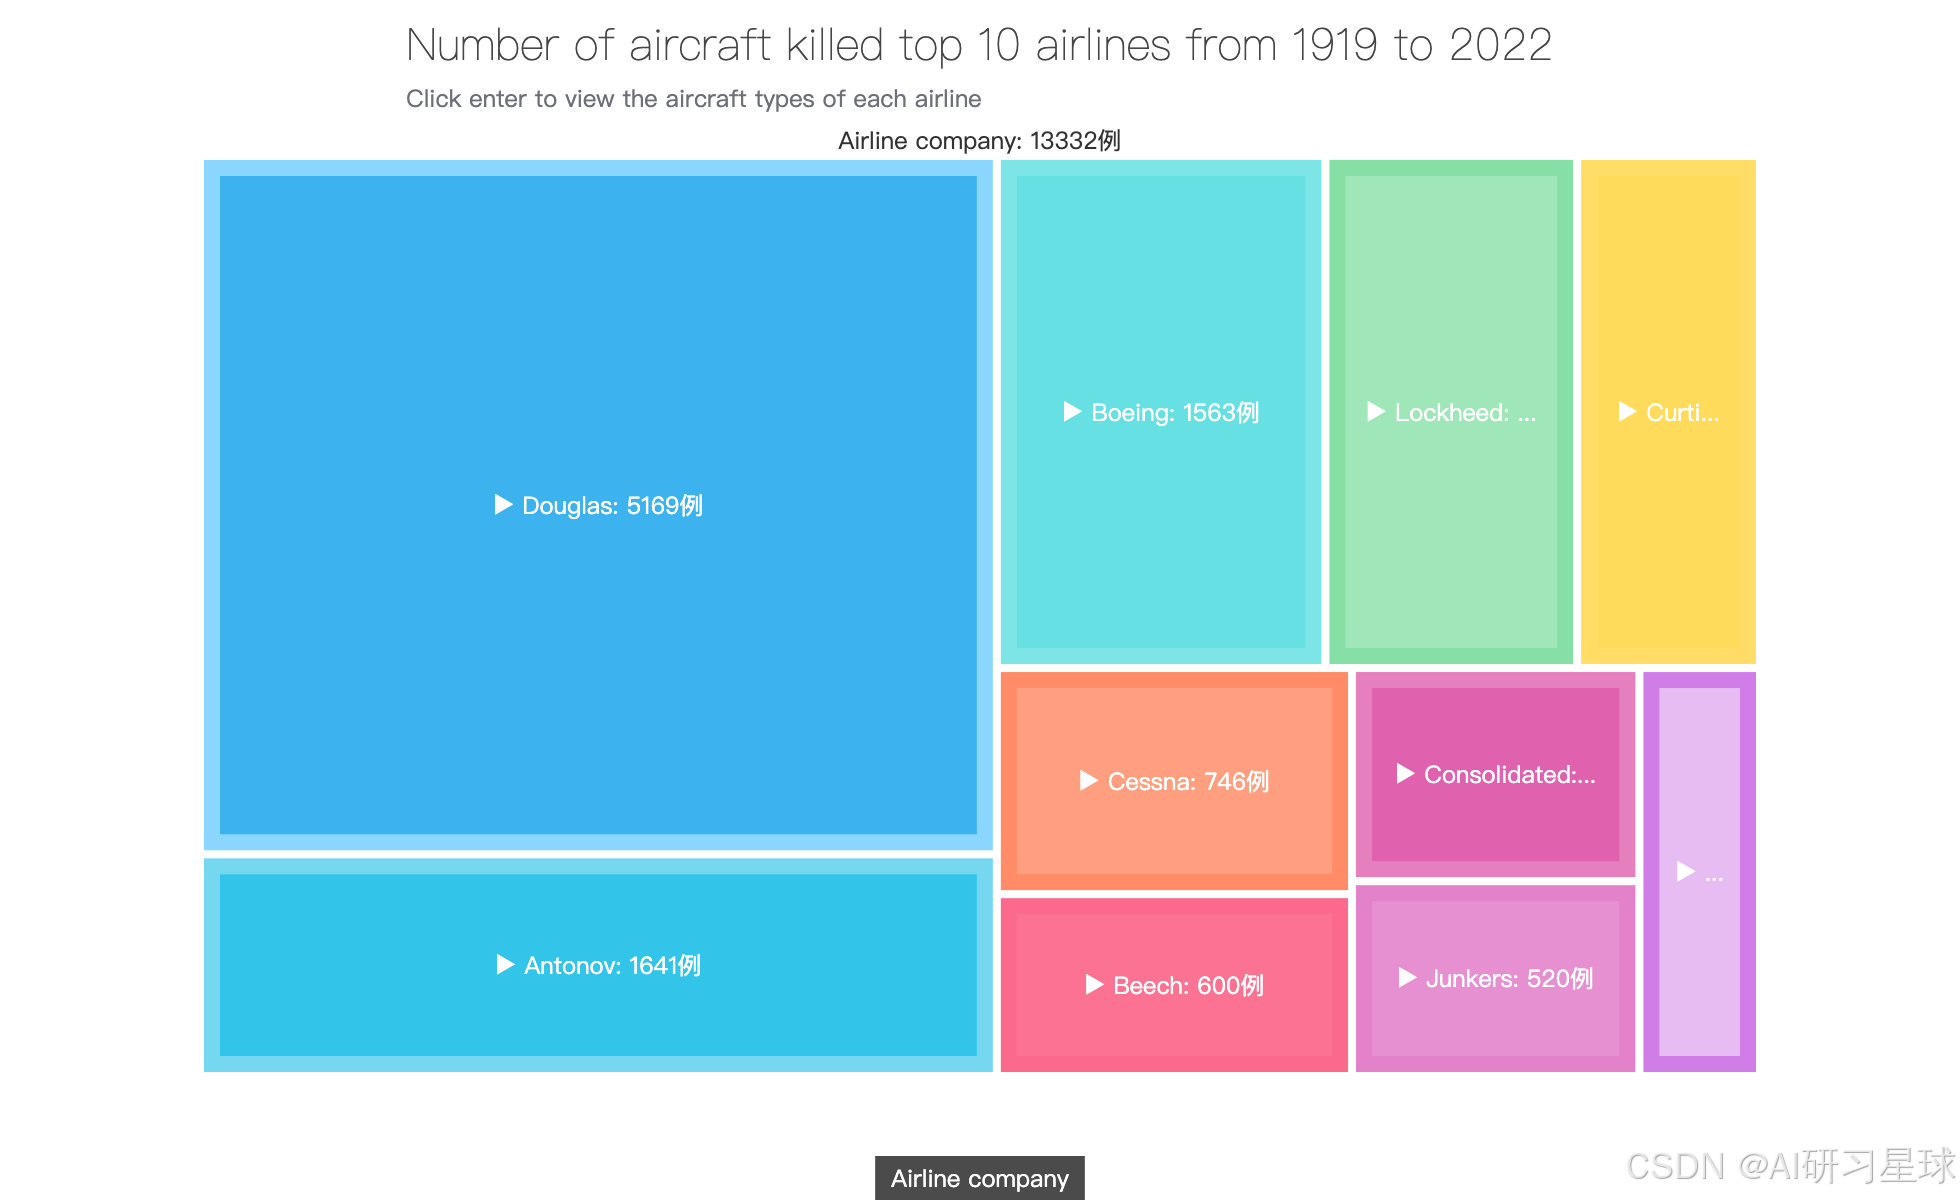
总结:
Douglas飞机公司的飞机发生事故的次数最多,其Douglas C-47A(DC-3)机型发生事故次数占其比例最大
其次是Antonov航空公司,次数达到1641次,其中Antonov An-2R机型发生事故占其比例最大
8、历史空难飞机运营商所属部分Top5
tmp1 = df['operator'].value_counts().head(5)
attrs = tmp1.index.tolist()[::-1]
value = tmp1.values.tolist()[::-1]
polar = (
    Polar(init_opts=opts.InitOpts(width='980px'))
    .add_schema(
        radiusaxis_opts=opts.RadiusAxisOpts(
            data=attrs,
            type_="category",
            axisline_opts=opts.AxisLineOpts(
                is_show=False
                ),
            axistick_opts=opts.AxisTickOpts(
                is_show=False
                ),
            axislabel_opts=opts.LabelOpts(
                font_family='Adobe',
                font_size=12,
                rotate='45',
                )
            ),
        angleaxis_opts=opts.AngleAxisOpts(
            is_clockwise=True,
            is_scale=True,
            max_=2500,
            axislabel_opts=opts.LabelOpts(
                font_size=14,
                font_family='Adobe',
                font_weight='lighter'
                ),
            axisline_opts=opts.AxisLineOpts(
                is_show=True,
                linestyle_opts=opts.LineStyleOpts(
                    width=2,
                    type_='dashed',)
                ),
             splitline_opts=opts.SplitLineOpts(
                is_show=True,
                linestyle_opts=opts.LineStyleOpts(
                    type_='dashed',
                    color='blue')
                )
            ),
    )
    .add("", value, type_='bar')
    .set_series_opts(
        label_opts=opts.LabelOpts(
            position='outside',
        ),
    )
    .set_global_opts(
        title_opts=opts.TitleOpts(
            title='Top 5 departments of historical air crash aircraft operators',
            subtitle='1919-2022',
            title_textstyle_opts=opts.TextStyleOpts(
                font_family='Adobe',
                font_weight='lighter',
                font_size=22,
            ),
        ),
        visualmap_opts=opts.VisualMapOpts(
            is_show=False,
            max_=2100,
            min_=350,
            split_number=8,
            dimension=1,
            range_color=['#5dbe8a','#00704a']
        )
    )
)

polar.render_notebook()
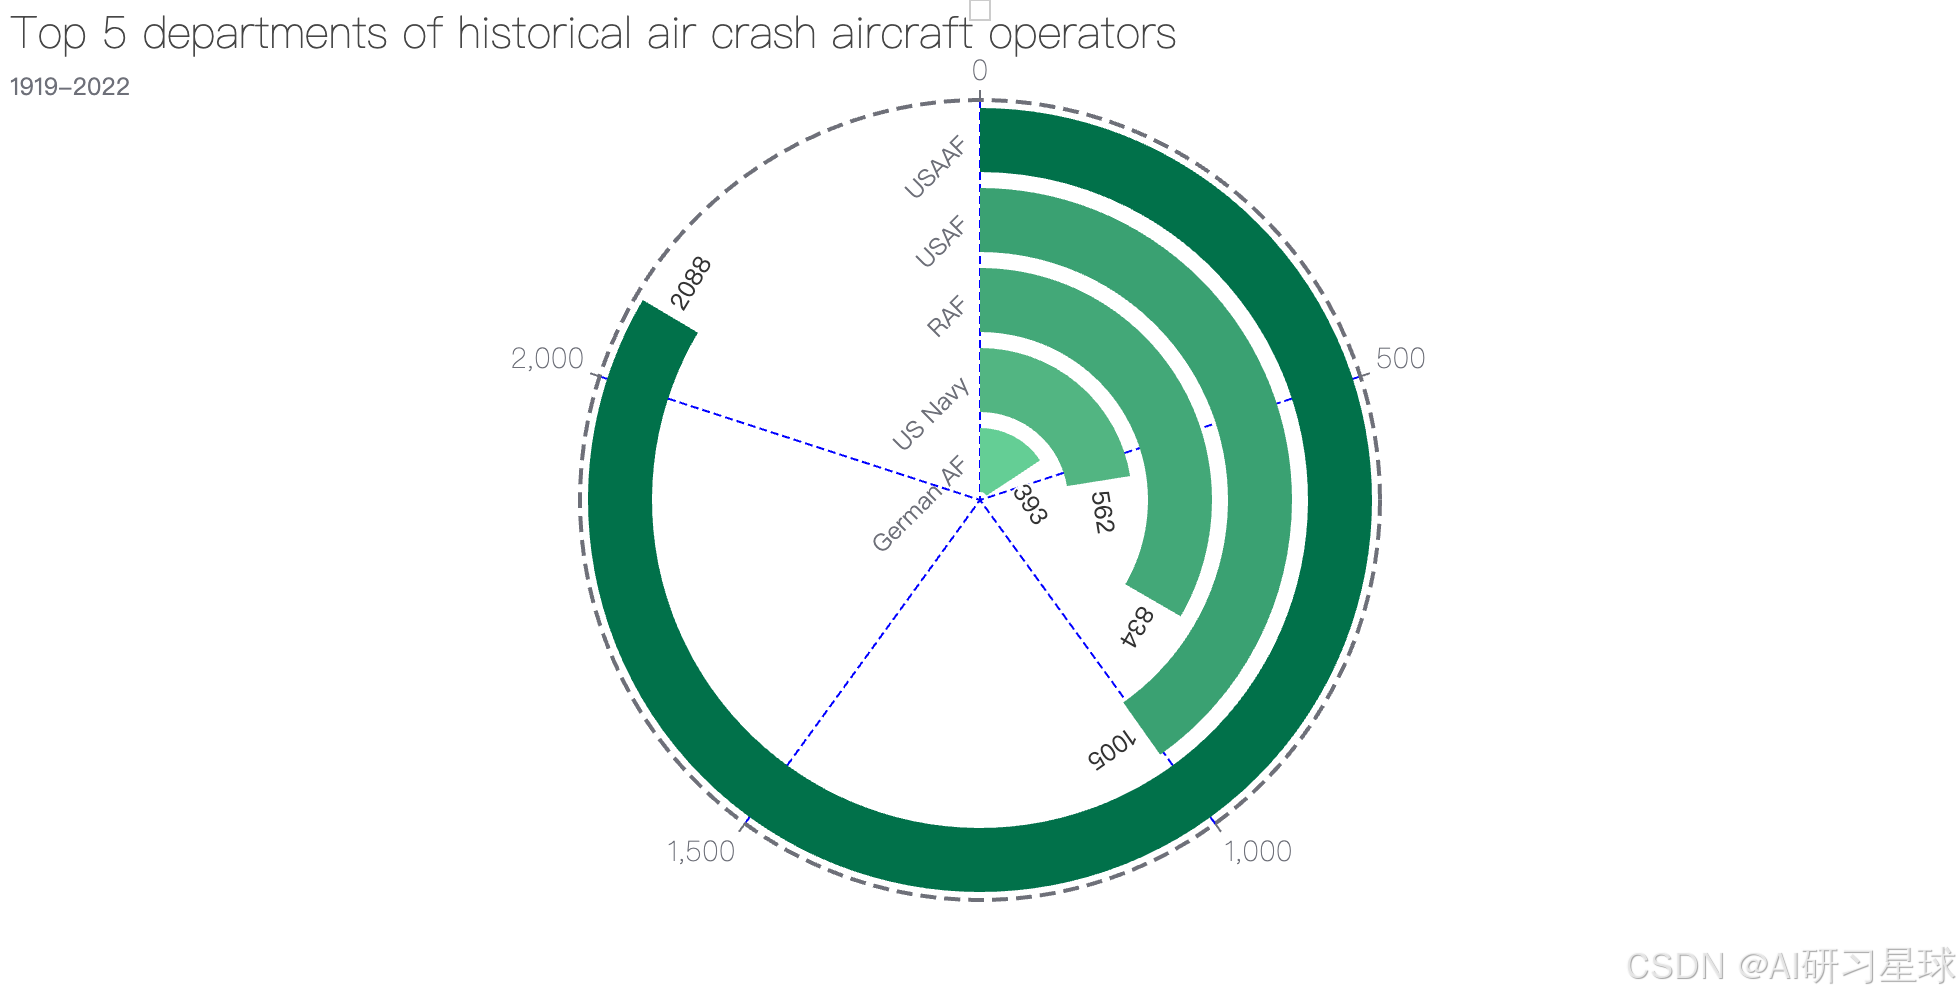
总结:
发生事故次数的飞机所属运营部门的Top5分别为USAAF、USAF、RAF、US Navy以及German AF
9、2021年每日发生空难的次数分布日历图
df_t = df.dropna(subset=['date'])
df_t['date'] = df_t['date_year']+'-'+df_t['date_month']+'-'+df_t['date_day']

tmp1 = df_t.query('date_year == "2021"')
tmp2 = tmp1.groupby(tmp1['date'])['casualties'].count().to_frame('num').reset_index()
#tmp1['date'] = tmp1['date'].map(lambda x:pd.to_datetime(x))

begin = datetime.date(2021, 1, 1)
end = datetime.date(2021, 12, 31)
date_data = []
for i in range((end - begin).days + 1):
    date_data.append(str(begin + datetime.timedelta(days=i)))
tmp3 = pd.DataFrame(date_data,columns=['date'])

tmp = tmp3.merge(tmp2,how='outer')
tmp.fillna(0,inplace=True)
del tmp1,tmp2,tmp3

data = []
for idx,row in tmp.iterrows():
    data1 = []
    data1.append(row['date'])
    data1.append(row['num'])
    data.append(data1)
c = (
    Calendar(init_opts=opts.InitOpts(height='250px',width='980px'))
    .add("", data, calendar_opts=opts.CalendarOpts(range_="2021"))
    .set_global_opts(
        title_opts=opts.TitleOpts(
            title="Number of air crashes on global air crash day in 2021",
            title_textstyle_opts=opts.TextStyleOpts(
                font_family='Adobe',
                font_weight='lighter',
                font_size=22,
            ),
            pos_top='1%'
        ),
        visualmap_opts=opts.VisualMapOpts(
            orient="horizontal",
            is_piecewise=True,
            pieces=[
                {"min": 4, "max": 4,},
                {"min": 3, "max": 3},
                {"min": 2, "max": 2},
                {"min": 1, "max": 1,},
                {"min": 0, "max": 0,},
            ],
            pos_left='65%',
            pos_top='2%'
        ),
    )
)
c.render_notebook()
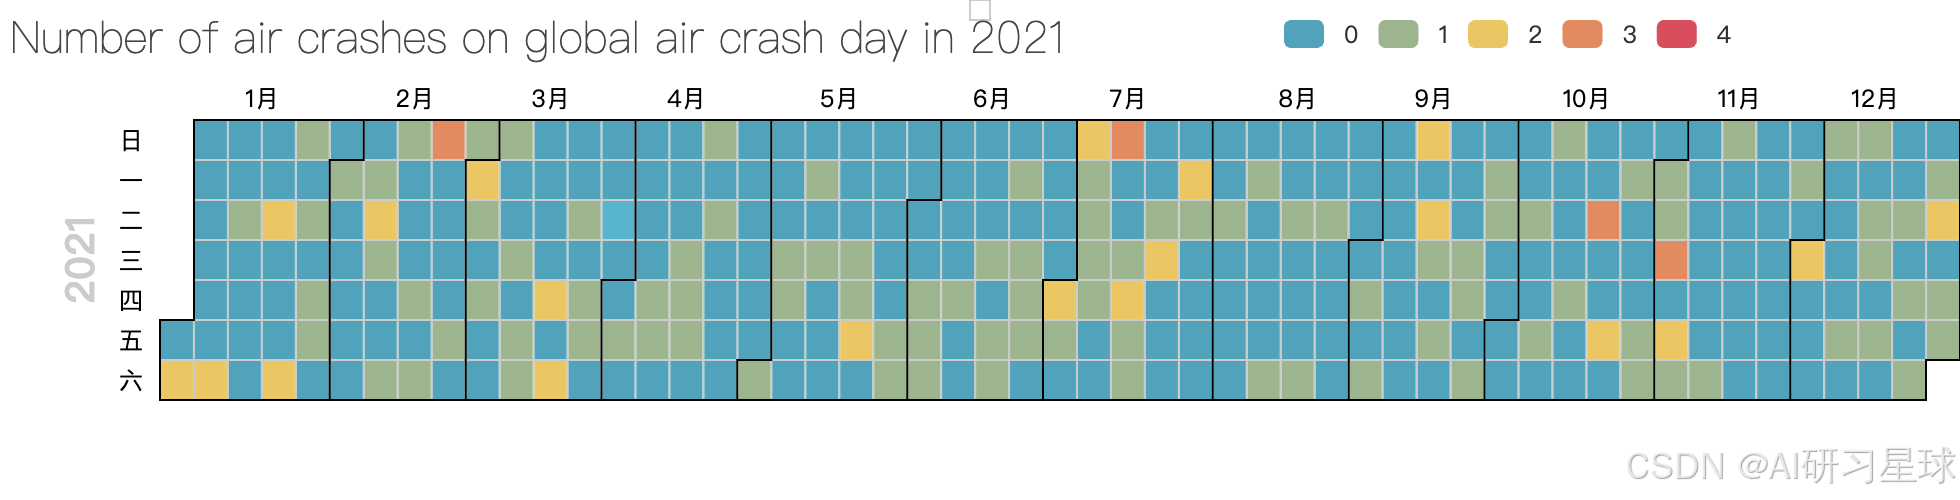
总结:
蓝色的“日子”表示当日无飞机出现事故,但每月都会出现1次的飞机发生事故
10、我国近10年发生空难的时间线
## 提取国内数据
tmp = df_t.query('Country == "China"')
##
def chage2date(x):
    try:
        r = pd.to_datetime(x)
    except:
        r = np.nan
    return r
## date列类型转换
tmp['date'] = tmp['date'].map(lambda x:chage2date(x))
## 删除缺失值
tmp.dropna(subset=['date'],inplace=True)
##
tmp['date_year'] = tmp['date_year'].astype('int')
## 当前年份
time_now = datetime.datetime.now().year
## 近10年数据
tmp = tmp.query('date_year > '+str(time_now-10)).sort_values('date')
tmp['casualties'] = tmp['casualties'].astype('int')
y_data = []
counter = 0
position = ['left', 'right']
for idx, row in tmp.iterrows():
    msg = '{bbb|%s} {aaa|%s}\n{hr|}\n{ccc|Location:%s}\n{ccc|Casualties:%s people}\n{ccc|Accident_type:%s}\n{ccc|Casualty_type:%s}' \
            % (str(row['date'])[:10], row['Air-craft type'], row['location'], row['casualties'], row['Accident_type'], row['Casualty_type'])
    l_item = opts.LineItem(
        name=10,
        value=counter,
        symbol='emptyCircle',
        symbol_size=10,
        label_opts=opts.LabelOpts(
            is_show=True,
            font_size=16,
            position=position[counter%2],
            formatter=msg,
            rich = {
                'aaa': {
                    'fontSize': 14,
                    'color': 'FireBrick',
                    'fontWeight':'bold',
                    'align':position[(counter+1)%2],
                    },
                'bbb': {
                    'fontSize': 14,
                    'color': '#000',
                    'align':position[(counter+1)%2]},
                'ccc': {
                    'fontSize': 14,
                    'color': '#1f2623',
                    'fontWeight':'lighter',
                    'family':'Adobe',
                    'align':position[(counter+1)%2],
                    },
                "hr": {
                    "borderColor": "#aaa",
                    "width": "100%",
                    "borderWidth": 0.8,
                    "height": 0,},
                }
            )
    )
    y_data.append(l_item)
    counter+=1
line = Line(
    init_opts=opts.InitOpts(
        theme='light',
        width='980px',
        height='1200px'
    )
)
line.add_xaxis(
    ['']
)
line.add_yaxis(
    '',
    y_data,
    linestyle_opts={
        'normal': {
            'width': 4,
            'color':'SteelBlue',
            'shadowColor': 'rgba(155, 18, 184, .3)',
            'shadowBlur': 10,
            'shadowOffsetY': 10,
            'shadowOffsetX': 10,
        }
    },
    itemstyle_opts={
        'normal': {
            'color':'red',
            'shadowColor': 'rgba(155, 18, 184, .3)',
            'shadowBlur': 10,
            'shadowOffsetY': 10,
            'shadowOffsetX': 10,
        }
    },
    tooltip_opts=opts.TooltipOpts(is_show=False)
)

line.set_global_opts(
    xaxis_opts=opts.AxisOpts(is_show=False, type_='category'),
    yaxis_opts=opts.AxisOpts(is_show=False, type_='value', max_=len(y_data)),
    title_opts=opts.TitleOpts(
        title="Time line of air crash in China in recent 10 years",
        subtitle="Deadline:2022/05/06 15:40",
        pos_left='center',
        pos_top='2%',
        title_textstyle_opts=opts.TextStyleOpts(
            color='#262545',
            font_size=22,
            font_family='Adobe',
            font_weight='lighter'
        )
    ),
    graphic_opts=[
                opts.GraphicGroup(
                    graphic_item=opts.GraphicItem(id_='1',left="center", top="center", z=-1),
                    children=[# tokyo
                            opts.GraphicImage(graphic_item=opts.GraphicItem(id_="logo",
                                                                            left='center',
                                                                            z=-1),
                                                graphic_imagestyle_opts=opts.GraphicImageStyleOpts(
                                width=800,
                                height=600,
                                opacity=0.1,)
                            )
                        ]
                    )
                ]
)


line.render_notebook()
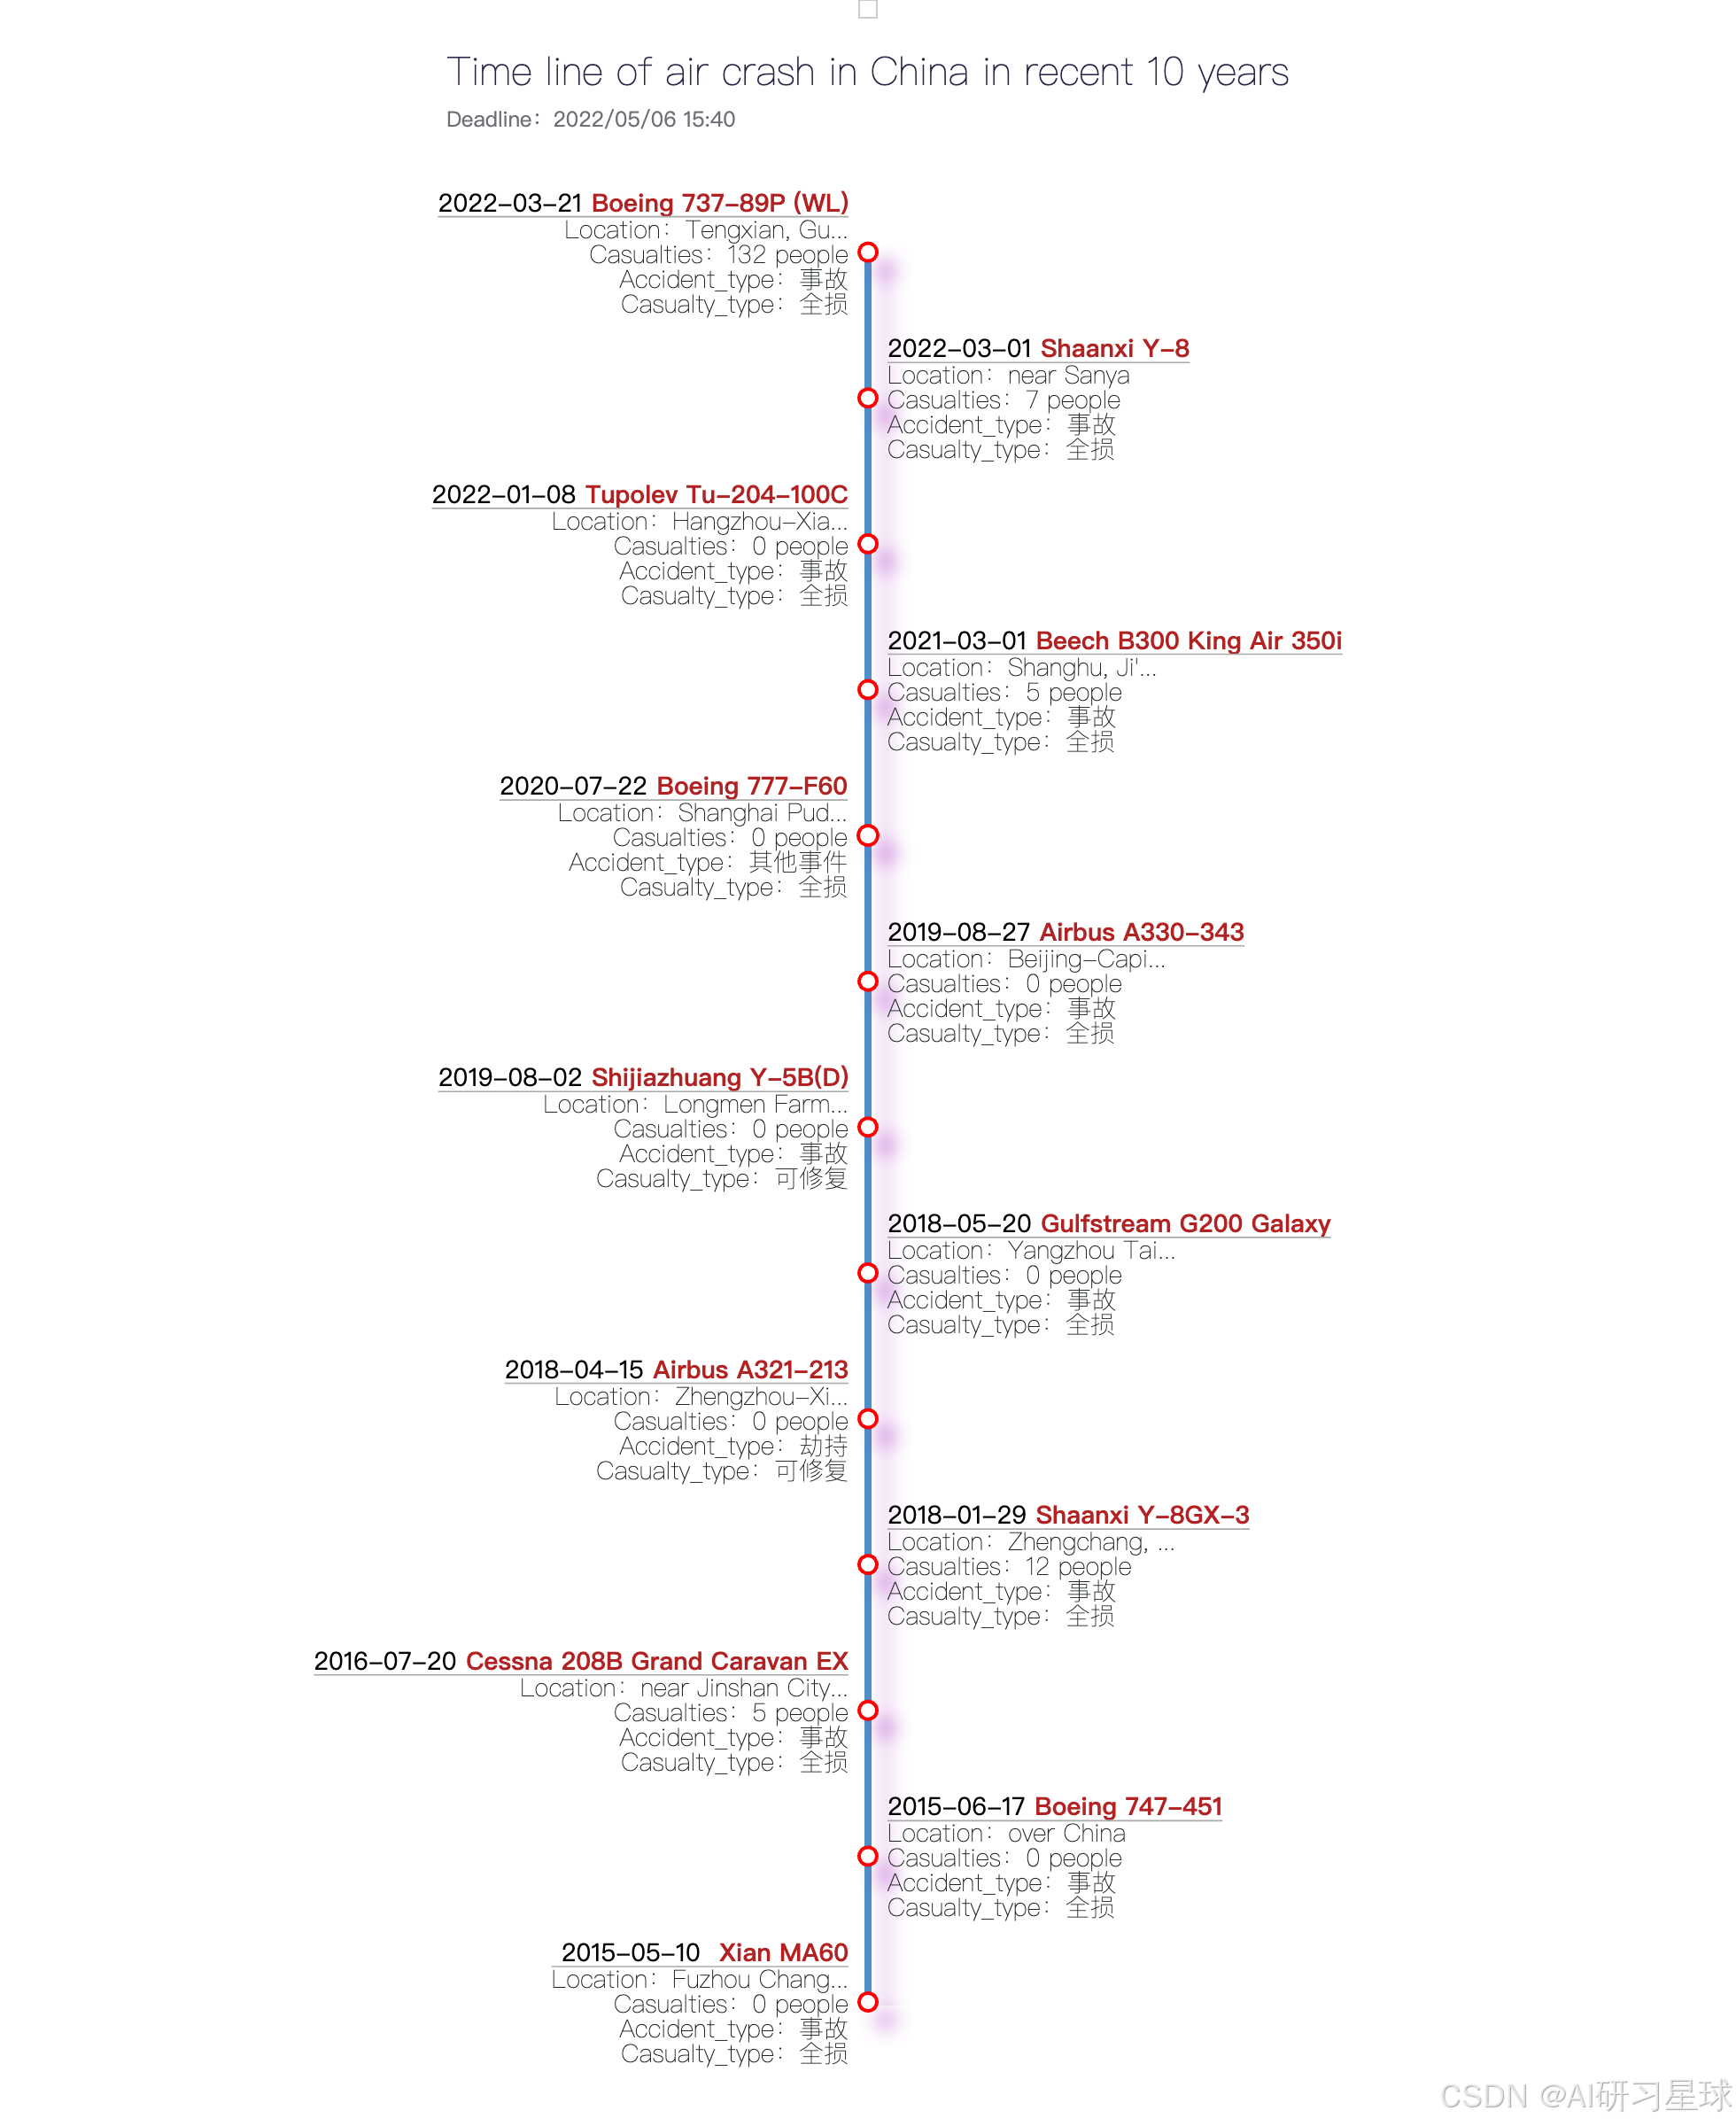
总结:
最近一次事故发生在2022年3月21日,飞机在藤县失事,失事类型属于事故型,损坏程度为全损
算法学习、4对1辅导、论文辅导、核心期刊
项目的代码和数据下载可以通过公众号滴滴我


 被折叠的 条评论
为什么被折叠?
被折叠的 条评论
为什么被折叠?
 到【灌水乐园】发言


