


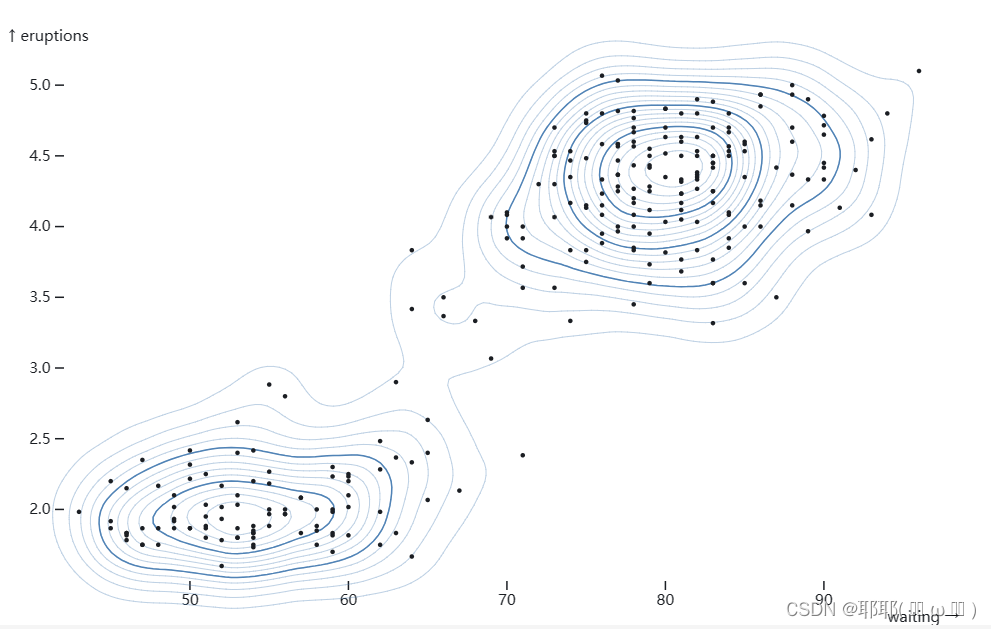
效果
注意:plot.js库中的交互功能没有echarts等库丰富,它主要是用于数据展示。官方文档链接:https://observablehq.com/plot/getting-started 遇到问题时候,可以去官方社区(https://talk.observablehq.com)提问,亲测一般一天内都会有结果。
正文
- 首先安装plot.js(个人使用的vue2)
npm install @observablehq/plot
- 在需要用到的页面导入
import * as Plot from "@observablehq/plot";
- 使用
在vue页面的methods中写个方法:
 show(faithful) {
 let a=Plot.plot({
  inset: 10,
  marks: [
  //密度图
    Plot.density(faithful, {x: "waiting", y: "eruptions", stroke: "steelblue", strokeWidth: 0.25}),
    Plot.density(faithful, {x: "waiting", y: "eruptions", stroke: "steelblue", thresholds: 4}),
    //散点图
    Plot.dot(faithful, {x: "waiting", y: "eruptions", fill: "currentColor", r: 1.5})
  ]
})
 $("#plot").append(ps);
 }
数据结构


 1808
1808


 被折叠的 条评论
为什么被折叠?
被折叠的 条评论
为什么被折叠?
 到【灌水乐园】发言


