


一、图层配置
export let LayersInfo = [
  {
    title:'天地图普通',
    layerCode:'tdtvec',
    url:'https://{subDomain}.tianditu.gov.cn/vec_w/wmts?SERVICE=WMTS&REQUEST=GetTile&VERSION=1.0.0&LAYER=vec&STYLE=default&TILEMATRIXSET=w&FORMAT=tiles&TILEMATRIX={level}&TILECOL={col}&TILEROW={row}&tk=46a08ed576eb9ad93d6a465a55544a5b',
    subDomains: ["t0", "t1", "t2", "t3", "t4", "t5", "t6", "t7"],
    copyright: "天地图",
    visible:false,
    serviceType:'WebTileLayer'
  },
  {
    title:'天地图普通标注',
    layerCode:'tdtvecanno',
    url:'https://{subDomain}.tianditu.gov.cn/cva_w/wmts?SERVICE=WMTS&REQUEST=GetTile&VERSION=1.0.0&LAYER=cva&STYLE=default&TILEMATRIXSET=w&FORMAT=tiles&TILEMATRIX={level}&TILECOL={col}&TILEROW={row}&tk=46a08ed576eb9ad93d6a465a55544a5b',
    subDomains: ["t0", "t1", "t2", "t3", "t4", "t5", "t6", "t7"],
    copyright: "天地图",
    visible:false,
    serviceType:'WebTileLayer'
  },
  {
    title:'天地图影像',
    layerCode:'tdtimg',
    url:'https://{subDomain}.tianditu.gov.cn/img_w/wmts?SERVICE=WMTS&REQUEST=GetTile&VERSION=1.0.0&LAYER=img&STYLE=default&TILEMATRIXSET=w&FORMAT=tiles&TILEMATRIX={level}&TILECOL={col}&TILEROW={row}&tk=46a08ed576eb9ad93d6a465a55544a5b',
    subDomains: ["t0", "t1", "t2", "t3", "t4", "t5", "t6", "t7"],
    copyright: "天地图",
    visible:false,
    serviceType:'WebTileLayer'
  },
  {
    title:'天地图影像标注',
    layerCode:'tdtimganno',
    url:'https://{subDomain}.tianditu.gov.cn/cia_w/wmts?SERVICE=WMTS&REQUEST=GetTile&VERSION=1.0.0&LAYER=cia&STYLE=default&TILEMATRIXSET=w&FORMAT=tiles&TILEMATRIX={level}&TILECOL={col}&TILEROW={row}&tk=46a08ed576eb9ad93d6a465a55544a5b',
    subDomains: ["t0", "t1", "t2", "t3", "t4", "t5", "t6", "t7"],
    copyright: "天地图",
    visible:false,
    serviceType:'WebTileLayer'
  },
  {
    title:'天地图地形',
    layerCode:'tdtter',
    url:'https://{subDomain}.tianditu.gov.cn/ter_w/wmts?SERVICE=WMTS&REQUEST=GetTile&VERSION=1.0.0&LAYER=ter&STYLE=default&TILEMATRIXSET=w&FORMAT=tiles&TILEMATRIX={level}&TILECOL={col}&TILEROW={row}&tk=46a08ed576eb9ad93d6a465a55544a5b',
    subDomains: ["t0", "t1", "t2", "t3", "t4", "t5", "t6", "t7"],
    copyright: "天地图",
    visible:false,
    serviceType:'WebTileLayer'
  },
  {
    title:'天地图地形标注',
    layerCode:'tdtteranno',
    url:'https://{subDomain}.tianditu.gov.cn/cta_w/wmts?SERVICE=WMTS&REQUEST=GetTile&VERSION=1.0.0&LAYER=cta&STYLE=default&TILEMATRIXSET=w&FORMAT=tiles&TILEMATRIX={level}&TILECOL={col}&TILEROW={row}&tk=46a08ed576eb9ad93d6a465a55544a5b',
    subDomains: ["t0", "t1", "t2", "t3", "t4", "t5", "t6", "t7"],
    copyright: "天地图",
    visible:false,
    serviceType:'WebTileLayer'
  },
  {
    title:'午夜蓝',
    layerCode:'wyl',
    url:'https://map.geoq.cn/ArcGIS/rest/services/ChinaOnlineStreetPurplishBlue/MapServer',
    visible: true,
    sublayers: [],
    serviceType:'TileLayer'
  },
  {
    title:'商丘',
    layerCode:'shangqiu',
    isRLayerPanel: true,
    copyright: "zdh",
    url:'/static/geojson/henan/shangqiu/shangqiu.json',
    opacity: 1,
    location: {longitude: 116.11704458402367, latitude: 34.25804927841997, level: 9.808516864898834},
    visible: true,
    serviceType:'GeoJSONLayer'
  },
  {
    title: '湿度',
    layerCode: 'rh',
    isRLayerPanel: true,
    paramField: 'nc',
    dataUrl: 'D:\\gis\\meteo\\rh\\current\\ncresult\\2022012815.nc',
    gpUrl: 'http://10.0.200.201/server/rest/services/meteo/ParseRh/GPServer/ParseRh',
    opacity: 0.6,
    zIndex: 12,
    location: {longitude: 119.10173927505058, latitude: 36.719213753859094, level: 5},
    visible: false,
    serviceType:'gpTif'
  },

  {
    title: '湖口云图',
    layerCode: 'hukouaqi',
    isRLayerPanel: true,
    paramField: 'tif',
    dataUrl: 'D:\\gis\\hukou\\wryttool\\wrytempresult\\temptif\\aqi.tif',
    gpUrl: 'http://10.0.200.201/server/rest/services/ParseTif/GPServer/PaseTif',
    opacity: 0.8,
    zIndex: 12,
    location: {longitude: 116.32255140087732, latitude: 29.660222280606867, level: 11},
    visible: false,
    serviceType: 'gpTif'
  },
  {
    title: '热力图',
    layerCode: 'heatmap',
    isRLayerPanel: true,
    url: '/static/geojson/point/station.json',
    dataPath: 'data/stationList/list',
    dataLongitudeField: 'longitude',
    dataLatitudeField: 'latitude',
    opacity: 0.8,
    zIndex: 12,
    location: {longitude: 116.11704458402367, latitude: 34.25804927841997, level: 9.808516864898834},
    visible: true,
    serviceType: 'heatMap'
  },
  {
    title: '聚合',
    layerCode: 'cluster',
    isRLayerPanel: true,
    url: '/static/geojson/point/station.json',
    dataPath: 'data/stationList/list',
    dataLongitudeField: 'longitude',
    dataLatitudeField: 'latitude',
    dataIdField: 'stationId',
    opacity: 0.8,
    zIndex: 12,
    location: {longitude: 116.11704458402367, latitude: 34.25804927841997, level: 9.808516864898834},
    visible: true,
    serviceType: 'cluster'
  },
  {
    layerCode: 'qianxitu',
    isRLayerPanel: true,
    url: '/static/EchartsData/transferData.json',
    dataIdField: 'code',
    dataLabelField: 'entName',
    dataPath: '',
    title: '迁徙图',
    isEcharts: true,
    isHasOpacity: false,
    location: {longitude: 115.8176488199009, latitude: 35.13617089683784, level: 7.996824109663511},
    visible: false,
    serviceType: 'EchartsQXT'
  },
  {
    layerCode: 'dianwei',
    isRLayerPanel: true,
    url: '/static/geojson/point/station.json',
    dataPath: 'data/stationList/list',
    dataLongitudeField: 'longitude',
    dataLatitudeField: 'latitude',
    geoType: 'point',
    opacity: 0.8,
    title: '点位',
    location: {longitude: 115.8176488199009, latitude: 35.13617089683784, level: 7.996824109663511},
    visible: false,
    serviceType: 'GraphicsLayer'
  },
  {
    layerCode: 'dianweilabel',
    isRLayerPanel: true,
    url: '/static/geojson/point/station.json',
    dataPath: 'data/stationList/list',
    dataLongitudeField: 'longitude',
    dataLatitudeField: 'latitude',
    dataLabelField: 'aqi',
    geoType: 'label',
    opacity: 0.8,
    title: '点位标注',
    location: {longitude: 115.8176488199009, latitude: 35.13617089683784, level: 7.996824109663511},
    visible: false,
    serviceType: 'GraphicsLayer'
  },
  {
    layerCode: 'line',
    isRLayerPanel: true,
    title: '线',
    url: '/static/geojson/line/xian.json',
    dataPath: 'features',
    dataGeoField: 'geometry',
    geoType: 'line',
    opacity: 1,
    location: {longitude: 116.11704458402367, latitude: 34.25804927841997, level: 9.808516864898834},
    visible: true,
    serviceType: 'GraphicsLayer'
  },
  {
    layerCode: 'polygon',
    isRLayerPanel: true,
    title: '面',
    url: '/static/geojson/polygon/mian.json',
    dataPath: 'features',
    dataGeoField: 'geometry',
    geoType: 'polygon',//注意挖洞要外环顺时针,内环逆时针
    opacity: 1,
    location: {longitude: 116.11704458402367, latitude: 34.25804927841997, level: 9.808516864898834},
    visible: false,
    serviceType: 'GraphicsLayer'
  },
  {
    layerCode: 'interpolation',
    isRLayerPanel: true,
    title: '等值面',
    url: '/static/geojson/screenVec.json',
    opacity: 1,
    location: {longitude: 116.11704458402367, latitude: 34.25804927841997, level: 9.808516864898834},
    visible: false,
    serviceType: 'GeoJSONLayer'
  },

  {
    layerCode: 'ls',
    title: 'ls',
    location: {longitude: 115.8176488199009, latitude: 35.13617089683784, level: 7.996824109663511},
    visible: true,
    serviceType: 'GraphicsLayer'
  }
]
图层类型及加载解析:
for (var i=0; i<this.LayersInfo.length; i++) {
//要素图层
  if (this.LayersInfo[i].serviceType == 'FeatureLayer') {
    this.CreateFeatureLayer(this.LayersInfo[i])
  }
//动态切片图层
  if (this.LayersInfo[i].serviceType == 'arcGISDynamicMapService') {
    this.CreateArcGISDynamicMapServiceLayer(this.LayersInfo[i])
  }
//图片图层
  if (this.LayersInfo[i].serviceType == 'MapImageLayer') {
    this.CreateMapImageLayer(this.LayersInfo[i])
  }
//切片图层
  if (this.LayersInfo[i].serviceType == 'TileLayer') {
    this.CreateTileLayer(this.LayersInfo[i])
  }
//图形图层
  if (this.LayersInfo[i].serviceType == 'GraphicsLayer') {
    this.CreateGraphicsLayer(this.LayersInfo[i])
  }
//服务切片图层
  if (this.LayersInfo[i].serviceType == 'WebTileLayer') {
    this.CreateWebTileLayer(this.LayersInfo[i])
  }
//图形JSON图层
  if (this.LayersInfo[i].serviceType == 'GeoJSONLayer') {
    this.CreateGeoJSONLayer(this.LayersInfo[i])
  }
//地理空间服务解析tif栅格图层
  if (this.LayersInfo[i].serviceType == 'gpTif') {
    this.addGpLayer(this.LayersInfo[i])
  }
//热力图
  if (this.LayersInfo[i].serviceType == 'heatMap') {
    this.addheatMapLayer(this.LayersInfo[i])
  }
//聚合
  if (this.LayersInfo[i].serviceType == 'cluster') {
    this.addClusterLayer(this.LayersInfo[i])
  }
//echarts迁徙图
  if (this.LayersInfo[i].serviceType === "EchartsQXT") {
    if (this.echartsLayerUtil === null) {
      this.echartsLayerUtil = new EchartsLayerUtil(this)
    }
    this.CommoncreateEchartsQXTLayer(this.LayersInfo[i])
  }
}
二、图层符号库
包含点、线、面及文本符号
import aqiSymbol1 from "../../../assets/icons/air/市控-优.png"
import aqiSymbol2 from "../../../assets/icons/air/市控-良.png"
import aqiSymbol3 from "../../../assets/icons/air/市控-轻度.png"
import aqiSymbol4 from "../../../assets/icons/air/市控-中度.png"
import aqiSymbol5 from "../../../assets/icons/air/市控-重度.png"
import aqiSymbol6 from "../../../assets/icons/air/市控-严重.png"
export let Layersymbols = {
  fillSymbol: {
    type: "simple-fill",
    color: [135, 206, 250, 0.6],
    outline: {
      color: [255, 20, 147],
      width: 2
    }
  },
  regionSymbol: {
    type: 'simple-fill', // autocasts as new SimpleFillSymbol()
    color: [62, 65, 172, 0.2],
    fillOpacity: 0.2,
    // color: '#95eed4',
    // color: [43, 0, 29, 0],
    style: 'solid',
    outline: { // autocasts as new SimpleLineSymbol()
      color: [62, 65, 172, 1],
      // color: '#95eed4',
      width: 1
    }
  },
  polygonSymbol: {
    type: "simple-fill",
    color: [135, 20, 147, 0.6],
    outline: {
      color: [255, 20, 147],
      width: 2
    }
  },
  picSymbol: {
    type: "picture-marker",
    url: "/img/pp1.png",
    width: 10,
    height: 10
  },
  MarkerSymbol: {
    type: "simple-marker",
    color: [255,0,0],
    size: 17,
    outline: {
      width: 0.5,
      color: [255, 34, 34]
    }
  },
  polylineSymbol: {
    type: "simple-line",
    color: [226, 119, 40],
    width: 4
  },
  textSymbol: {
    type: "text",  // autocasts as new TextSymbol()
    color: "white",
    haloColor: "black",
    haloSize: "1px",
    text: "You are here",
    xoffset: 3,
    yoffset: 3,
    font: {  // autocasts as new Font()
      size: 12,
      family: "Josefin Slab",
      weight: "bold"
    }
  },
  aqiFillSymbol1: {
    type: "simple-fill",
    color: [0, 206, 0, 0.6],
    outline: {
      color: [255, 20, 147],
      width: 0
    }
  },
  aqiFillSymbol2: {
    type: "simple-fill",
    color: [254, 255, 3, 0.6],
    outline: {
      color: [255, 20, 147],
      width: 0
    }
  },
  aqiFillSymbol3: {
    type: "simple-fill",
    color: [255, 101, 0, 0.6],
    outline: {
      color: [255, 20, 147],
      width: 0
    }
  },
  aqiFillSymbol4: {
    type: "simple-fill",
    color: [254, 0, 0, 0.6],
    outline: {
      color: [255, 20, 147],
      width: 0
    }
  },
  aqiFillSymbol5: {
    type: "simple-fill",
    color: [129, 0, 127, 0.6],
    outline: {
      color: [255, 20, 147],
      width: 0
    }
  },
  aqiFillSymbol6: {
    type: "simple-fill",
    color: [128, 0, 0, 0.6],
    outline: {
      color: [255, 20, 147],
      width: 0
    }
  },
}
三、渲染设置
import {Layersymbols} from '../symbols/LayerSymbols'
export let LayersRenderSet = {
  AreaRegion: {
    renderType: "single",
    symbol: Layersymbols.fillSymbol
  },
  dianwei: {
    renderType: "single",
    symbol: Layersymbols.MarkerSymbol
  },
  dianweilabel: {
    renderType: "single",
    symbol: Layersymbols.textSymbol
  },
  line: {
    renderType: "single",
    symbol: Layersymbols.polylineSymbol
  },
  polygon: {
    renderType: "single",
    symbol: Layersymbols.fillSymbol
  },
  interpolation: {
    renderType: "level",
    renderField: "hvalue",
    FieldScope: [{min:-1,max:50,symbol:Layersymbols.aqiFillSymbol1},{min:50,max:100,symbol:Layersymbols.aqiFillSymbol2},{min:100,max:150,symbol:Layersymbols.aqiFillSymbol3},{min:150,max:200,symbol:Layersymbols.aqiFillSymbol4},{min:200,max:300,symbol:Layersymbols.aqiFillSymbol5},{min:300,max:999999,symbol:Layersymbols.aqiFillSymbol6}]
  },
  // RiskPoint:{
  //   renderType:"unique",
  //   renderField:"riskLevel",
  //   FieldUnique:[{value:"注意",symbol:Layersymbols.RiskSymbolC1},{value:"警示",symbol:Layersymbols.RiskSymbolC2},
  //     {value:"警戒",symbol:Layersymbols.RiskSymbolC3},{value:"警报",symbol:Layersymbols.RiskSymbolC4}]
  // },
  shangqiu:{
    renderType: "single",
    symbol: Layersymbols.regionSymbol
  },
  // AQIContour:{
  //   renderType:"level",
  //   renderField:"AQI",
  //   FieldScope:[{min:-1,max:50,symbol:Layersymbols.AQIContourSymb0l1},{min:50,max:100,symbol:Layersymbols.AQIContourSymb0l2},{min:100,max:150,symbol:Layersymbols.AQIContourSymb0l3},{min:150,max:200,symbol:Layersymbols.AQIContourSymb0l4},{min:200,max:300,symbol:Layersymbols.AQIContourSymb0l5},{min:350,max:999999,symbol:Layersymbols.AQIContourSymb0l6}]
  // },
}
四、目前完成的版本支持vue2和vue3及原生HTML实现

五、成果展示

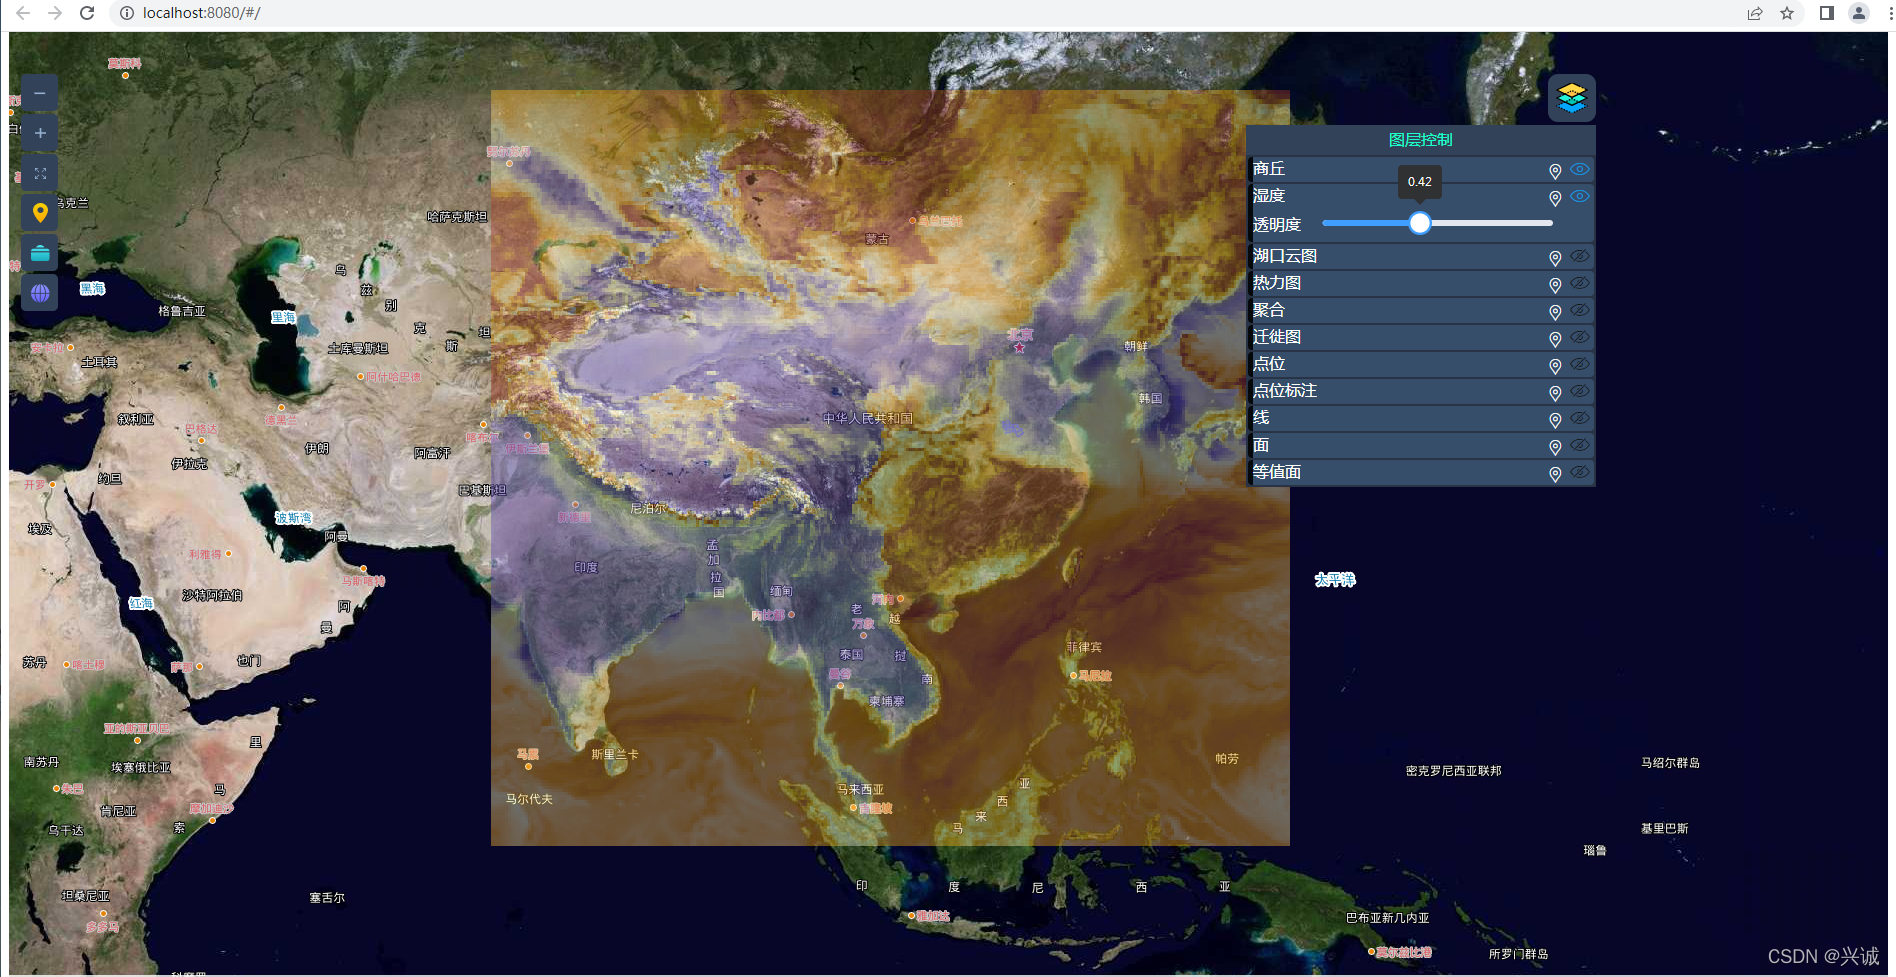
工具条支持放大、缩小、全屏、初始化位置、测量线面、底图切换


图层控制控件包含图层的定位、显示隐藏、透明度设置


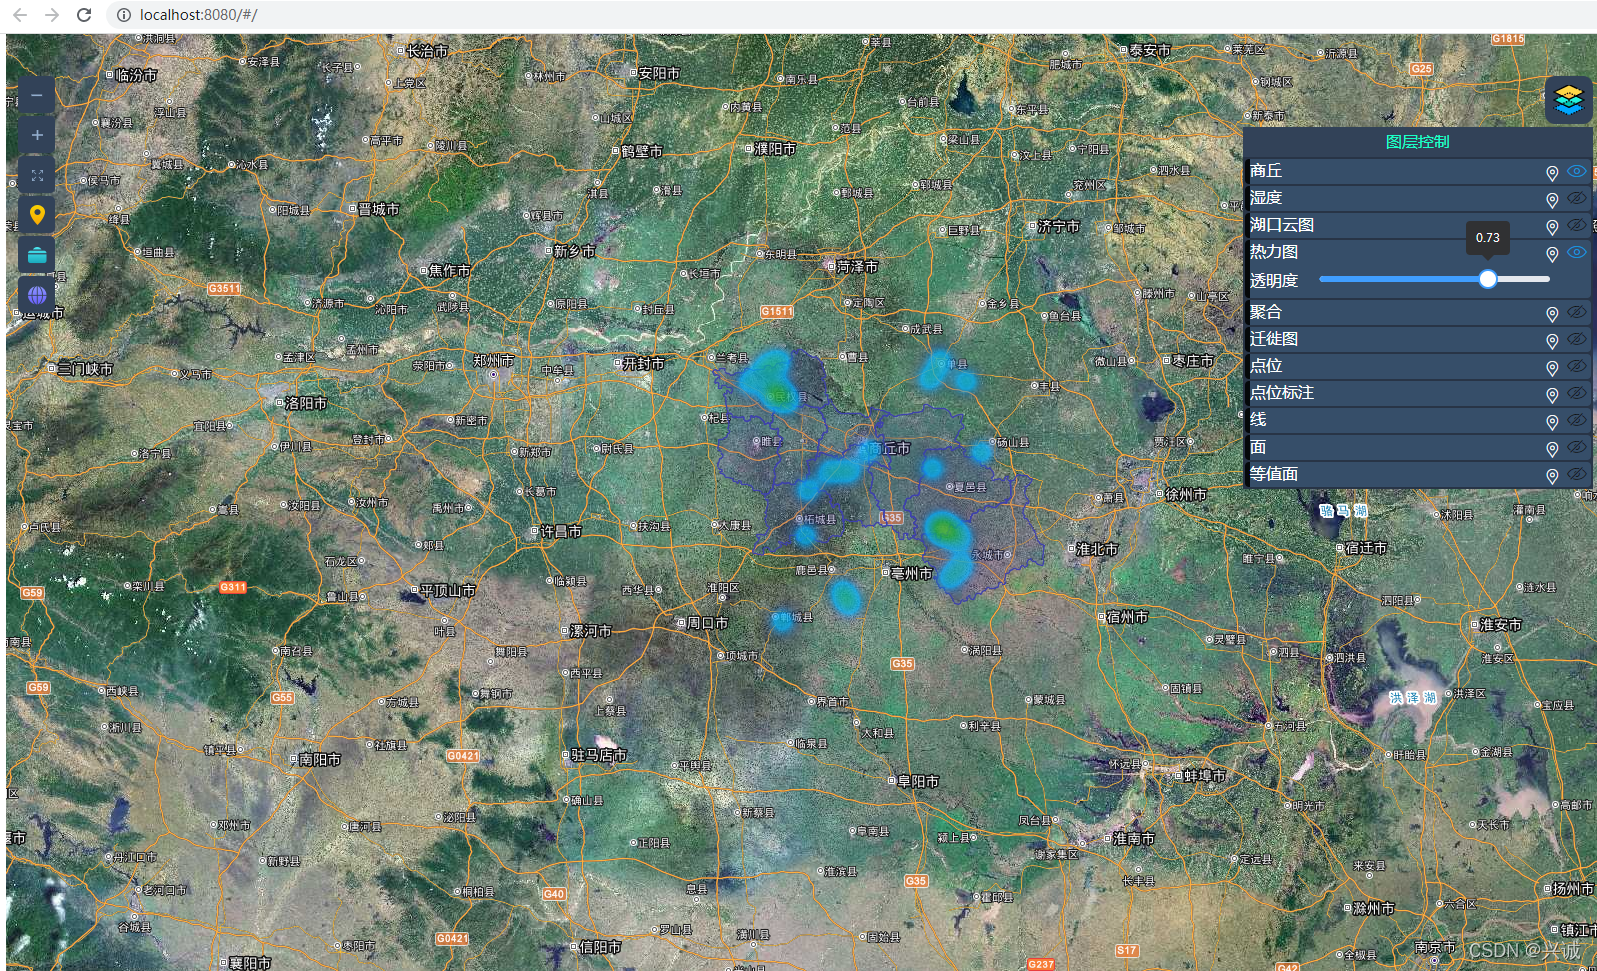


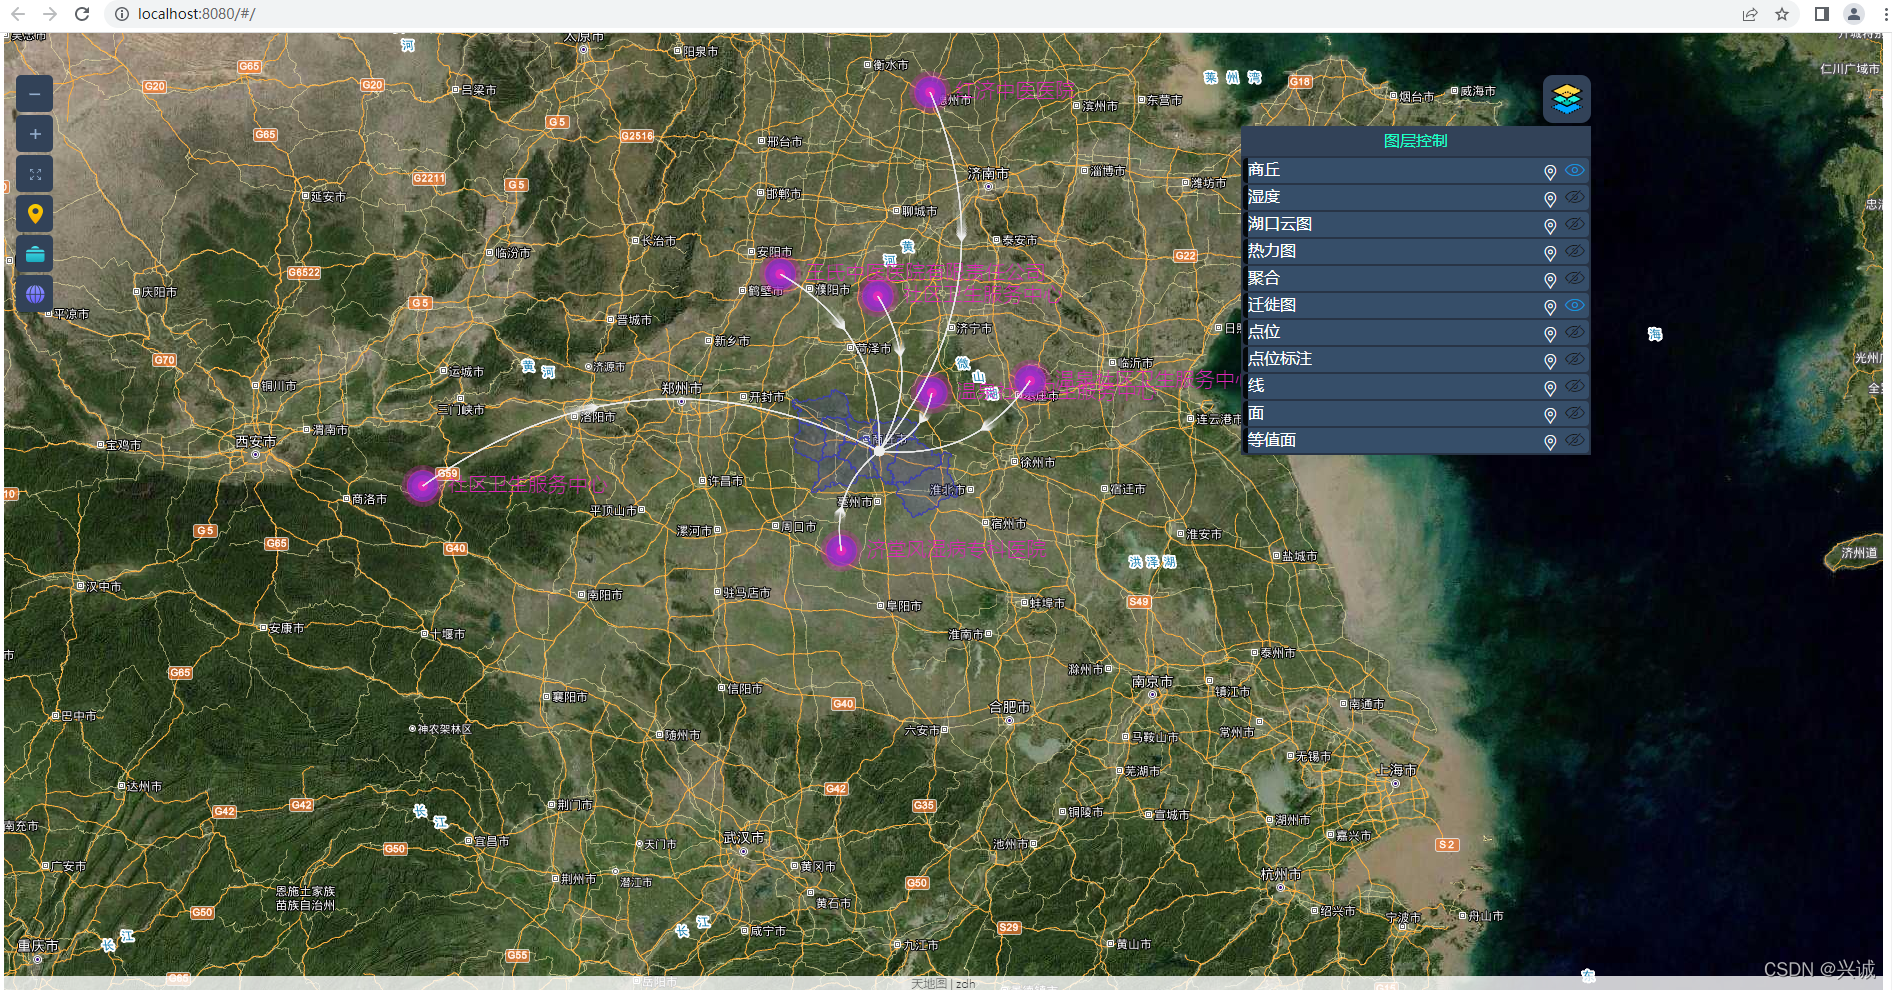


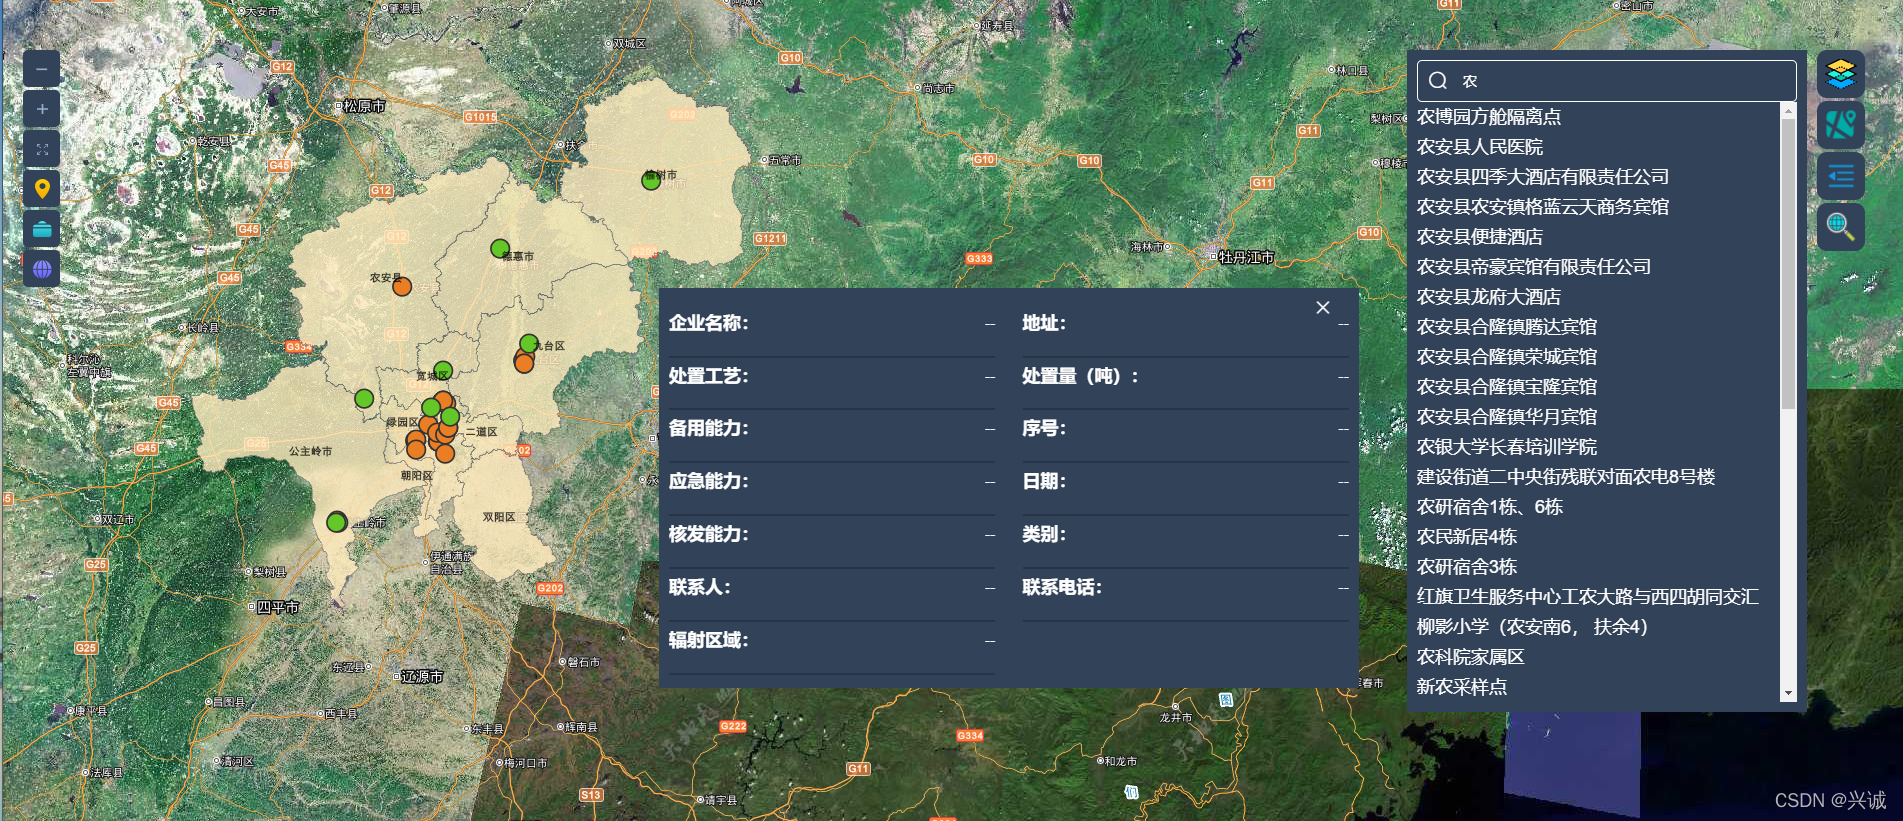
 成功项目应用 疫情系统

如果对您有帮助
感谢支持技术分享,请扫码点赞支持:
技术合作交流qq:2401315930


 1272
1272


 被折叠的 条评论
为什么被折叠?
被折叠的 条评论
为什么被折叠?
 到【灌水乐园】发言


