


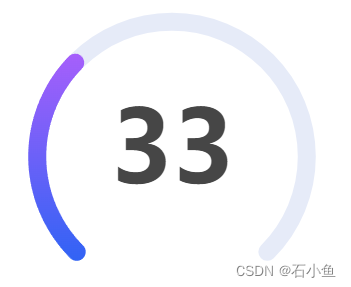
实现效果
直接上代码
option = {
  tooltip: {
    formatter: '{a} <br/>{b} : {c}%',
  },
  series: [
    {
      type: 'gauge',
      min: 0, // 最小刻度
      max: 100,
      radius: '40%',
      progress: {
        show: true,
        width: 18,
        roundCap: true,
        itemStyle: {
          color: new echarts.graphic.LinearGradient(0, 0, 0, 1, [{
             offset: 0,
             color: '#A65FFB'
           }, {
             offset: 1,
             color: '#3163F5'
           }])
        }
      },
      axisLine: {
        lineStyle: {
          width: 18
        },
        roundCap: true,
      },
      axisTick: {
        show: false
      },
      splitLine: {
        show: false,
      },
      pointer: {
        show: false,
      },
      axisLabel: {
        show: false
      },
      anchor: {
        show: false,
      },
      detail: {
        fontSize: 100,
        offsetCenter: [0, 0]
      },
      data: [
        {
          value: 33
        },
      ]
    }
  ]
};
可以查看效果:点击
尺寸监听
onMounted(() => {
  nextTick(() => {
    window.addEventListener('resize', onloadEcharts);
  });
});
onUnmounted(() => {
  window.removeEventListener('resize', onloadEcharts);
});


 2449
2449


 被折叠的 条评论
为什么被折叠?
被折叠的 条评论
为什么被折叠?
 到【灌水乐园】发言


