


重定向控制消息
这节没看懂,但是找到了tty子系统介绍的博客:
http://wiki.100ask.org/Serial_TTY_overview
https://www.wolai.com/5gJYLKcKhDUue2Sh1xaknB
先跳过了。
内核log如何记录和查看
printk 将消息记录在一个固定大小的循环缓冲区了,通过读取 /proc/kmsg 可以读取之前没读取过的内核打印信息,而 dmesg 却能获取缓冲区全部内容却不刷新缓冲区。神了,以后在插拔新的内核module监控内核打印时可以用下面的指令监控新产生的内核打印了:
cat /proc/kmsg
这个博客 klogd&syslogd与dmesg-嵌入式系统获取linux内核log
还讲解了 klogd&syslogd与dmesg 获取内核日志方法的原理区别等等,暂未深入探索。
linux消息处理的一个特点:可在任何地方调用printk, 包括在中断里。
如何更便捷的开启和关闭消息
在c代码我们可以通过宏来打开和关闭调试信息,以防在我们完成调试后又需要再重新删除所有调试信息。如下
#undef PDEBUG			/* 取消定义以防重复定义 */
#ifdef SCULL_DEBUG
						/* 使能打印信息 */
#	ifdef __kernel__	/* 内核态打印 */
		#define PDEBUG(fmt, args...) printk(KERN_DEBUG "scull_debug: " fmt, ##args)
#	else				/* 用户态打印 */
		#define PDEBUG(fmt, args...) fprintf(stderr, fmt, ##args)
#	endif

#else

	#define PDEBUG()	/* 使打印失效 */

#endif

#undef N_PDEBUG			/* 可以用于注释掉暂时不想要的调试打印,但不完全删除它 */
#define N_PDEBUG(fmt, args...)
这个太棒了,既能打印用户空间又能打印内核空间,还能在需要去除打印时全部清除,还能在调试过程中暂时注释对当前调试代码不重要的打印,我们只需要再定义或者取消定义SCULL_DEBUG这个宏就可以开关打印信息了。但改代码还是有点麻烦哈?
那就在 Makefile 中实现开关打印信息:
# Comment/Uncomment following line to disable/enable debuging
DEBUG = y

# add your debug flug (or not) to CFLAGS
ifeq ($(DEBUG), y)
	DEBCFLAGS = -O -g -DSCULL_DEBUG //在这定义了 SCULL_DEBUG 宏
else
	DEBCFLAGS = -O2 //不需要调试信息,更高级别的优化选项,通常用于生产环境的编译
endif

CFLAGS += $(DEBCFLAGS)
总结一下,这种宏定义的打印调试方法比C条件语句好太多了,避免系统执行过程种还要进行条件判断(有时候这种性能损失无法接受)。
限制printk打印次数(比较有用)
当打印信息太对,可能导致文件系统溢出时,但是我们又希望看到我们的打印信息,这时候可以使用:
int printk_retelimit(void); //通过跟踪控制台消息数量返回不同的返回值,来限制打印消息

//使用方法
if (printk_ratelimit())
	printk(KERN_NOTICE "The printer is still on fire\n");

//通过修改
/proc/sys/kernel/printk_ratelimit  限制重新打开消息之前等待的秒数,默认为 5 秒,值为设置0则表示没有速率限制
还是不懂对吧。一会儿看我的实验。
/proc/sys/kernel/printk_ratelimit_burst  在进行速度限制操作之前允许控制台打印的消息数量 默认为10条
代码举例:
#include <linux/module.h>
#include <linux/init.h>
#include <linux/delay.h>

static int __init test_init(void)
{
	int i;

	printk(KERN_NOTICE "enter %s() \n", __func__);
	for (i = 0; i < 1000; i++) {
		if (printk_ratelimit())
			printk("i = %d\n", i);
		msleep(10); //休眠10ms, 不会占住cpu资源,其他模块此时也可以使用cpu资源
	}

	return 0;
}

static void __exit test_exit(void)
{
	printk("exit this module\n");
}

module_init(test_init);
module_exit(test_exit);

MODULE_LICENSE("GPL");
MODULE_AUTHOR("Your Name");
MODULE_DESCRIPTION("test how to use printk_ratelimit");
编译运行:
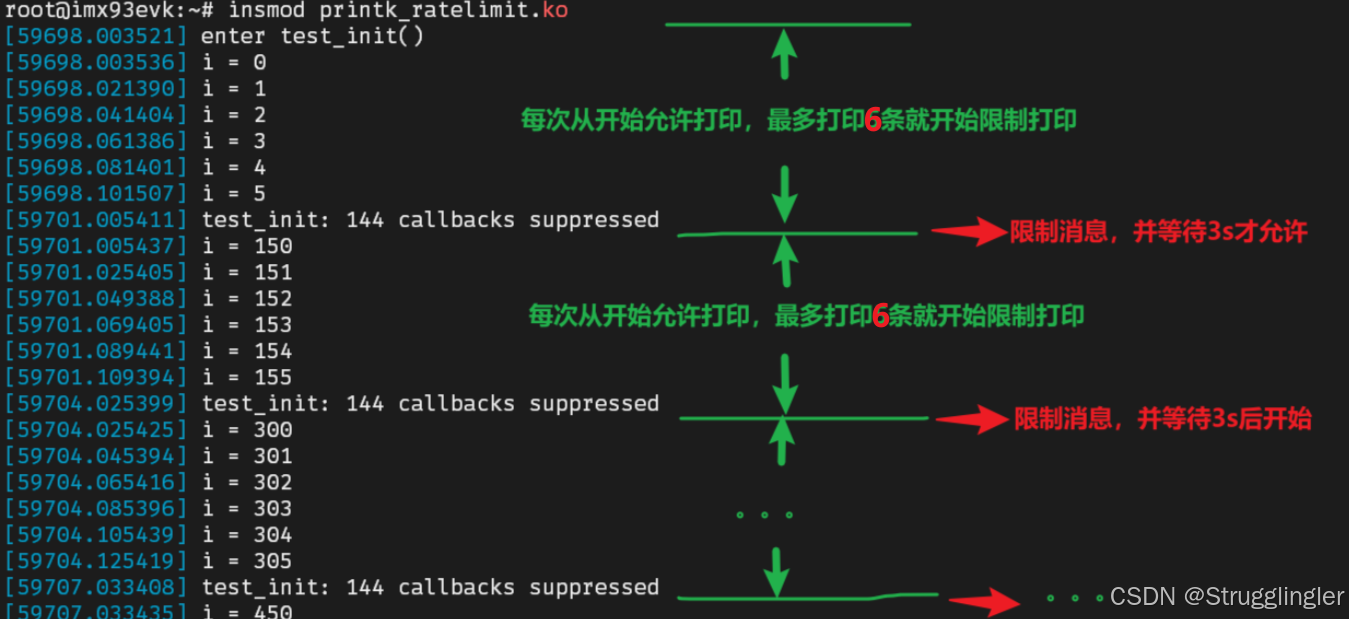
root@imx93evk:~# insmod printk_ratelimit.ko
root@imx93evk:~# echo 3 > /proc/sys/kernel/printk_ratelimit
root@imx93evk:~# echo 6 > /proc/sys/kernel/printk_ratelimit_burst
结果展示:
打印设备编号
出于一致性考虑,内核提供一对辅助宏用于打印设备号:
//<linux/kdev_t.h>
int print_dev_t(char *buffer, dev_t dev);
char *format_dev_t(char *buffer, dev_t dev);
通过查询调试
使用 /proc 文件系统
/proc 文件系统是与内核进行信息交互的接口,每个/proc文件都是动态生成的,都对应一个内核函数,比如我们常用的ps, top, uptime等。
创建自己的/proc文件
1.先实现自己的read_proc函数,我们称为 read_proc 方法:
2.借助create_proc_read_entry函数把刚刚创建好的read_proc函数与一个/proc入口链接起来
3.介绍了一个用于替代read_proc的seq_file接口,包含struct seq_operations结构的填充,struct file_operations结构填充,调用creat_proc_entry,一套代码就有了自己的/proc目录,有啥用呢?我没抄代码,没看懂,不知道要干啥。
接口太多太麻烦,先不学,知道ioctl怎样使用就行,可以作为代替/proc文件系统的方法,第六章学。
通过监视调试
strace命令
转到我的博客:strace命令
总结一下:
-tt :在每行行首,显示毫秒级别的时间
-T :显示每次系统调用所花费的时间
-v :对于某些相关调用,把完整的环境变量,文件stat结构等打出来。
-f :跟踪目标进程,以及目标进程创建的所有子进程
-e :控制指定系统调用接口来跟踪的事件和跟踪行为,如下所示:
-e trace=file 	:跟踪所有以文件名作为参数的系统调用
-e trace=set	:仅跟踪指定的系统调用集。如trace=open,close,read,write表示仅跟踪这四个系统调用。
-e trace=process:跟踪涉及过程管理的所有系统调用。比如fork/exec/exit_group
-e trace=network:跟踪所有与网络相关的系统调用。比如socket/sendto/connect
-e trace=signal	:跟踪所有与信号相关的系统调用。比如kill/sigaction
-e trace=ipc	:跟踪所有与IPC相关的系统调用,比如shmget等
-e trace=desc  	:和文件描述符相关,比如write/read/select/epoll等
[注意]:绝大多数情况,我们使用上面的组合名字就够了。实在需要跟踪具体的系统调用时,可能需要注意C库实现的差异。比如我们知道创建进程使用的是fork系统调用,但在glibc里面,fork的调用实际上映射到了更底层的clone系统调用。使用strace时,得指定-e trace=clone, 如果你指定-e trace=fork什么也跟踪不上。
-o :把strace的输出单独写到指定的文件,而不是stderr
-s :当系统调用的某个参数是字符串时,最多输出指定长度的内容,默认是32个字节
-p :指定要跟踪的进程pid, 要同时跟踪多个pid, 重复多次-p选项即可。
-c :参数:统计不同系统调用的执行时间,调用次数,错误次数。
注意:万能的strace也不是真正的万能。当目标进程卡死在用户态时,strace就没有输出了。这个时候我们需要其他的跟踪手段,比如 gdb/perf/SystemTap 等
调试系统故障(会看oops消息)
当对NULL取值或者使用了不正确的指针值会导致一个oops消息。因为处理器使用的都是虚拟地址,这些虚拟地址通过页表映射为物理地址,如果使用的指针不正确,分页机制无法将该地址映射为物理地址,处理器就会向操作系统发出页面失效信号,如果处理器恰好处于超级用户模式,系统就会产生一个oops.
让我看几个oops的例子:
- fault.c 这个字符设备驱动中这样实现
write方法。
ssize faulty_write(struct file *filp, const char __user *buf, size_t count, loff_t *ops)
{
	/* make a simple fault by dereferencing a NULL pointer */
	*(int *)0 = 0;
	return 0;
}
然后写符驱动设备时报错:
# cat /proc/kmsg
<1>[27555.421554] Unable to handle kernel NULL pointer dereference at virtual address 0000000000000000
<1>[27555.421571] Mem abort info:
<1>[27555.421573]   ESR = 0x0000000096000044
<1>[27555.421575]   EC = 0x25: DABT (current EL), IL = 32 bits
<1>[27555.421579]   SET = 0, FnV = 0
<1>[27555.421582]   EA = 0, S1PTW = 0
<1>[27555.421583]   FSC = 0x04: level 0 translation fault
<1>[27555.421586] Data abort info:
<1>[27555.421588]   ISV = 0, ISS = 0x00000044, ISS2 = 0x00000000
<1>[27555.421590]   CM = 0, WnR = 1, TnD = 0, TagAccess = 0
<1>[27555.421592]   GCS = 0, Overlay = 0, DirtyBit = 0, Xs = 0
<1>[27555.421595] user pgtable: 4k pages, 48-bit VAs, pgdp=0000000085ee4000
<1>[27555.421598] [0000000000000000] pgd=0000000000000000, p4d=0000000000000000
<0>[27555.421607] Internal error: Oops: 0000000096000044 [#1] PREEMPT_RT SMP
<4>[27555.421611] Modules linked in: faulty_module(O) crct10dif_ce polyval_ce snd_soc_fsl_asoc_card polyval_generic snd_soce
<4>[27555.421651] CPU: 1 PID: 1159 Comm: fault_app.out Tainted: G         C O       6.6.36-rt35-lts-next #1
<4>[27555.421657] Hardware name: NXP i.MX93 11X11 EVK board (DT)
<4>[27555.421659] pstate: 80400009 (Nzcv daif +PAN -UAO -TCO -DIT -SSBS BTYPE=--)
<4>[27555.421664] pc : fault_write+0x8/0x10 [faulty_module]
<4>[27555.421680] lr : vfs_write+0xc8/0x300
<4>[27555.421688] sp : ffff80008370bd20
<4>[27555.421690] x29: ffff80008370bd80 x28: ffff000004144880 x27: 0000000000000000
<4>[27555.421698] x26: 0000000000000000 x25: 0000000000000000 x24: 0000000000000000
<4>[27555.421705] x23: 0000000000000000 x22: ffff80008370bdc0 x21: 0000ffffda099e20
<4>[27555.421711] x20: ffff000005c223c0 x19: 0000000000000005 x18: 0000000000000000
<4>[27555.421718] x17: 0000000000000000 x16: 0000000000000000 x15: 0000000000000000
<4>[27555.421724] x14: 0000000000000000 x13: 0000000000000000 x12: 0000000000000000
<4>[27555.421730] x11: 0000000000000000 x10: 0000000000000000 x9 : 0000000000000000
<4>[27555.421736] x8 : 0000000000000000 x7 : 0000000000000200 x6 : 00000000c00000b7
<4>[27555.421742] x5 : 0000000067dfdddd x4 : ffff80007a31b008 x3 : ffff80008370bdc0
<4>[27555.421748] x2 : 0000000000000005 x1 : 0000000000000000 x0 : 0000000000000000
<4>[27555.421755] Call trace:
<4>[27555.421757]  fault_write+0x8/0x10 [faulty_module]
<4>[27555.421766]  ksys_write+0x74/0x10c
<4>[27555.421770]  __arm64_sys_write+0x1c/0x28
<4>[27555.421775]  invoke_syscall+0x48/0x114
<4>[27555.421783]  el0_svc_common.constprop.0+0xc0/0xe0
<4>[27555.421789]  do_el0_svc+0x1c/0x28
<4>[27555.421795]  el0_svc+0x40/0xe4
<4>[27555.421801]  el0t_64_sync_handler+0x120/0x12c
<4>[27555.421807]  el0t_64_sync+0x190/0x194
<0>[27555.421816] Code: 52800000 d65f03c0 d2800001 d2800000 (b900003f)
<4>[27555.421820] ---[ end trace 0000000000000000 ]---
上图看出在Modules linked in: faulty_module(O) 这个模块的 fault_write 函数接口时发生错误了,pc指针指向这个函数(PC指针为存放吓一跳指令地址的寄存器)。
pc : fault_write+0x8/0x10 [faulty_module]错误发生在这个函数的第8字节处,该函数本身为16字节长。
另外看Call trace这一列为符号化的调用栈,只有打开内核的CONFIG_KALLSYMS=y配置选项才能有哦。
- fault.c 这个字符设备驱动中这样实现
read方法。
static ssize_t fault_read(struct file *filp, char __user *buff, size_t count, loff_t *offp)
{
	int ret;
	char stack[4];

	memset(stack, 0xff, 20); //复制时越界

	if (count > 4)
		count = 4;
	ret = copy_to_user(buff, stack, count);
	if (ret == 0)
		return count;

	return ret;
}
然后直接给我卡死了。。。还得重启板子:
# ./fault_app.out read read
[28507.834957] Kernel panic - not syncing: stack-protector: Kernel stack is corrupted in: fault_read+0xcc/0xcc [faulty_modu]
[28507.834971] SMP: stopping secondary CPUs
[28507.834984] Kernel Offset: disabled
[28507.834986] CPU features: 0x0,c0000000,40028143,1000721b
[28507.834990] Memory Limit: none
[28507.861824] ---[ end Kernel panic - not syncing: stack-protector: Kernel stack is corrupted in: fault_read+0xcc/0xcc [fa-
从内核打印第一行看出,内核栈被破坏了,Kernel stack is corrupted in: fault_read+0xcc/0xcc [faulty_modu],我这个错误信息定位拿出来了,但一般很难定位错误在哪里。
fault_read+0xcc/0xcc [faulty_modu]错误发生在这个函数的第0xcc字节处,该函数本身为0xcc字节长。
调试器和相关工具(gdb使用)
书中粗略介绍了很多工具,我只详细学习一下gdb工具。 参考链接:【Linux】GDB用法详解(5小时快速教程)
GDB是GNU开源组织发布的UNIX下程序调试工具。
一般GDB帮你完成以下四个方面的事情:
1、以你想要的方式启动程序
2、在你想要的地方暂停程序
3、程序暂停后观察程序运行到哪了在做什么
4、动态改变你的执行环境
如何使用gdb
首先安装 gdb :sudo apt-get install gdb
1. 如何编译gdb文件
编译要调试的文件时增加`-g`参数. 如:`gcc -g txt.c -o txt.out`
2. 如何启动调试
方法一:gdb ./app.out  常用于在当前目录下执行你的可执行文件
还有其他情况,暂时没深究。
3. GDB 的命令概览
启动后就可以使用gdb调试了,输入help后:
(gdb) help
List of classes of commands:

aliases -- User-defined aliases of other commands.
breakpoints -- Making program stop at certain points.
data -- Examining data.
files -- Specifying and examining files.
internals -- Maintenance commands.
obscure -- Obscure features.
running -- Running the program.
stack -- Examining the stack.
status -- Status inquiries.
support -- Support facilities.
tracepoints -- Tracing of program execution without stopping the program.
user-defined -- User-defined commands.

Type "help" followed by a class name for a list of commands in that class.
Type "help all" for the list of all commands.
Type "help" followed by command name for full documentation.
Type "apropos word" to search for commands related to "word".
Type "apropos -v word" for full documentation of commands related to "word".
Command name abbreviations are allowed if unambiguous.
可以看到所有gdb命令的分类, 并非gdb命令, 如果想查看所有断点相关命令,输入help breakpoints即可查看。
gdb中可以不用打命令的全名。支持两次敲击tab键的命令补全:
(gdb) b   再敲击两次TAB
backtrace    bookmark     break        break-range  bt
在进入函数func时,设置一个断点(我觉得可能很有用)。可以敲入break func,或是直接就是b func:
(gdb) b func
Breakpoint 2 at 0x7a0: file txt.c, line 5.
如果你只记得函数前几个字母,也可也TAB补全操作,如下例子,gdb会列出程序中所有f开头的函数:
(gdb) b f   再敲击两次TAB
frame_dummy  func
退出gdb时,打quit或命令简称q就行了。
4. GDB 中运行UNIX的shell程序
为方便调试,GDB 中还可以运行UNIX的shell程序,有两种方法,一种为shell <cmd>,另一种!<cmd>,例子如下:
(gdb) shell ls  等价于!ls
fault_app.c  fault_app.out  faulty_module.ko  txt.c  txt.out
(gdb) shell ifconfig 等价于!ifconfig
可以在gdb中执行‘make’命令来重新build自己的程序。这个命令等价于shell make。
5. 在GDB中运行程序常用指令
进入gdb调试界面后,你可能需要做以下几个方面的事情,首先list看看能否列出源代码,运行程序是run或r命令。不过在运行前,你可能需要有以下几个方面需要设置:
- 设置程序运行参数
set args可以指定运行参数
show args可查看设定好的运行参数
(gdb) set args 10 hello world
(gdb) show args
Argument list to give program being debugged when it is started is "10 hello world".
-
运行环境设置
path可设定程序的运行路径。
show paths查看程序的运行路径。
设置环境变量。如:set env USER=benben
show env查看所有环境变量。
show env [varname]查看指定环境变量 -
工作目录。
cd相当于shell的cd命令。
pwd显示当前的所在目录 -
程序的输入输出
info terminal显示你程序用到的终端的模式。
(gdb) info terminal
No saved terminal information.
run > outfile
不过最好不要在gdb中使用vi, 容易乱套。
tty命令可以设置输入输出使用的终端设备。如:tty /dev/tty1
-
调试已运行的程序,还能这样玩?
ps查看正在运行的程序的PID(进程ID),然后gdb PID process-id 格式挂接正在运行的程序。 -
暂停恢复程序运行
info program: 当程序被暂停,执行该命令可查看被暂停的位置,进程号,被暂停的原因
c: 继续运行程序。
(gdb) info program
Last stopped for thread 1 (Thread 0xfffff7ff1d60 (LWP 1862)). //这个是1862就是进程号哦
        Using the running image of child process 1862.
Program stopped at 0xaaaaaaaa087c.
It stopped at breakpoint 1.
It stopped at breakpoint 2.
Type "info stack" or "info registers" for more information.
(gdb) c //示意程序继续运行,continue 的简写
Continuing.
result[1-250] = 5050
result[1-100] = 5050
gdb中暂停方式:断点(BreakPoint)、观察点(WatchPoint)、捕捉点(CatchPoint)、信号(Signals)、线程停止(Thread Stops),如果要恢复程序运行,可以使用c或是continue命令。
此后有一系列内容使用gdb调试复杂程序,非常多,但我可能长时间用不到gdb,先入门到这里。


 2202
2202

 被折叠的 条评论
为什么被折叠?
被折叠的 条评论
为什么被折叠?
 到【灌水乐园】发言


