


1 背景
前两天软件同事反应在使用单GDB调试我们四核CPU(RISC-V,64位)时,对设置软断点后再continue后的行为不太理解,和以前调试单核CPU的行为不太一致,因此我在ZEBU平台做下复现工作,然后结合行为和波形分析Debug Module。
2 现象
2.1 openocd配置
下面是使用的openocd配置文件。
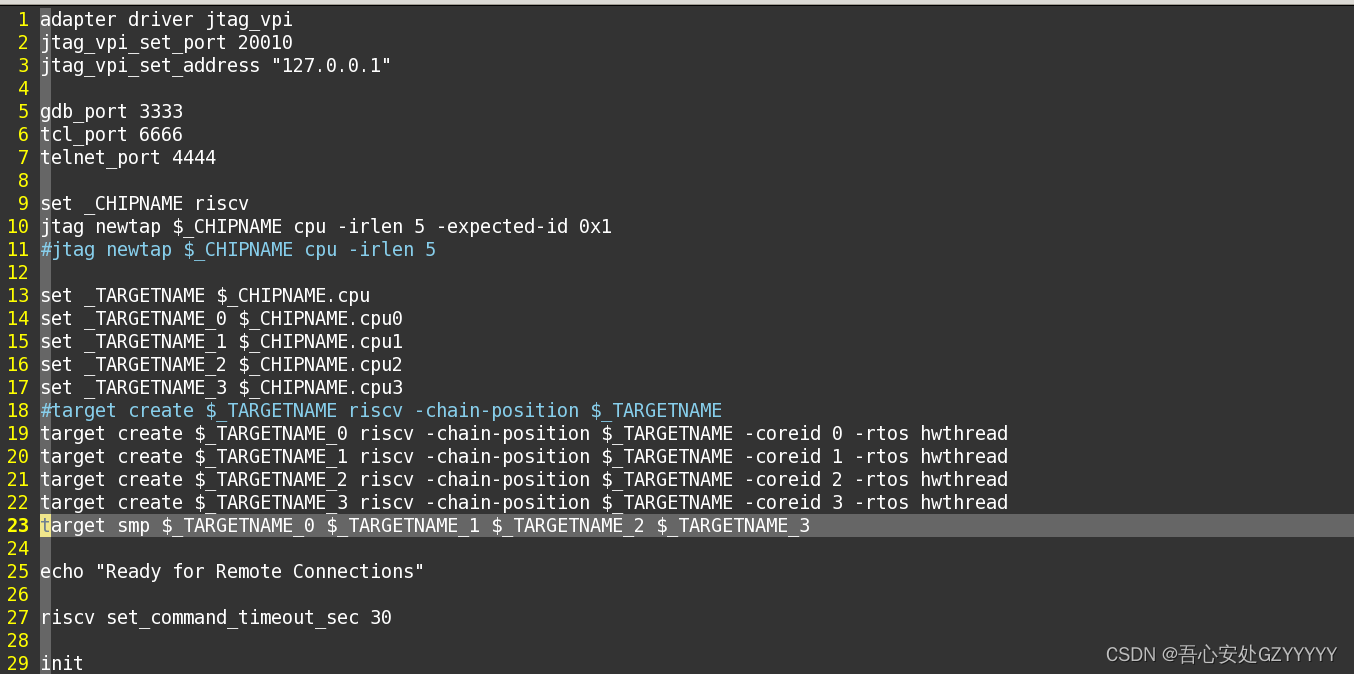
上面需要注意的是第23行的openocd命令:
target smp $_TARGETNAME_0 $_TARGETNAME_1 $_TARGETNAME_2 $_TARGETNAME_3
查询官方的openocd手册,该命令的行为如下:
1.a set of hardware breakpoint sets the same breakpoint on all targets in the list.
2.halt command triggers the halt of all targets in the list.
3.resume command triggers the write context and the restart of all targets in the list.
4.following a breakpoint: the target stopped by the breakpoint is displayed to the GDB
session.
5. dedicated GDB serial protocol packets are implemented for switching/retrieving the
target displayed by the GDB session see [Using OpenOCD SMP with GDB], page 179.
上面179页的内容如下:
OpenOCD includes a pseudo RTOS called hwthread that presents CPU cores (“hardware
threads”) in an SMP system as threads to GDB. With this extension, GDB can be used to
inspect the state of an SMP system in a natural way. After halting the system, using the
GDB command info threads will list the context of each active CPU core in the system.
GDB’s thread command can be used to switch the view to a different CPU core. The step
and stepi commands can be used to step a specific core while other cores are free-running
or remain halted, depending on the scheduler-locking mode configured in GDB.
2.2 GDB操作和现象
前面已经load好程序,并且四个进程的PC都为0x8000_0000。下面是GDB的命令和现象:
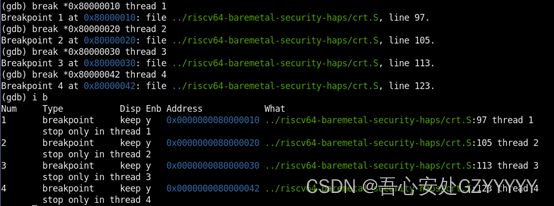
step1:通过gdb往四个thread上打软断点,其中thread1对应core0,thread4对应core3。打在core0上的软断点的PC为0x80000010,其余核依次在0x80000020,0x80000030,0x80000042上打上软断点。
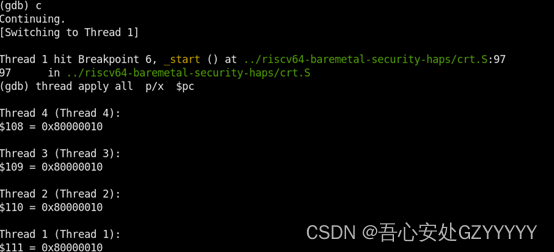
step2:GDB第一次发送continue命令,发现core0 命中了软断点,同时四个核都停在了第一个软断点位置0x80000010处。这是由于thread 1(core 0)在设置断点时会把ebreak指令替换0x80000010处的指令,同时gdb的命令会让core执行fence和fencei指令,由于shared的LLC,其他核的0x8000_0010的指令都会变为ebreak,所以都会在这个PC进入debug mode。

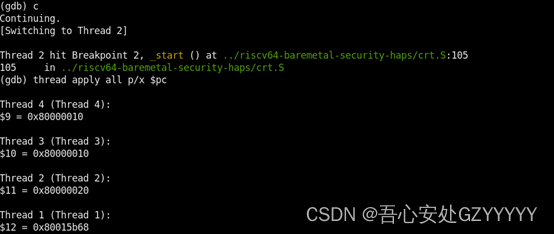
step3:GDB第二次发送continue命令,发现core1命中了软断点0x80000020,core0的PC停在了一个未知的地方,而core2和core3的PC还是停在0x80000010处。

GDB 命令,参考官方GDB文档:
break locspec thread thread-id
Use the qualifier ‘thread thread-id’ with a breakpoint command to specify
that you only want gdb to stop the program when a particular thread reaches
this breakpoint. The thread-id specifier is one of the thread identifiers assigned
by gdb, shown in the first column of the ‘info threads’ display.
3 分析
首先解释当遇见一个软断点后,GDB再次发送continue 命令的行为:
- 把原始指令回填到原PC处;具体是上位机在设置软断点时会把相应PC的指令读取并存储,此时会把写回的PC和指令编码放到abstruct data0/1寄存器,通过programbuffer来执行store指令,将原指令写回;然后通过fence和带广播的fence.i功能将其写到外面的内存中;
- 执行一次硬件single step;这样做首先是执行了原始指令,保持了原始程序的正确执行;然后是把dpc设置为下一条指令的PC;
- 把ebreak指令再写回原PC;然后通过fence和带广播的fence.i功能将其写到外面的内存中,这样保证了该软断点一直存在;
- 执行Resume操作。
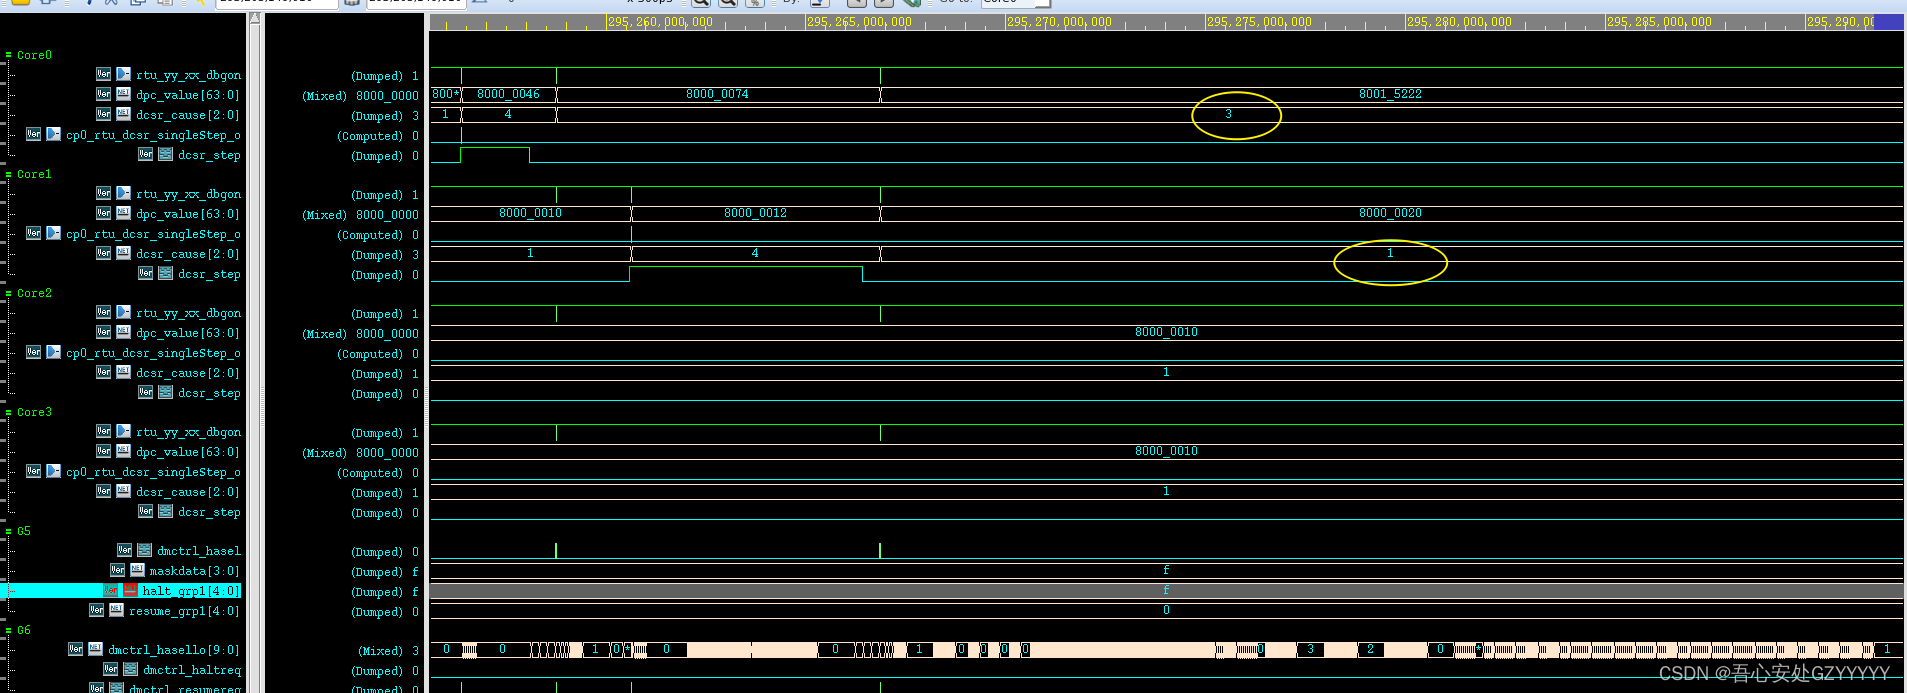
现在分析,gdb跑时出现的现象,设置好软断点后,四个核起始PC都为0x80000000,gdb发出continue时,四个核一起resume。这里补充一下,由于是单GDB调试多核,采用了target smp xxx配置,这种配置的特点是当一个核halt时,其他三个核都会halt住(haltgroup方式);当一个核resume时,其他几个核都会一起resume(hasel + maskdata方式)。又结合上面分析的shared llc,所以gdb会在第一个断点处0x80000010停住,同时打印所有核的PC寄存器,可以发现都为0x80000010。读四个核的dscr寄存器,其中的cause寄存器都为0x1,可确定都为ebreak指令的原因进入debug mode。

再次输入continue命令,现象如下所示,core1命中到了0x80000020的断点,core0已经跑到了程序的后面,而core2和core3的PC还是为0x80000010。
继续分析波形,可以看出gdb的continue命令包含的所有动作:
对于core0来说,此刻还有四个软断点(ebreak),core0收到来自于GDB的命令是:1.把0x80000010处的原来指令写回;2.通过single step来执行原来的指令;3.把ebreak指令写回0x80000010处;4.resume。因为core0上有四个软断点,所以core0上会重复上面的步骤四次。在core0重复执行上面4个步骤时,其他三个core只会在动作4时resume一下,然后由于软断点ebreak的原因,再次进入debug mode。这里补充一下,在core0由于动作2单步调试resume时,其他三个核是不会一起resume的,这是由于target smp时,step和stepi只针对于当前GDB所选中的thread。

对于core1来说,当GDB发完对于core0上述四次重复的动作后,会对core1来发送命令。此时core1由于core0设的软断点还停留在0x80000010处,所以GDB会发出四个动作跳出0x80000010,然后hit到core1设置的软断点0x80000020处,从而进入debug mode。对于core0来说,由于halt group的原因,当core1由于软断点(ebreak,cause=1)halt时,core0也会被halt住(halt,cause=3),所以此时core0停下时的PC是不定的。
对于core2和core3来说,在core1由于hit到自己的软断点进入debug mode时,core2和core3一直是由于0x80000010处的软断点一直在重复的resume和halt。
至于再次continue两次的动作是和前面类似的,第三次continue时,core2会停在0x80000030处,core0和core1的PC不定,core3的PC为0x80000010; 第四次continue时,core3会停在0x80000042处,core0、core1和core2的PC不定。
那为什么GDB对于每个continue命令发出的子动作不一样呢?其实上面break xxx thread id的命令已经解释了,当软断点打在特定的thread/core上,那么GDB期望的行为是,只能是特定的thread/core上停在特定的PC处。
4 总结
从上面分析完之后,才看出对于GDB而言,尤其是单GDB调试多核时,对于相同的命令在不同的场景下,发出的jtag动作是不一样的。按照以往单核调试的经验可能会遇见些问题,但其实也有迹可循,GDB的官方文档中其实写好了期望的行为,在多次反复阅读并结合实际波形分析后才发现行为都符合官方文档描述。
题外话:上面有些波形截图不是很清晰,我试了很多次发现都被压缩了,凑合看吧。
5 参考文档
[1] riscv官方文档:riscv-spec-20191213.
[2] RISC-V Debug Support(Version 1.0.0-STABLE)
[3] Debugging with gdb (Tenth Edition, for gdb version 13.0.50.20220711-git)
[4] Open On-Chip Debugger: OpenOCD User’s Guide(for release 0.11.0+dev 20 June 2022)


 320
320


 被折叠的 条评论
为什么被折叠?
被折叠的 条评论
为什么被折叠?
 到【灌水乐园】发言


