


继续跟进上一章节的内容,上一章节讲到了n9e生产环境安装,本章节主要是讲 exporter的安装、出图、告警。
下面就开始进行常用指标采集工具安装、告警、出图~
1 主机监控
这里是用的n9e官方推荐的categraf。
1.1 安装、出图
上一章节里,已经把主机监控的categraf工具的安装已经讲过了,出图也告知直接导入n9e自带的图(名称为: linux_by_categraf)了,但是没有讲告警这一块,所以下面补充一下。
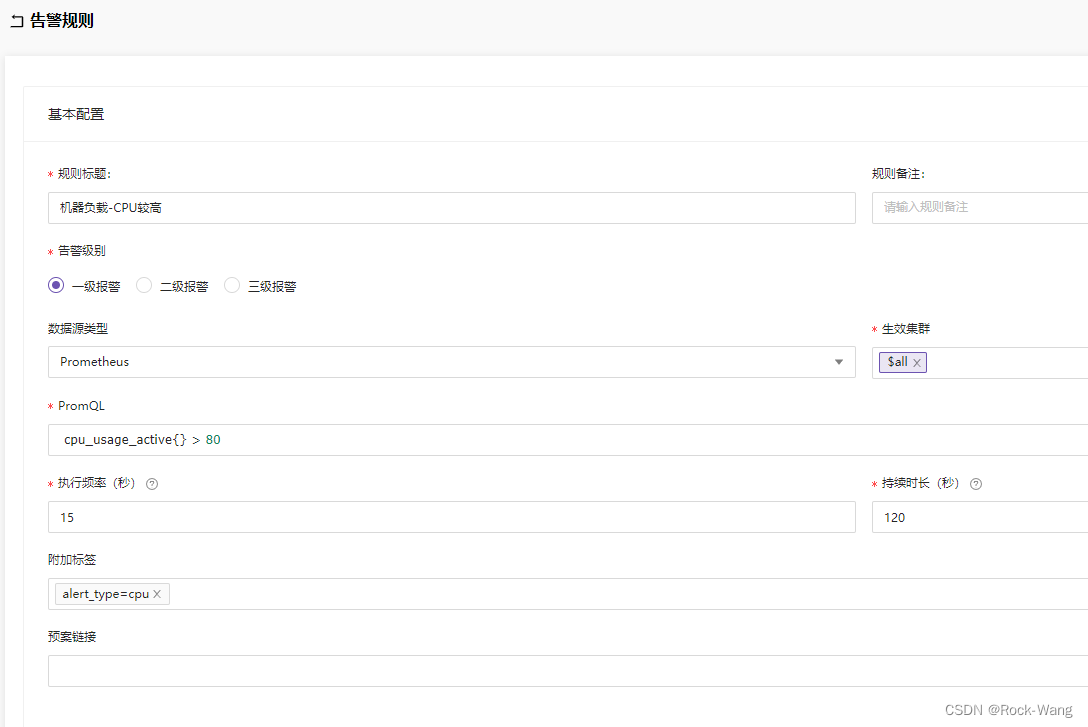
1.2 告警
- 机器负载-CPU较高
名称: 磁盘根分区使用率较高
PromSQL: disk_used_percent{path="/"} > 80
alert_type=disk
level: 2
- 磁盘根分区使用率较高
名称: 磁盘根分区使用率较高
PromSQL: disk_used_percent{path="/"} > 80
alert_type=disk
level: 2
- 监控对象失联
名称: 监控对象失联
PromSQL: avg_over_time(up{source="categraf"}[1m]) < 1
alert_type=host
level: 1
- 机器负载-uptime高
名称: 机器负载-uptime高
PromSQL: system_load1 > 1000
alert_type=cpu
level: 1
- 机器负载-iowait使用率
名称: 机器负载-iowait使用率
PromSQL: avg_over_time(cpu_usage_iowait[5m]) > 90
alert_type=io
level: 1
2 k8s监控
我们服务在运行过程中,想了解服务运行状态,pod有没有重启,伸缩有没有成功,pod的状态是怎么样的等,这时就需要kube-state-metrics,它主要关注deployment,、node 、 pod等内部对象的状态。而metrics-server 主要用于监测node,pod等的CPU,内存,网络等系统指标。
所以,kube-state-metrics算是k8s资源监控的一个很棒的工具,这里就安装它了。
2.1 安装
2.1.1 下载chart
大家可以直接到 https://github.com/prometheus-community/helm-charts/ 里面去找所有的charts包

# helm repo add prometheus-community https://prometheus-community.github.io/helm-charts
prometheus-community            https://prometheus-community.github.io/helm-charts

# helm search  repo  prometheus-community
NAME                                                    CHART VERSION   APP VERSION     DESCRIPTION
prometheus-community/alertmanager                       0.27.0          v0.25.0         The Alertmanager handles alerts sent by client ...
prometheus-community/alertmanager-snmp-notifier         0.1.0           v1.4.0          The SNMP Notifier handles alerts coming from Pr...
prometheus-community/jiralert                           1.2.0           v1.3.0          A Helm chart for Kubernetes to install jiralert
prometheus-community/kube-prometheus-stack              45.9.1          v0.63.0         kube-prometheus-stack collects Kubernetes manif...
prometheus-community/kube-state-metrics                 5.3.0           2.8.2           Install kube-state-metrics to generate and expo...
prometheus-community/prom-label-proxy                   0.2.0           v0.6.0          A proxy that enforces a given label in a given ...
prometheus-community/prometheus                         20.2.0          v2.43.0         Prometheus is a monitoring system and time seri...
prometheus-community/prometheus-adapter                 4.1.1           v0.10.0         A Helm chart for k8s prometheus adapter
prometheus-community/prometheus-blackbox-exporter       7.7.0           0.23.0          Prometheus Blackbox Exporter

# helm repo update
# helm fetch prometheus-community/kube-state-metrics --version 5.3.0
2.1.2 安装
# tar xf kube-state-metrics-5.3.0.tgz
# cd kube-state-metrics
# helm upgrade -i kube-state-mertics --namespace=monitoring .
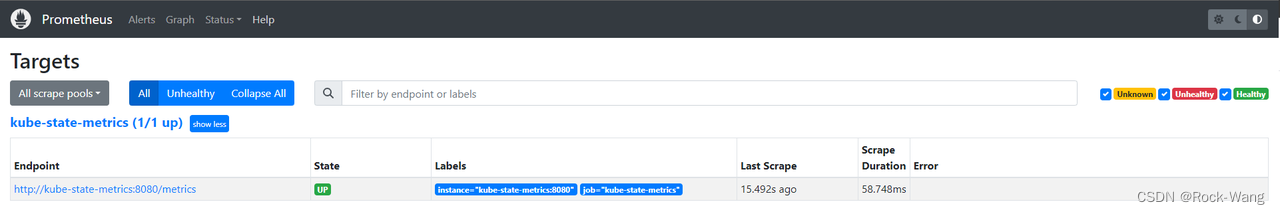
2.1.3 配置prometheus接入kube-state-metrics
将kube-state-metrics的地址添加到prometheus中用于被监控到指标
# cd nightingale
# vim templates/prometheus/configmap.yaml
    scrape_configs:
      # The job name is added as a label `job=<job_name>` to any timeseries scraped from this config.
      - job_name: 'kube-state-metrics'
        static_configs:
        - targets: ['kube-state-metrics:8080']

重新更新服务后,重启 nightingale-prometheus-0 pod用于重载configmap中的prometheus.yaml ,然后到prometheus的targets中查看信息(如下图)
2.2 k8s pod出图
这个是n9e提供的官方pod图,总体还不错,但也有一些地方值得改进的,链接如下:
https://github.com/flashcatcloud/categraf/blob/main/k8s/pod-dash.json
后面我应该会单独出一章各种监控图的优化模板及优化思路,着急的同学可以留言或私聊我,我直接发给你哦~
2.3 k8s告警配置
关于kube-state-metrics的告警指标,我直接就引用了现成的,详细请见:https://samber.github.io/awesome-prometheus-alerts/rules.html#kubernetes
如果有这块告警不明白的,可以私聊找我~
下面提供一些比较常用的告警:
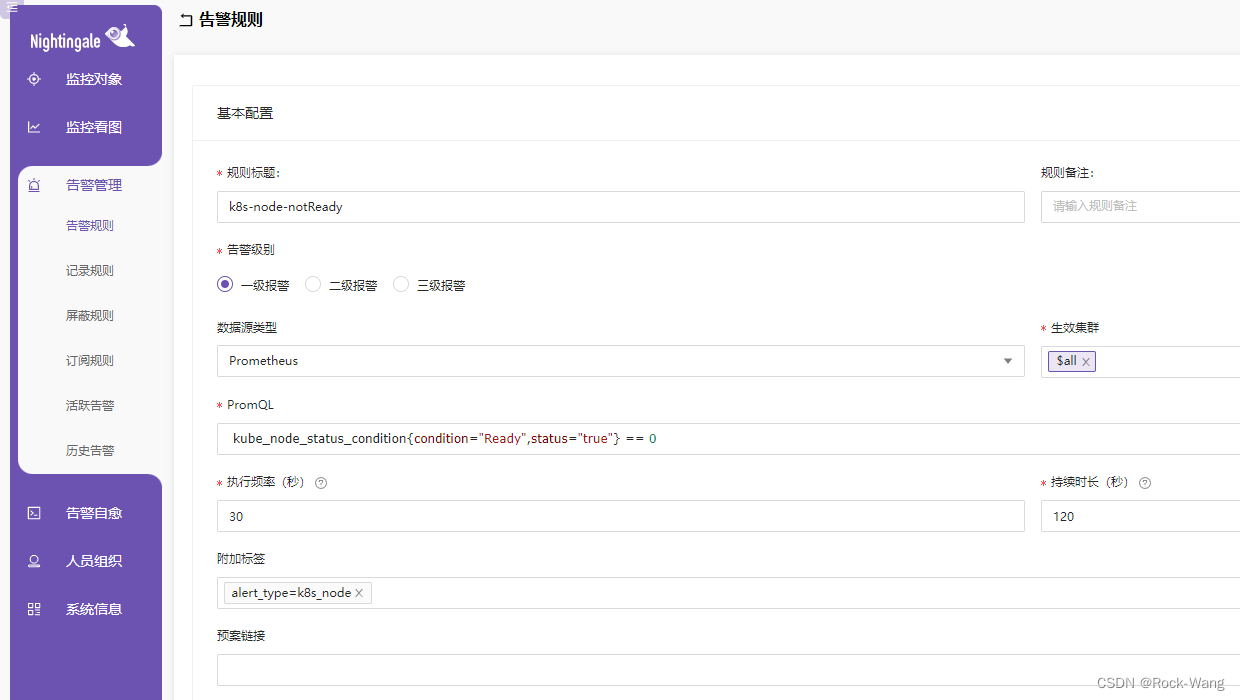
- K8sNodeNotReady
名称:k8s-node-notReady
PromSQL: kube_node_status_condition{condition="Ready",status="true"} == 0
alert_type=k8s_node
level: 1
- K8sMemoryPressure
名称:k8s-node-memoryPressure
PromSQL: kube_node_status_condition{condition="MemoryPressure",status="true"} == 1
alert_type=k8s_memory
level: 1
- K8sDiskPressure
名称:k8s-node-diskPressure
PromSQL: kube_node_status_condition{condition="DiskPressure",status="true"} == 1
alert_type=k8s_disk
level: 1
- K8sNetworkUnavailable
名称:k8s-node-networkUnavailable
PromSQL: kube_node_status_condition{condition="NetworkUnavailable",status="true"} == 1
alert_type=k8s_network
level: 1
- K8sContainerOomKiller
名称:k8s-pod-oom
PromSQL: (kube_pod_container_status_restarts_total - kube_pod_container_status_restarts_total offset 10m >= 1) and ignoring (reason) min_over_time(kube_pod_container_status_last_terminated_reason{reason="OOMKilled"}[10m]) == 1
alert_type=k8s_pod
level: 3
- K8sPodCrashLooping
名称:k8s-pod-nothealthy
PromSQL: sum (avg_over_time(kube_pod_status_phase{phase=~"Pending|Unknown|Failed", pod!~"helm-operation.*"}[5m]))  by (namespace, pod,phase) > 0
alert_type=k8s_pod
level: 2
执行频率:30 秒
持续时长:150 秒
- K8sClientCertificateExpiresSoon
名称:k8s-client-certificateExpiresSoon
PromSQL: apiserver_client_certificate_expiration_seconds_count{job="categraf"} > 0 and histogram_quantile(0.01, sum by (job, le) (rate(apiserver_client_certificate_expiration_seconds_bucket{job="categraf"}[5m]))) < 24*60*60
alert_type=k8s_ca
level: 1
3 显卡监控
3.1 安装
3.1.1 下载chart
# helm fetch http://utkuozdemir.org/helm-charts/nvidia-gpu-exporter-0.3.1.tgz
# tar xf nvidia-gpu-exporter-v0.3.1.tgz
# cd nvidia-gpu-exporter
3.1.2 配置
添加hostNetWork配置,这样便于被Prometheus读取指标
# vim templates/daemonset.yaml
spec:
... ...
  template:
  ... ...
    spec:
      hostNetwork: true
3.1.3 安装
# helm upgrade -i nvidia-exporter --namespace=monitoring .
3.1.4 配置prometheus接入nvidia-exporter
因为前面配置了hostNetwork,这里直接通过 ip:port 进行指标获取了
# cd nighting/templates/prometheus
# vim configmap.yaml
    scrape_configs:
      # The job name is added as a label `job=<job_name>` to any timeseries scraped from this config.
      - job_name: 'kube-state-metrics'
        static_configs:
        - targets: ['kube-state-metrics:8080']
      - job_name: 'nvidia-gpu-exporter'
        static_configs:
        - targets: ['172.18.5.2:9835', '172.18.5.3:9835', '172.18.5.4:9835', '172.18.5.5:9835',  '172.18.5.6:9835']

重新更新服务后,重启 nightingale-prometheus-0 pod用于重载configmap中的prometheus.yaml
3.1.5 target验证
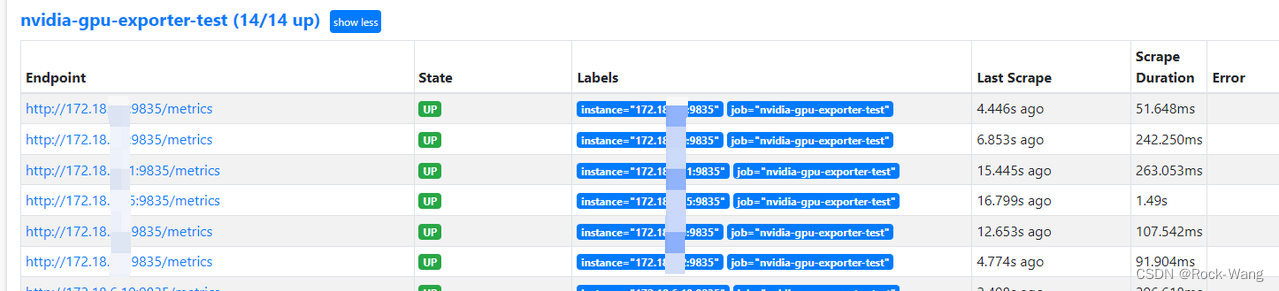
3.2 出图
我这里直接导入了Grafana的 14574 这个图,但这个json模板有点问题,需要简单改一下,具体如下:
- 1)配置模板的名称。
"name": "nvidia-gpu", # 修改模板的名称
-
- 新增instance这个变量,用于gpu下拉选择时的sql查询条件。
            {
                "type": "query",
                "name": "instance", # 此段json是新增的,原因是需要先选择instance机器,再到下面选择对应的gpu的uuid。
                "definition": "label_values(nvidia_smi_index, instance)",
                "allOption": false,
                "multi": false,
                "reg": ""
            },
- 3)gpu变量中,增加instance这个变量查询条件
"definition": "label_values(nvidia_smi_index{instance=\"$instance\"}, uuid)",
- 4)将Name图中的 nvidia_smi_gpu_info 改为 nvidia_smi_index,不然拿不到显卡的ID
        "panels": [
            {
                "version": "2.0.0",
                "id": "c15d9abb-4a9d-4a5a-ad05-ec79ed260d83",
                "type": "stat",
                "name": "Name",  # 大盘图中,显示当前机器的显卡的ID,如0/1/2/3
                "description": "The official product name of the GPU. This is an alphanumeric string. For all products.",
                "links": [],
                "layout": {
                    "h": 3,
                    "w": 4,
                    "x": 0,
                    "y": 0,
                    "i": "c15d9abb-4a9d-4a5a-ad05-ec79ed260d83"
                },
                "targets": [
                    {
                        "refId": "A",
                        "expr": "nvidia_smi_index{uuid=\"$gpu\"}",  # 将 nvidia_smi_gpu_info 改为 nvidia_smi_index,不然拿不到显卡的ID
                        "legend": "{{name}}"
                    }
                ],
后面我应该会单独出一章各种监控图的优化模板及优化思路,着急的同学可以留言或私聊我,我直接发给你哦~
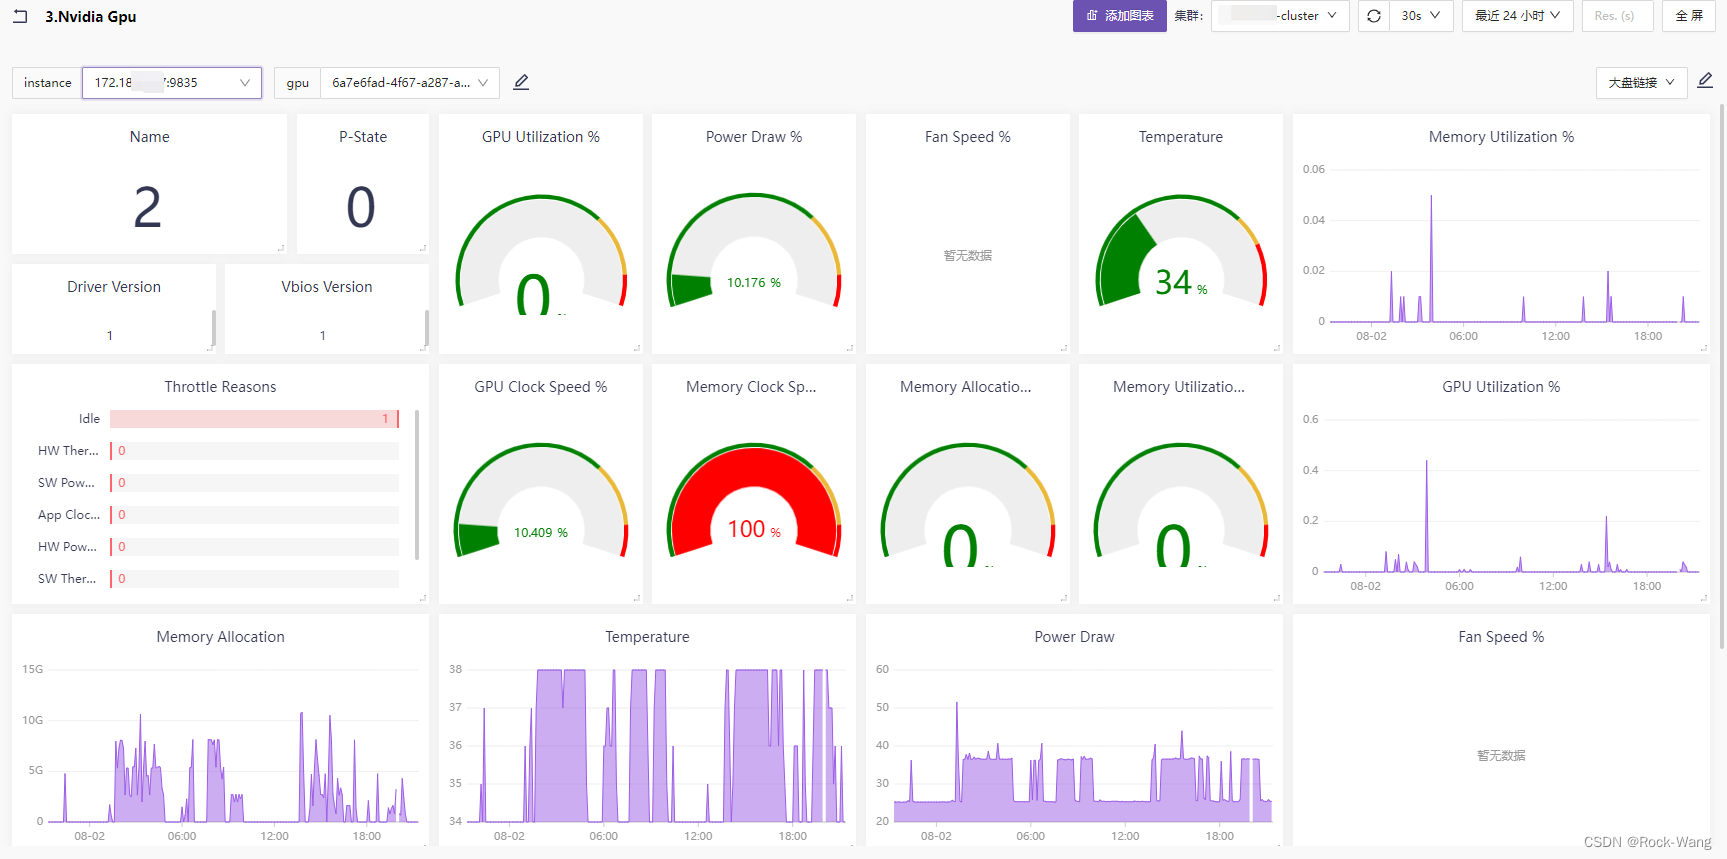
- 效果图如下
3.3 告警
- 显卡状态检查
名称: 未检测到gpu
PromSQL: nvidia_smi_failed_scrapes_total > 0
alert_type=gpu
level: 2
- gpu温度
名称: gpu温度高
PromSQL: nvidia_smi_temperature_gpu > 80
alert_type=gpu
level: 2
- gpu使用率
名称: gpu使用率高
PromSQL: nvidia_smi_utilization_gpu_ratio * 100 > 80
alert_type=gpu
level: 2
- gpu内存使用率
名称: gpu内存高
PromSQL: nvidia_smi_utilization_memory_ratio * 100 > 80
alert_type=gpu
level: 2
好了,这一章节的内容也挺多的,但有一些指标(如:ceph、minio、juicefs等)的监控还没讲到。
以及n9e的ibex自愈、blackbox的http/证书等监测、prometheus-gateway的巧用等,就放到后面的章节再说了。
感谢大家的关注,如有任何问题请留言,我会第一时间回复,再次感谢 么么哒~


 1724
1724


 被折叠的 条评论
为什么被折叠?
被折叠的 条评论
为什么被折叠?
 到【灌水乐园】发言


