


1 prometheus-pushgateway
1.1 前言
-
问题1:什么是prometheus-pushgateway?
-
答:prometheus-pushgateway是prometheus的一个组件,prometheus server默认是通过采集器(exporter)主动获取数据(默认是通过pull拉取数据),而prometheus-gateway则是通过被动方式推送数据到prometheus server。那么用户可以写一些自定义的监控脚本把需要的监控数据发送给prometheus-pushgateway, 然后pushgateway再把数据发送给Prometheus server
-
问题2:为什么要使用prometheus-gateway?
-
答:因为在部分场景下,没有对应的采集器能采集到我们需要的数据,但这个数据对我们很重要,那就得让prometheus-gateway上场了。我们可以自定义一些脚本(例如shell、python脚本),定时的获取数据,并调用pushgateway的接口,将数据推送到prometheus server上。这样我们就可以调用prometheus进行出图、告警了。
1.2 安装
# helm repo add prometheus-community https://prometheus-community.github.io/helm-charts
# helm repo update
# helm search repo prometheus-community/prometheus-pushgateway
NAME                                            CHART VERSION   APP VERSION     DESCRIPTION
prometheus-community/prometheus-pushgateway     2.1.3           v1.5.1          A Helm chart for prometheus pushgateway
# helm fetch prometheus-community/prometheus-pushgateway --version v1.5.1
# helm upgrade -i prometheus-pushgateway -n monitoring .
1.3 配置prometheus接入pushgateway
# kubectl get svc -n monitoring | grep push
prometheus-pushgateway   ClusterIP   10.233.46.144   <none>        9091/TCP         37s

# vim nightingale/templates/prometheus/configmap.yaml
    scrape_configs:
      - job_name: 'prometheus-pushgateway'
        static_configs:
        - targets: ['prometheus-pushgateway:9091']

重新更新n9e服务后,重启 nightingale-prometheus-0 pod用于重载configmap中的prometheus.yaml ,然后到prometheus的targets中查看信息
# helm upgrade -i nightingale --namespace=monitoring .  # 更新部署n9e
# kubectl delete pods -n monitoring nightingale-prometheus-0  # 重启prometheus

1.4 使用脚本进行推送数据及告警
- 命令格式与参数解释
我这里的脚本逻辑是: 获取pod内显卡状态,并将状态信息发送给prometheus

命令格式:
正常命令: echo "nvidia_smi_cmd_pod_status 0" | curl --data-binary @- http://127.0.0.1:30094/metrics/job/prometheus-pushgateway/cluster/ops-k8s-cluster/instance/ops-k8s-1/pod_name/gpu-server-0
脚本命令: echo "$label 0" | curl --data-binary @- http://${prometheus_pushgateway}/metrics/job/${prometheus_pushgateway_job}/cluster/${cluster}/instance/${node_name}/pod_name/${pod}

参数解释:
"nvidia_smi_cmd_pod_status 0": 是指标名称,这里之所以是变量是因为下面脚本里定义的。0表示这个指标的结果。
"http://127.0.0.1:30094/metrics/job/prometheus-pushgateway/cluster/ops-k8s-cluster/instance/ops-k8s-1/pod_name/gpu-server-0":
  调用 127.0.0.1:30094 这个pushgateway的接口
  job名称: prometheus-pushgateway,自定义的,可以随便命名。
  cluster名称: ops-k8s-cluster,自定义的,可以随便命名。
  instance名称: ops-k8s-1,自定义的,可以随便命名。
  pod_name名称: gpu-server-0,自定义的,可以随便命名。
- 脚本
脚本如下:
# cd /usr/local/monitoring
# vim verify_pod_nvidia_smi_cmd.sh
#!/bin/bash
cluster="ops-k8s-cluster"
namespace="gpu"
suffix="-0"

prometheus_pushgateway="172.18.5.xx:30094"  # 当前上报的 prometheus-gateway 地址
prometheus_pushgateway_job="prometheus-pushgateway"
label="nvidia_smi_cmd_pod_status"  #定义key名

log_dir="/var/log/verify_pod_nvidia_smi_cmd.log"

function verify(){
  echo -e "\n===========================================================================\n" >> ${log_dir}
  #/usr/local/bin/kubectl get pods -n ${namespace} -o wide >> ${log_dir}
  # kubectl get pods -n kubeflow-user-example-com | awk '{print $1}' | grep '\-0$'
  pods=`/usr/local/bin/kubectl get pods -n ${namespace} | awk '{print $1}' | grep '\-0$'`
  for pod in $pods
  do
    count=`/usr/local/bin/kubectl exec -it -n ${namespace} $pod -- nvidia-smi | grep 'Failed to initialize NVML: Unknown Error' | wc -l`
    kubectl get pods -n $namespace $pod -o wide | sed 1d >> ${log_dir}
    node_name=`/usr/local/bin/kubectl get pods -n ${namespace} $pod -o wide | grep -o 'ops-k8s-[0-9]*'`
    if [ $count -gt 0 ];then
      echo -e "Error: `date +%F-%T` pod [$pod] [${node_name}] nvidia-smi command execute failed !" >> ${log_dir}
      /usr/local/bin/kubectl delete pods -n $namespace $pod &  # 测试可不打开
      echo -e "Error: `date +%F-%T` kubectl delete pods -n $namespace $pod\n" >> ${log_dir}
      echo -e "Error: `date +%F-%T` kubectl delete pods -n $namespace $pod\n"
      echo "$label 1" | curl --data-binary @- http://${prometheus_pushgateway}/metrics/job/${prometheus_pushgateway_job}/instance/${node_name}/pod_name/${pod}
    else
      echo -e "Info: `date +%F-%T` pod [$pod] [${node_name}] nvidia-smi command execute successful !" >> ${log_dir}
      echo -e "Info: `date +%F-%T` pod [$pod] [${node_name}] nvidia-smi command execute successful !"
      echo "$label 0" | curl --data-binary @- http://${prometheus_pushgateway}/metrics/job/${prometheus_pushgateway_job}/cluster/${cluster}/instance/${node_name}/pod_name/${pod}
    fi
  done
}

verify
- 添加到定时任务
# crontab -e
# Verify the status of the gpu-worker pods nvidiam_smi command of the namespace gpu
*/10 * * * * bash /usr/local/monitoring/verify_pod_nvidia_smi_cmd.sh
1.5 告警配置
名称: gpu pod nvidia-smi命令执行失败
PromSQL: nvidia_smi_cmd_pod_status == 1
alert_type=gpu_pod
level: 2
2 ibex自愈
ibex自愈是n9e中的一个亮点,这也是运维同学们比较喜欢的一个产品,因为它可以在告警触发的时候进行一些策略操作,将告警问题进行自动化处理并解决。
对我而言,ibex很适合系统层面的问题修复(如磁盘问题),所以我会把这个服务以二进制的方式部署到每台宿主机上,进行自愈处理。
在安装之前,需要先说下,ibex分为server端和agent端。server主要是用于进行任务分发,agent端主要用于任务处理,这也是常用的server+agent端的逻辑。
2.1 server端安装
2.2.1 下载
下载:
# cd /usr/local/monitoring/
# wget https://github.com/flashcatcloud/ibex/releases/download/v1.0.0/ibex-1.0.0.tar.gz
# tar xf ibex-1.0.0.tar.gz
# cd ibex
# ln -s /usr/local/monitoring/ibex/ibex /usr/local/bin/ # 软链接
# ll
drwxr-xr-x  3 root root     4096 Mar 29 11:35 etc/
-rwxr-xr-x  1 root root 16105472 Nov 15  2021 ibex*
-rwxr-xr-x  1 root root     3679 Mar 28 17:31 ibex-run.sh*
drwxr-xr-x 15 root root     4096 Mar 29 16:22 meta/
-rwxr-xr-x  1 root root      179 Mar 17 15:20 run.sh*
drwxr-xr-x  2 root root     4096 Mar 16 14:50 sql/

# ll etc/
-rw-r--r-- 1 root root  758 Mar 16 15:52 agentd.conf
-rw-r--r-- 1 root root 1712 Mar 16 15:02 server.conf
drwxr-xr-x 2 root root 4096 Nov 15  2021 service/

# ll sql/

-rw-r--r-- 1 root root 35642 Nov 15  2021 ibex.sql


解压后,里面会有个sql/ibex.sql
我这里通过navicat,将sql/ibex.sql 导入到 n9e的mysql中,会单独创建一个ibex的数据库。
2.2.2 配置
主要配置mysql的连接和账号密码
# vim etc/server.conf
[MySQL]
# mysql address host:port
Address = "127.0.0.1:3306"
# mysql username
User = "root"
# mysql password
Password = "123456"
# database name
DBName = "ibex"
# connection params
Parameters = "charset=utf8mb4&parseTime=True&loc=Local&allowNativePasswords=true"
2.2.3 启动
- 后台运行方式:
# nohup ./ibex server & > /var/log/ibex/server.log &
- 守护进程方式:
# cat <<EOF >/etc/systemd/system/ibex-server.service
[Unit]
Description="ibex server"
After=network.target

[Service]
Type=simple
ExecStart=/usr/local/bin/ibex server
Restart=always
SuccessExitStatus=0

[Install]
WantedBy=multi-user.target
EOF

启动服务
# systemctl daemon-reload
# systemctl enable ibex-server
# systemctl start ibex-server
# systemctl status ibex-server
2.3 agent端
2.3.1 下载
和前面server端一样,使用的还是 https://github.com/flashcatcloud/ibex/releases/download/v1.0.0/ibex-1.0.0.tar.gz 文件,因为里面包含server端和agent端。
2.3.2 配置
# cd /usr/local/monitoring/ibex
# vim etc/agentd.conf
# debug, release
RunMode = "release"  # 这里改为release

# task meta storage dir
MetaDir = "./meta"

... ...

[Heartbeat]
# unit: ms
Interval = 1000
# rpc servers
Servers = ["172.20.0.16:20090"]  # 这里视情况,改为 ibex-server的地址和端口,我这里主n9e的ibex-server内网是:172.20.0.16
# $ip or $hostname or specified string
Host = "$hostname"   # 这里改为方便识别的主机名
2.3.3 启动
- 后台运行方式:
# nohup ./ibex agentd & > /var/log/ibex/agentd.log &
- 守护进程方式:
# cat <<EOF >/etc/systemd/system/ibex-agent.service
[Unit]
Description="ibex agent"
After=network.target

[Service]
Type=simple
ExecStart=/usr/local/bin/ibex agent
Restart=always
SuccessExitStatus=0

[Install]
WantedBy=multi-user.target
EOF

启动服务
# systemctl daemon-reload
# systemctl enable ibex-agent
# systemctl start ibex-agent
# systemctl status ibex-agent
2.4 更新n9e中的ibex配置
# cd nightingale
# vim templates/nwebapi/conf-cm.yaml
    [Ibex]
    Address = "http://172.20.0.16:10090"
    BasicAuthUser = "ibex"
    BasicAuthPass = "ibex"
    Timeout = 3000

# vim templates/nserver/conf-cm.yaml
    [Ibex]
    Address = "172.20.0.16:10090"
    BasicAuthUser = "ibex"
    BasicAuthPass = "ibex"
    Timeout = 3000

重新更新n9e服务,并重启n9e前后端服务pod,让配置生效
2.5 分发到其他节点安装agent
将当前的agent端的文件及配置发送到其他节点上,并更新及启动。
2.6 多集群之间调用链打通
要想多集群之间(网络不互通)的n9e与ibex调用链打通,需要达到如下3个条件(2.6.1~2.6.3),特殊情况还需要达到第4个条件(2.6.4)。
2.6.1 告警事件里需要有ident标签
示例告警如下:
级别状态: S2 Triggered
规则名称: k8s-volume-fullInFourDays
规则备注: 4天后磁盘预计会满
告警集群: ops-k8s-cluster
告警组: devops
监控指标:
  alert_type=k8s_volume
  ident=k8s-ops-1   # 这里要有ident标签
  instance=127.0.0.1:10250
  job=categraf
  namespace=alluxio
  rulename=k8s-volume-fullInFourDays
  source=categraf
触发时间: 2023-08-01 21:29:19
触发值: -18856808915557.01953
发送时间: 2023-08-01 21:29:19
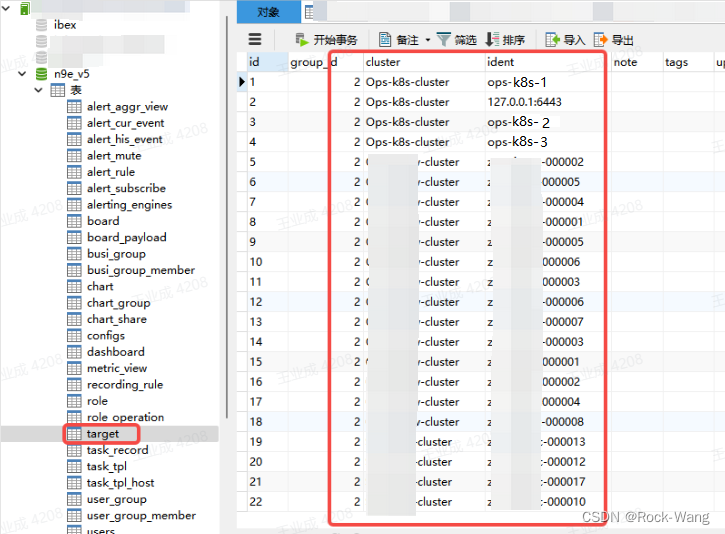
2.6.2 对应的机器需要出现在target表中
2.6.3 告警规则需要和机器在一个业务组
2.6.4 (额外补充)上面3项都正确,但依旧获取不到主机
经测试,配置了8.4.1~8.4.3,依旧获取不到主机,对应n9e-nserver服务有如下报错:
2023-03-29 16:02:25.390759 INFO engine/logger.go:19 event(dc89deed5268e055951c5b0e88d4d222 triggered) push_queue: rule_id=100 cluster:Ops-k8s-cluster [alert_type=test_disk device=sda4 fstype=xfs ident=ops-k8s-1 mode=rw path=/ rulename=test-磁盘测试 source=categraf]87.8691@1680076945
2023-03-29 16:02:25.404937 INFO engine/logger.go:19 event(dc89deed5268e055951c5b0e88d4d222 triggered) consume: rule_id=100 cluster:Ops-k8s-cluster [alert_type=test_disk device=sda4 fstype=xfs ident=ops-k8s-1 mode=rw path=/ rulename=test-磁盘测试 source=categraf]87.8691@1680076945
2023-03-29 16:02:25.415334 ERROR engine/callback.go:89 event_callback_ibex: failed to get host
2023-03-29 16:02:25.415357 ERROR engine/callback.go:89 event_callback_ibex: failed to get host

报错:event_callback_ibex: failed to get host
-
最终尝试通过debug源码进行解决,代码在 src/server/common/sender/callback.go 中报错的,测试发现是 host 一直没有赋值,然后我增加了两个配置,逻辑如下:
- 1、如果在主机上配置的 TargentIdent=,则将此值赋值给host。
- 2、如果没有配置TargentIdent,则将默认的ident值复制给host。
-
具体操作如下:
# vim src/server/common/sender/callback.go
... ...
const (
ident = "ident"
TargetIdent = "TargetIdent"
)
... ...
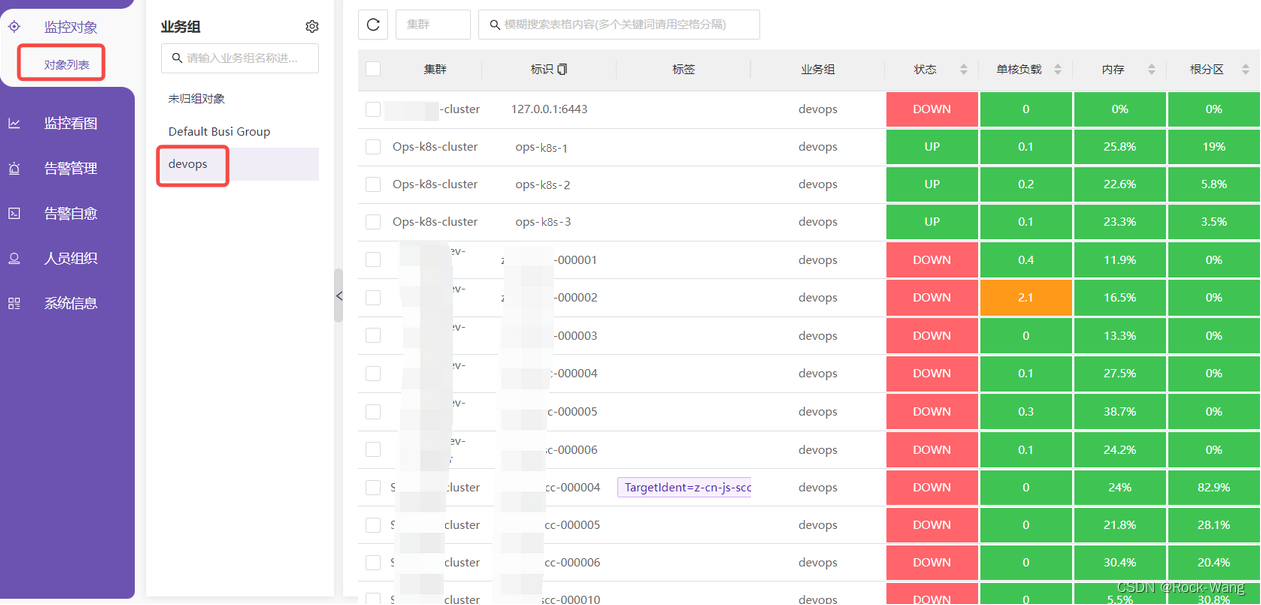
// 如果拿不到,可以在:监控对象-对象列表-对应业务组-添加标签(例如:TargetIdent=主机名),通过这种外部配置的方式拿到主机名
if host == "" {
for k, v := range event.TagsMap {
if k == TargetIdent {
logger.Info("event_callback_ibex: set TargetIdent = host")
//fmt.Printf("key: [%v], value: [%v]\n", k, v) // key: [TargetIdent], value: [k8s-ops-1]
host = v
}
}
}
// 如果没有配置TargetIdent, 则直接拿ident
if host == "" {
for k, v := range event.TagsMap {
if k == ident {
logger.Info("event_callback_ibex: set ident = host")
host = v
}
}
}
if host == "" {
logger.Error("event_callback_ibex: failed to get host")
logger.Error("event_callback_ibex: You can set TargetIdent=<hostname> to host tag(监控对象-对象列表-对应业务组-添加标签(例如:TargetIdent=主机名)")
return
}
- 编译构建
# cd /data/gopath/src/github.com/ccfos
# git clone https://github.com/ccfos/nightingale.git
# cd nightingale

# sh fe.sh   # ==> 将数据放到pub中(这里的应该是大盘的模板)
执行有问题,可以直接下载:
# wget https://github.com/n9e/fe-v5/releases/download/v5.15.0/n9e-fe-5.15.0.tar.gz
# tar xf n9e-fe-5.15.0.tar.gz
解压后生成新目录为: pub


# cd src/
# go build -o ../n9e .   # ==> 生成n9e 二进制文件
# cd ../docker/

此处可以先把build.sh 脚本修改下(改为自己定义的镜像地址):
# vim build.sh
#!/bin/sh
if [ $# -ne 1 ]; then
        echo "$0 <tag>"
        exit 0
fi

tag=$1
echo "tag: ${tag}"

rm -rf n9e pub
cp ../n9e .
cp -r ../pub .

#docker build -t nightingale:${tag} .
docker build -t 127.0.0.1:5443/devops/flashcatcloud/nightingale:${tag} .
#docker tag nightingale:${tag} ulric2019/nightingale:${tag}
#docker push ulric2019/nightingale:${tag}
docker push 127.0.0.1:5443/devops/flashcatcloud/nightingale:${tag}
rm -rf n9e pub


执行脚本生成镜像:
# sh build.sh v1.1  # ==> docker构建镜像,提供一个tag为v1.1。如果文件格式有问题,可以用 vim进去后, :set ff=unix进行格式化

然后替换镜像,重新部署n9e
然后到 对象列表 中,将所有主机配置标签 TargentIdent=主机名(这样才可以让代码获取到这个标签),示例如下:

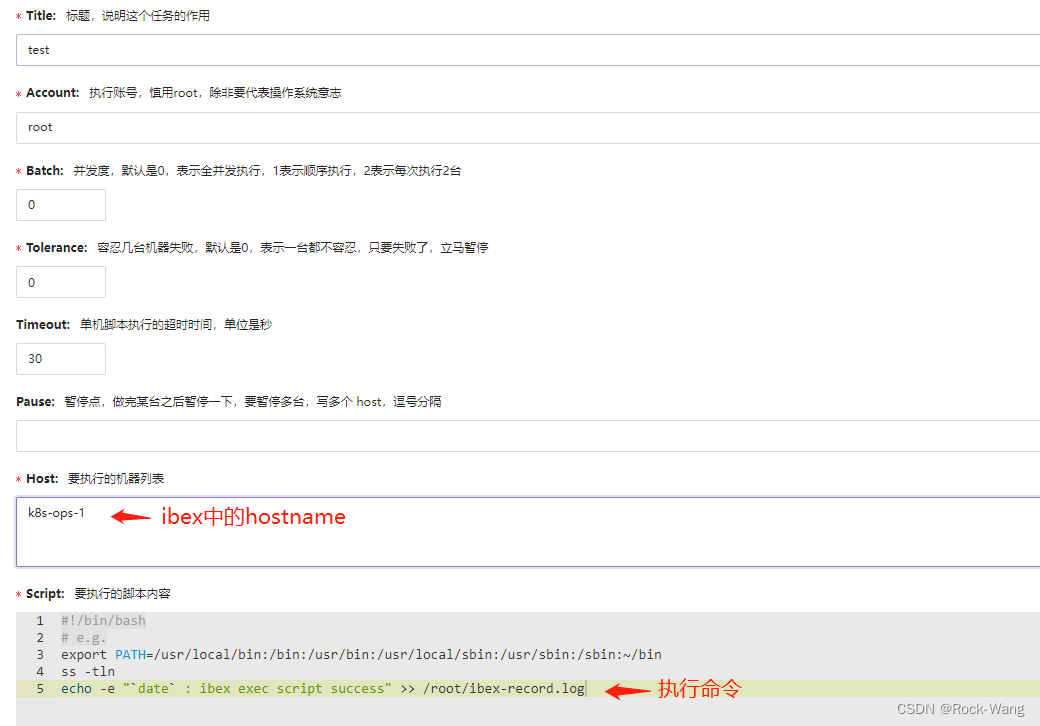
2.7 测试ibex临时任务
进入 告警自愈 -> 执行历史 -> 创建临时任务
2.8 自愈脚本编写及配置
我这里是写了一个docker镜像 和 log日志清理的脚本
log_path="/var/log/ibex_repair.log"
echo "Info: `date +%F-%T` Start to clean the docker images ..." >> ${log_path}
echo "Info: `date +%F-%T` docker system prune" >> ${log_path}
docker system prune

echo "Info: `date +%F-%T` Start to clean log ..." >> ${log_path}
echo "Info: `date +%F-%T` Clear logs(/var/log) generated 7 days ago" >> ${log_path}
log_files=`find /var/log/ -type f -mtime +7`
for file in ${log_files}
do
  # 以 *.log结尾的
  if [[ $file =~ .*log$ ]];then
    #echo ""> $file
    echo -e "Info: `date +%F-%T` [.*log]=> echo '' > $file" >> ${log_path}
  elif [[ $file =~ .*tar$ || $file =~ .*gz$ || $file =~ .*tgz$ || $file =~ .*xz$ ]];then
    rm -f $file
    echo -e "Info: `date +%F-%T` [.*tar|.*gz|.*tgz]=> rm -f $file" >> ${log_path}
  else
    # 以日期结尾的
    date_len=`echo $file | grep "202[0-9][0-1][0-9][0-3][0-9]$" | wc -l`
    if [[ ${date_len} -eq 1 ]];then
      rm -f $file
      echo -e "Info: `date +%F-%T` [.*date$]=> rm -f $file" >> ${log_path}
    else
      #no processing
      echo -e "Info: `date +%F-%T` [others]=> No processing $file" >> ${log_path}
    fi
  fi
done
echo "Info: `date +%F-%T` Cleaning completed" >> ${log_path}
- 放到自愈脚本中

至此,ibex的安装使用就结束了。
好了,本章节内容就到这里了,下一期我会分享 blackbox等相关内容。
非常感谢大家的关注,如有任何问题请留言,我会第一时间回复,再次感谢 么么哒~


 2035
2035


 被折叠的 条评论
为什么被折叠?
被折叠的 条评论
为什么被折叠?
 到【灌水乐园】发言


