


#0 前言
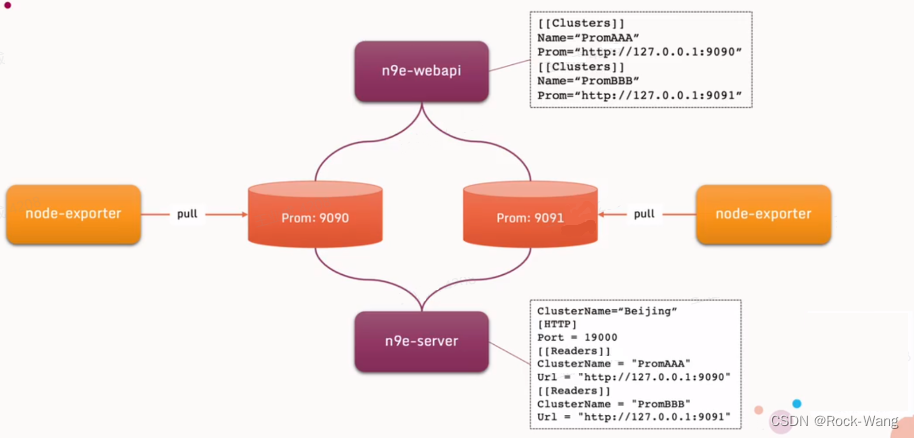
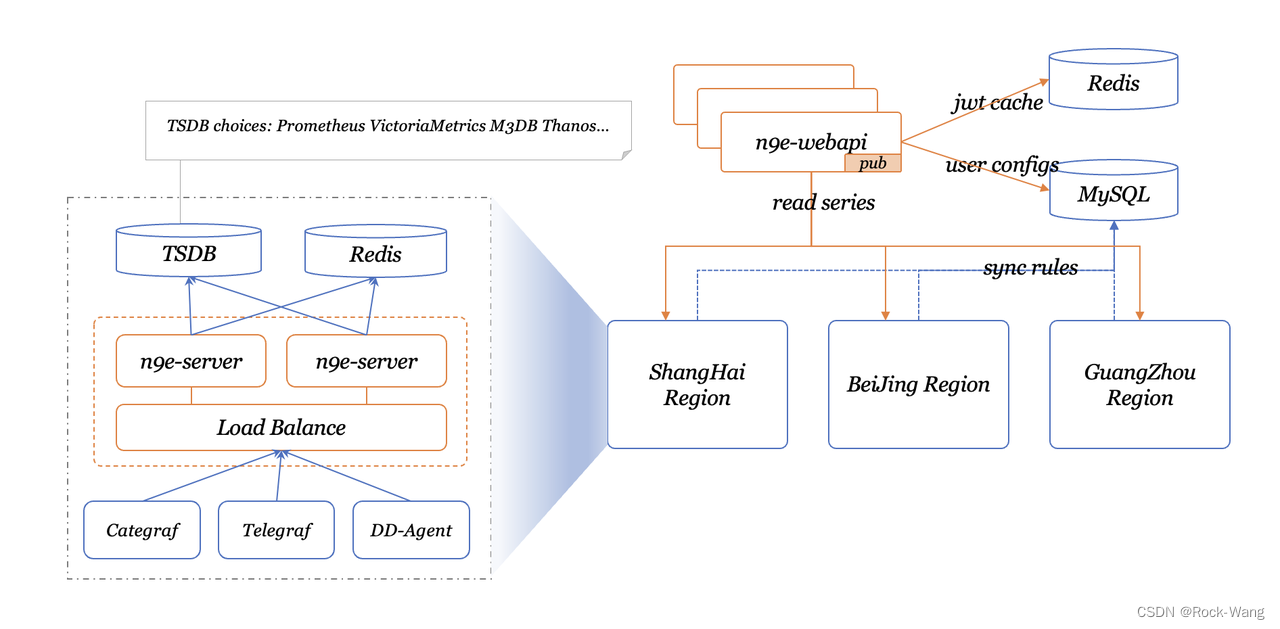
下面n9e的理解图和架构图,后面的安装会以架构图的方式进行。
-
理解图:
-
架构图:
1 helm服务安装(主服务端)
这里说的主服务端,就是整个监控系统的最核心的那个n9e,所以相关的用户数据、配置数据等都在这个n9e上了。
1.1 chart包下载
A.根据官网(https://n9e.flashcat.cloud/docs/content/flashcat-monitor/nightingale/install/helm/)文档提示,
  到 https://github.com/flashcatcloud/n9e-helm 中拿包

B.下载官网chart包
# git clone https://github.com/flashcatcloud/n9e-helm.git
# cd n9e-helm

C.pull/tag/push image
docker pull docker.io/library/nginx:stable-alpine
docker pull docker.io/library/mysql:5.7
docker pull docker.io/library/redis:6.2
docker pull docker.io/prom/prometheus:latest
docker pull flashcatcloud/categraf:latest
docker pull flashcatcloud/nightingale:5.14.5
1.2 配置
- webapi支持nodePort(按需开放)
# vim templates/nwebapi/service.yaml
*/}}
{{- if eq .Values.nwebapi.type "internal" -}}
apiVersion: v1
kind: Service
metadata:
  name: "{{ template "nightingale.nwebapi" . }}"
  labels:
{{ include "nightingale.labels" . | indent 4 }}
spec:
  type: NodePort  # type为NodePort,也可以在values.yaml里控制,我这里懒的配置了
  ports:
    - name: "nwebapi-port"
      port: {{ template "nightingale.nwebapi.servicePort" . }}
      targetPort: {{ template "nightingale.nwebapi.port" . }}
      nodePort: {{ .Values.expose.nodePort.ports.http.nodePort }}  # 并指定端口
  selector:
{{ include "nightingale.matchLabels" . | indent 4 }}
    component: nwebapi
{{- end -}}
- values.yaml主要配置
# cat values.yaml
expose:
  type: ingress
  tls:
    enabled: false
    certSource: auto
    auto:
      commonName: ""
    secret:
      secretName: ""
  ingress:
    hosts:
      web: n9e.example.com
    controller: default
  clusterIP:
    name: nightingale
    ports:
      httpPort: 80
      httpsPort: 443
  nodePort:
    name: nightingale
    ports:
      http:
        port: 80
        nodePort: 30007
      https:
        port: 443
        nodePort: 30009
  loadBalancer:
    name: nightingale
    IP: ""
    ports:
      httpPort: 80
      httpsPort: 443

externalURL: http://hello.n9e.info

persistence:  # 这里是持久化存储的配置,有storageClass的话直接配上就行,没有的话可以用hostpath方式
  enabled: true
  resourcePolicy: "keep"
  persistentVolumeClaim:
    database:
      existingClaim: ""
      storageClass: "nfs-storage"
      subPath: ""
      accessMode: ReadWriteOnce
      size: 40Gi
    redis:
      existingClaim: ""
      storageClass: "nfs-storage"
      subPath: ""
      accessMode: ReadWriteOnce
      size: 10Gi
    prometheus:
      existingClaim: ""
      storageClass: "nfs-storage"
      subPath: ""
      accessMode: ReadWriteOnce
      size: 100Gi

imagePullSecrets:

caSecretName: ""

secretKey: "not-a-secure-key"

nginx:
  image:
    repository: docker.io/library/nginx
    tag: stable-alpine
  replicas: 1
  # resources:
  #  requests:
  #    memory: 256Mi
  #    cpu: 100m

database:
  type: internal  # 这个表达的是使用n9e chart启动的mysql还是外部的mysql
  internal:
    image:
      repository: docker.io/library/mysql
      tag: 5.7
    username: "root"
    password: "n9e_v5"
    shmSizeLimit: 512Mi
    resources: {}
  external:
    host: "192.168.0.1"  # 如果有外部的mysql,可以直接配置到这里,并将上面的type改为: external就行了
    port: "3306"
    name: "n9e_v5"
    username: "user"
    password: "password"
    sslmode: "disable"

redis:
  type: internal
  internal:
    image:
      repository: docker.io/library/redis
      tag: 6.2
  external:
    addr: "192.168.0.2:6379"
    sentinelMasterSet: "admin"
    password: ""
    mode: "standalone" # standalone/sentinel

prometheus:
  type: internal
  internal:
    username: ""
    password: ""
    image:
      repository: docker.io/prom/prometheus
      tag: latest
  external:
    host: "192.168.0.2"
    port: "9090"
    username: ""
    password: ""
  nodePort: 30090

categraf:
  type: internal
  internal:
    image:
      repository: flashcatcloud/categraf
      tag: latest
  external:
    host: "192.168.0.3"
    port: "8094"
    password: ""

nwebapi:
  type: internal
  internal:
    replicas: 1
    image:
      repository: flashcatcloud/nightingale
      tag: 5.14.5
  external:
    host: "172.20.0.11"
    port: "5040"

nserver:
  type: internal
  internal:
    replicas: 1
    image:
      repository: flashcatcloud/nightingale
      tag: 5.14.5
  external:
    host: "172.20.0.11"
    port: "19000"
- cluster name配置
n9e前端服务中配置:
# vim templates/nwebapi/conf-cm.yaml
    [[Clusters]]
    Name = "Ops-k8s-cluster"  # 修改自己的cluster name
    Prom = "http://{{ template "nightingale.prometheus.host" . }}:{{ template "nightingale.prometheus.servicePort" .}}"
    BasicAuthUser = ""
    BasicAuthPass = ""
    Timeout = 30000      # 如果大盘图有timeout报错,可以在这里配置超时时间来解决。例如改为 90000
    DialTimeout = 3000   # 如果大盘图有timeout报错,可以在这里配置超时时间来解决。例如改为 90000
    MaxIdleConnsPerHost = 100
    Headers = ["X-From", "n9e"]
    [[Clusters]]
    Name = "Ops-repository"    # 衔接其他的n9e-server 配置对应的cluster name
    Prom = "http://172.20.0.11:9090"
    BasicAuthUser = ""
    BasicAuthPass = ""
    Timeout = 30000      # 如果大盘图有timeout报错,可以在这里配置超时时间来解决。例如改为 90000
    DialTimeout = 3000   # 如果大盘图有timeout报错,可以在这里配置超时时间来解决。例如改为 90000
    MaxIdleConnsPerHost = 100

n9e后端
服务中配置:
# vim templates/nserver/conf-cm.yaml
data:
  server.conf: |-
    RunMode = "release"
    ClusterName = "Ops-k8s-cluster"  # Default 改为自己需要的名称
... ...
    [AnonymousAccess]
    PromQuerier = true  # 打开匿名访问
    AlertDetail = false
- 告警模板配置
# vim tpl/feishu.tpl
级别状态: S{{.Severity}} {{if .IsRecovered}}Recovered{{else}}Triggered{{end}}
规则名称: {{.RuleName}}{{if .RuleNote}}
规则备注: {{.RuleNote}}{{end}}
告警集群: {{ .Cluster }}
告警组: {{ .GroupName }}
监控指标: {{range $index, $value := .TagsJSON}}
  {{$value}}{{end}}
{{if .IsRecovered}}恢复时间: {{timeformat .LastEvalTime}}{{else}}触发时间: {{timeformat .TriggerTime}}
触发值: {{.TriggerValue}}{{end}}
发送时间: {{timestamp}}


告警样例展示:
级别状态: S3 Triggered
规则名称: 测试告警
告警集群: ops-k8s-cluster
告警组: devops
监控指标:
  alert_type=test
  daemonset=nvidia-gpu-exporter
  instance=kube-state-metrics:8080
  job=kube-state-metrics
  namespace=monitoring
  rulename=测试告警
恢复时间:2023-03-16 11:33:00
触发值: 1
发送时间: 2023-03-16 11:33:00
1.3 安装及登录
1.3.1 安装
# helm upgrade -i nightingale --namespace=monitoring -f override.yaml --create-namespace .
# kubectl get pods -n monitoring
NAME                                                READY   STATUS             RESTARTS      AGE
nightingale-categraf-57st8                          1/1     Running            0             19h
nightingale-categraf-hncl6                          1/1     Running            0             19h
nightingale-categraf-pxrl7                          1/1     Running            0             19h
nightingale-database-0                              1/1     Running            0             19h
nightingale-nserver-96557c66f-9wtf6                 1/1     Running            2 (19h ago)   19h
nightingale-nwebapi-6d6bc8f964-m9n8v                1/1     Running            0             166m
nightingale-prometheus-0                            1/1     Running            0             19h
nightingale-redis-0                                 1/1     Running            0             19h

# kubectl get svc -n monitoring
NAME                     TYPE        CLUSTER-IP      EXTERNAL-IP   PORT(S)        AGE
nightingale-database     ClusterIP   10.233.16.151   <none>        3306/TCP       19h
nightingale-nserver      ClusterIP   10.233.42.48    <none>        80/TCP         19h
nightingale-nwebapi      NodePort    10.233.17.185   <none>        80:30007/TCP   170m
nightingale-prometheus   ClusterIP   10.233.12.40    <none>        9090/TCP       19h
nightingale-redis        ClusterIP   10.233.45.201   <none>        6379/TCP       19h
1.3.2 安全组放行
放行 30007 tcp端口,用于n9e-web的nodeport
1.3.3 登录访问
http://ip:30007/dashboards

默认密码: root/root.2020
2 n9e web页面配置
2.1 用户配置
- 在飞书APP上拉一个群,添加机器人,然后生成webhook的url。
- 添加用户,并将飞书的webhook的url添加到 个人信息的联系方式中,用于后续告警使用。
2.2 监控大盘配置
官网的大盘图地址:
- categraf的inputs中找对应的json文件:https://github.com/flashcatcloud/categraf/tree/main/inputs/kubernetes
- categraf的k8s中找对应的json文件:https://github.com/flashcatcloud/categraf/blob/main/k8s/pod-dash.json
2.2.1 当前k8s集群大盘图
直接导入此模板即可

2.2.2 当前集群pod大盘
- 通过下面的json模板导入即可
https://github.com/flashcatcloud/categraf/blob/main/k8s/pod-dash.json
如需我优化后的大盘图,可以留言找我要哦~
以上主n9e的服务就部署好了,当然还有一些exportor还需要安装一下,后面会一 一讲到的。
下面就开始进行其他集群资源监控了。
3 其他集群资源监控
3.1 k8s集群安装n9e
对于k8s集群,就直接安装上面的方式安装好n9e就可以了。
3.2 二进制安装n9e
3.2.1 下载n9e包
# mkdir /usr/local/n9e && cd /usr/local/n9e
# wget https://github.com/ccfos/nightingale/releases/download/v5.14.5/n9e-v5.14.5-linux-amd64.tar.gz
# tar xf n9e-v5.14.5-linux-amd64.tar.gz
# ln -s /usr/local/n9e/n9e /usr/local/bin/
3.2.2 配置
# vim etc/server.conf
ClusterName = "Ops-repository"
... ...
[DB]
DSN="root:zelos@n9e@tcp(ip:3306)/n9e_v5?charset=utf8mb4&parseTime=True&loc=Local&allowNativePasswords=true"  # 数据库配置
... ...
[Reader]
# prometheus base url
Url = "http://127.0.0.1:9095"
... ...
[[Writers]]
Url = "http://127.0.0.1:9095/api/v1/write"


# vim etc/webapi.conf
[[Clusters]]
# Prometheus cluster name
Name = "Ops-repository"
# Prometheus APIs base url
Prom = "http://127.0.0.1:9095"  # 改为本机Prometheus端口
3.2.3 redis安装
# docker run -it -d --name=n9e-redis -p 6379:6379 redis:6.2
3.2.4 prometheus安装
# wget https://s3-gz01.didistatic.com/n9e-pub/prome/prometheus-2.28.0.linux-amd64.tar.gz -O prometheus-2.28.0.linux-amd64.tar.gz
# tar xf prometheus-2.28.0.linux-amd64.tar.gz
# mv prometheus-2.28.0.linux-amd64 /usr/local/prometheus/

# cat <<EOF >/etc/systemd/system/prometheus.service
[Unit]
Description="prometheus"
Documentation=https://prometheus.io/
After=network.target

[Service]
Type=simple

ExecStart=/usr/local/prometheus/prometheus --config.file=/usr/local/prometheus/prometheus.yml --storage.tsdb.path=/usr/local/prometheus/data --web.enable-lifecycle --enable-feature=remote-write-receiver --query.lookback-delta=2m

Restart=always
SuccessExitStatus=0
LimitNOFILE=65536
StandardOutput=syslog
StandardError=syslog
SyslogIdentifier=prometheus

[Install]
WantedBy=multi-user.target
EOF


# systemctl daemon-reload
# systemctl enable prometheus
# systemctl start prometheus
# systemctl status prometheus
测试Prometheus服务状态:
http://IP:9090/targets
3.2.5 启动n9e
- 普通方式:
端安装:
# nohup ./n9e server & > server.log &

前端不用安装,这里只是告诉大家怎么运行的:
# nohup ./n9e webapi & > webapi.log &
- 守护进程方式
# vim /lib/systemd/system/n9e-server.service
[Unit]
Description=n9e Service
After=syslog.target network.target

[Service]
Type=simple
ExecStart=/usr/local/bin/n9e server
RestartSec=3
Restart=always

[Install]
WantedBy=multi-user.target


# systemctl daemon-reload
# systemctl start n9e-server
# systemctl status n9e-server
# systemctl enable n9e-server
3.3 categraf安装
3.3.1 下载
二进制下载页面: https://github.com/flashcatcloud/categraf/releases

# cd /opt/monitoring/3.categraf
# wget https://github.com/flashcatcloud/categraf/releases/download/v0.2.35/categraf-v0.2.35-linux-amd64.tar.gz
# tar xf categraf-v0.2.35-linux-amd64.tar.gz
# cd categraf-v0.2.35-linux-amd64
# ll
total 117064
-rwxr-xr-x  1 1001 docker 119869440 Mar 16 07:18 categraf
drwxr-xr-x 59 root root        4096 Mar 22 02:27 conf

# mv categraf-v0.2.35-linux-amd64 /usr/local/categraf
# ln -s categraf-v0.2.35-linux-amd64 .
3.3.2 配置
# vim conf/config.toml
[[writers]]
url = "http://127.0.0.1:19000/prometheus/v1/write"
3.3.3 启动
配置service
# cat <<EOF >/etc/systemd/system/categraf.service
[Unit]
Description="categraf"
Documentation=https://github.com/flashcatcloud/categraf
After=network.target

[Service]
Type=simple

ExecStart=/usr/local/categraf/categraf

Restart=always
SuccessExitStatus=0
LimitNOFILE=65536
StandardOutput=syslog
StandardError=syslog
SyslogIdentifier=categraf

[Install]
WantedBy=multi-user.target
EOF

启动服务
# systemctl daemon-reload
# systemctl enable categraf
# systemctl start categraf
# systemctl status categraf


注意:如果是多节点的环境,还需要将categraf的文件和配置分发到其他环境去,并启动起来哦~
3.4 主n9e添加其他集群的配置进来
最后还需要在主n9e集群中配置一下新增的集群,用于被监控,具体如下:
在主n9e的配置中,新增其他集群的prometheus进来,这里示例新的集群名称为:Ops-repository
# vim templates/nwebapi/conf-cm.yaml
    [[Clusters]]
    Name = "Ops-k8s-cluster"
    Prom = "http://{{ template "nightingale.prometheus.host" . }}:{{ template "nightingale.prometheus.servicePort" .}}"
    BasicAuthUser = ""
    BasicAuthPass = ""
    Timeout = 30000
    DialTimeout = 3000
    MaxIdleConnsPerHost = 100
    Headers = ["X-From", "n9e"]
    [[Clusters]]            # ================> 增加此段配置
    Name = "Ops-repository"
    Prom = "http://172.20.0.11:9090"
    BasicAuthUser = ""
    BasicAuthPass = ""
    Timeout = 30000      # 如果大盘图有timeout报错,可以在这里配置超时时间来解决。例如改为 90000
    DialTimeout = 3000   # 如果大盘图有timeout报错,可以在这里配置超时时间来解决。例如改为 90000
    MaxIdleConnsPerHost = 100


在[Reader]下面新增[[Readers]],将当前主集群和其他接入的集群的prometheus挂载进来,用于告警引擎的展示,注意有个s结尾哦~
# templates/nserver/conf-cm.yaml
    [[Readers]]
    ClusterName = "Ops-k8s-cluster"
    #prometheus base url
    Url = "http://nightingale-prometheus:9090"
    #Basic auth username
    BasicAuthUser = ""
    #Basic auth password
    BasicAuthPass = ""
    #timeout settings, unit: ms
    Timeout = 30000      # 如果大盘图有timeout报错,可以在这里配置超时时间来解决。例如改为 90000
    DialTimeout = 3000   # 如果大盘图有timeout报错,可以在这里配置超时时间来解决。例如改为 90000
    MaxIdleConnsPerHost = 100

    [[Readers]]            # ================> 增加此段配置
    ClusterName = "Ops-repository"
    #prometheus base url
    Url = "http://172.20.0.11:9090"
    #Basic auth username
    BasicAuthUser = ""
    #Basic auth password
    BasicAuthPass = ""
    #timeout settings, unit: ms
    Timeout = 30000      # 如果大盘图有timeout报错,可以在这里配置超时时间来解决。例如改为 90000
    DialTimeout = 3000   # 如果大盘图有timeout报错,可以在这里配置超时时间来解决。例如改为 90000
    MaxIdleConnsPerHost = 100


然后主n9e服务重新部署下(更新configmap),然后重启前端和后端的pod,否则不生效。
好了,这一章节的内容还是挺多的,关于告警、出图、各exporter的配置与使用,请看后续章节,感谢大家的关注,么么哒~


 8079
8079


 被折叠的 条评论
为什么被折叠?
被折叠的 条评论
为什么被折叠?
 到【灌水乐园】发言


