


简介
Matplotlib是python中很强大的画图包,类似于MATLAB中的画图
简称plt,可视化可以帮助我们更好的了解数据
安装
pip install matplotlib
绘图(Plotting)
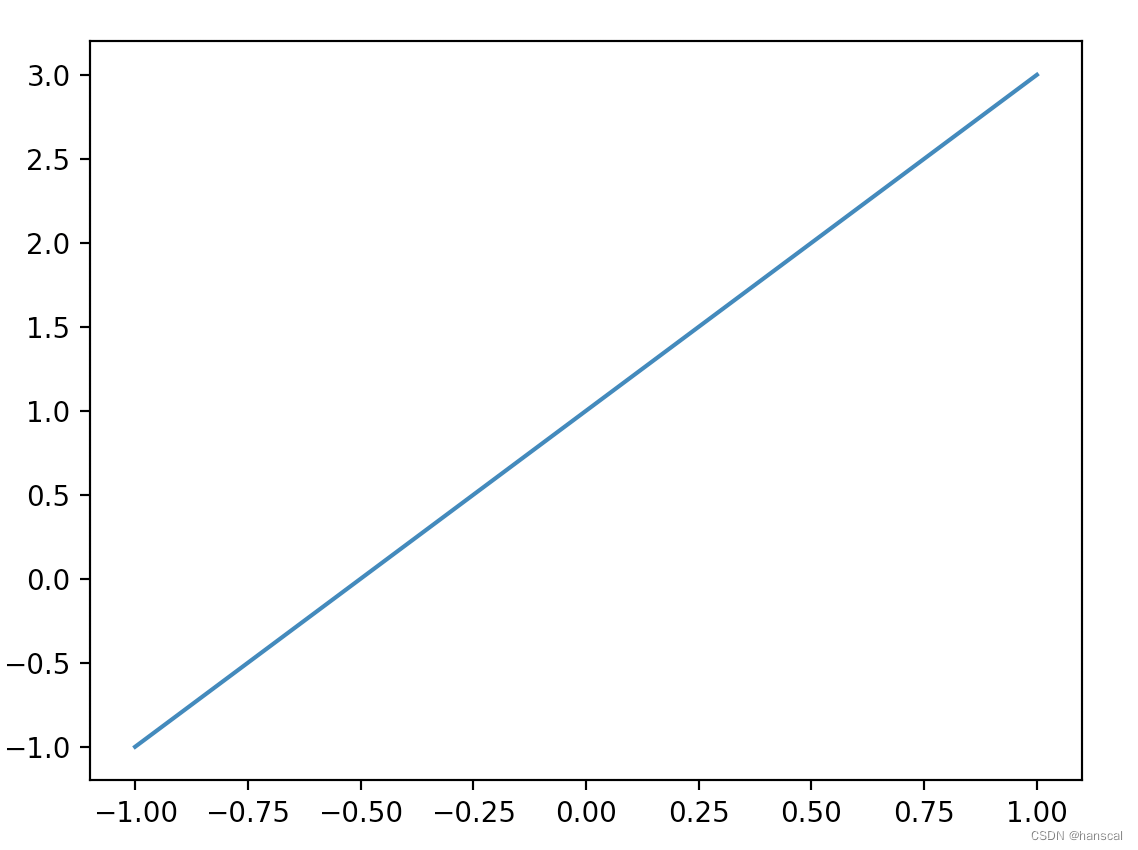
import numpy as np
import matplotlib.pyplot as plt

x = np.linspace(-1, 1, 50)
y = 2*x+1
plt.plot(x, y)
plt.show()
返回的结果为:
figure 1:
将多个figure画在一张图片中
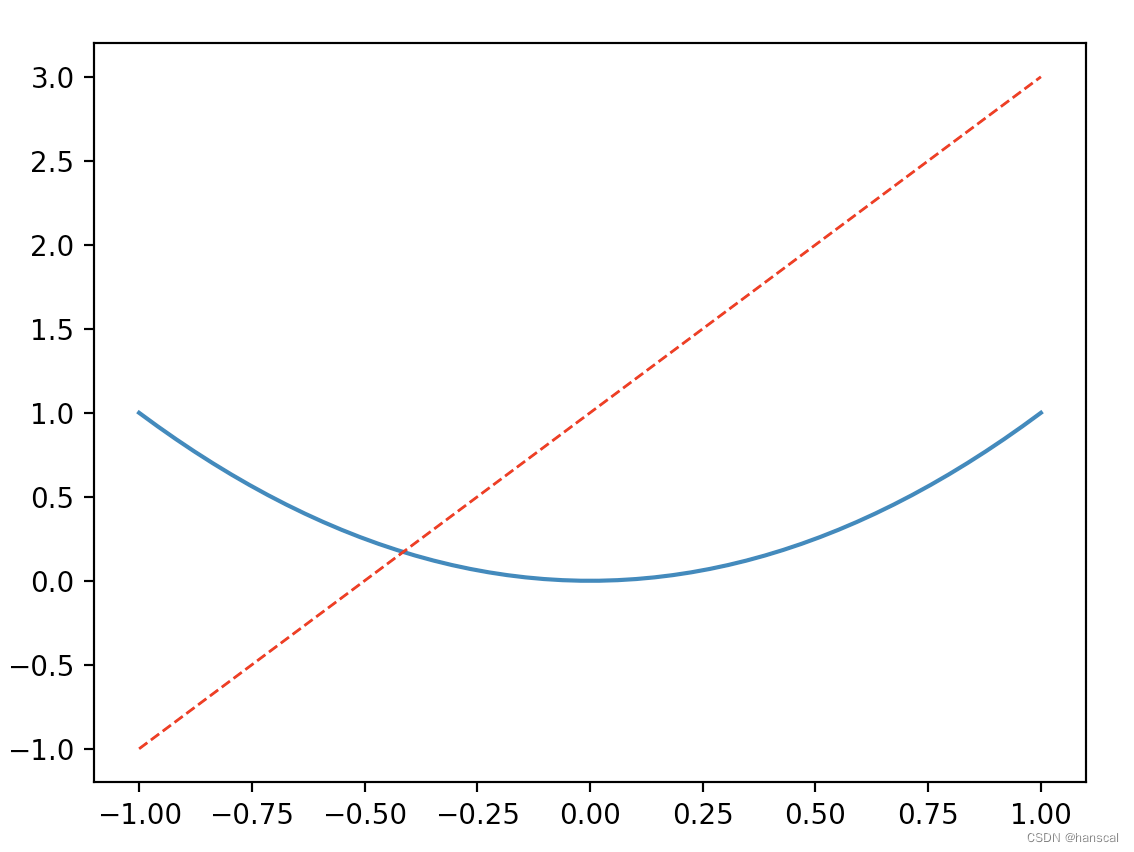
import numpy as np
import matplotlib.pyplot as plt

x = np.linspace(-3, 3, 50)
y1 = 2*x+1
y2 = x**2

plt.figure()
plt.plot(x,y2)
plt.plot(x,y1,color='red',linewidth=1.0,linestyle='--')
#将两个函数画在一个figure中,为函数设置颜色、线宽和样式
plt.show()
figure如下所示:
子图(Subplots)
使用subplot函数,你就可以在同一个图像里绘制多个子图,栗子如下:
import numpy as np
import matplotlib.pyplot as plt

# Compute the x and y coordinates for points on sine and cosine curves
x = np.arange(0, 3 * np.pi, 0.1)
y_sin = np.sin(x)
y_cos = np.cos(x)

# 我要绘制2行1列的子图,现在声明,我要绘制第1个子图啦~
plt.subplot(2, 1, 1)

# Make the first plot
plt.plot(x, y_sin)
plt.title('Sine')

# 现在声明我要绘制第2个子图啦~
plt.subplot(2, 1, 2)
plt.plot(x, y_cos)
plt.title('Cosine')

# Show the figure.
plt.show()

关于subplot函数更详细的介绍尽在官方文档:https://matplotlib.org/api/pyplot_api.html#matplotlib.pyplot.subplot
图像(Images)
可以使用imshow函数绘制图像,栗子如下:
import numpy as np
from scipy.misc import imread, imresize
import matplotlib.pyplot as plt

img = imread('assets/cat.jpg')
img_tinted = img * [1, 0.95, 0.9]

# Show the original image
plt.subplot(1, 2, 1)
plt.imshow(img)

# Show the tinted image
plt.subplot(1, 2, 2)

# imshow的一个小问题是,如果提供的数据不是uint8,它可能会给出奇怪的结果。
# 为了解决这个问题,在显示图像之前将其显式转换为uint8。
plt.imshow(np.uint8(img_tinted))
plt.show()


 7470
7470


 被折叠的 条评论
为什么被折叠?
被折叠的 条评论
为什么被折叠?
 到【灌水乐园】发言


