


0、准备工作
0.1 数据来源:“数智教育”数据可视化创新大赛
0.2 使用工具:SQL、Tableau、Python
0.3 文章仅用来展示数据处理和可视化工具熟练度,以供求职实习使用,代码图片均可随意使用。
1、前期分析:后续做的方向
1.1 食堂经营状况分析(sql、tableau) ✅已完成
1.2 学生消费RFM模型,消除非住校生的影响,细致化划分贫困生(sql、tableau) ❎未完成
1.3 学生考勤状况与成绩的相关性分析,学生考勤状况与天气的相关性分析(sql、python) ❎未完成 – 需要补充当地的天气信息
1.4 不同科目的相关性情况,为选科提供依据(sql、python) ❎未完成
1.5 学生成绩预测(python、机器学习(时间序列)) ❎未完成
2、食堂经营状况分析可视化
数据范围从2018年7月1日到2019年1月27日。
经查验,无缺值。
2.1 观察数表结构
select *
from consumption
limit 5
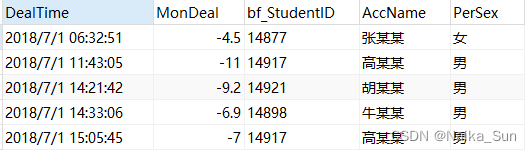
可知消费时间DealTime为’yyyy/m/d hh:mm:ss’格式,为了做报表需要转换成周或者月,为了使用尽可能多的数据这里用月,substr(date_format(dealtime,'%Y%m%d'), 1, 6) as ymth ;MonDeal消费金额是负数,为了方便查看,转换成正数abs(mondeal)。
2.2 创建临时表tablea
对月活数mau、订单量ords、消费金额GMV、人均消费金额arpu根据月份进行聚合计算
with tablea as(
		select substr(consump, 1, 6) as ymth
		, count(distinct bf_studentid) as mau
		, count(consump) as ords
		, round(sum(cost), 0) as GMV
		, round(sum(cost)/count(distinct bf_studentid), 0) as arpu
		from(
				select date_format(dealtime,'%Y%m%d') as consump
				, abs(mondeal) as cost
				, bf_studentid
				, accname
				, persex
				from consumption
				) a
		group by ymth
)
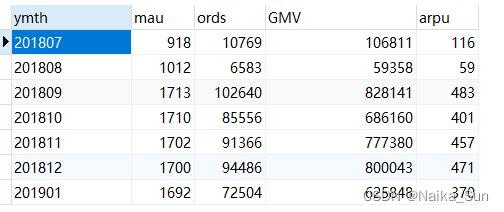
可以看出由于暑假原因,2018年的7月和8月的各方面数据都远低于其他月,1月由于只统计到27日,所以各方面数据略低于9月-12月。可能由于9月是开学季,学生们的消费数据高于其他月份,由于存在国庆小长假,10月出现了一个消费的低谷。
为了减免暑假和非整月的影响,数据可视化选取2018年9月到2018年12月。
2.3 选取一个月的数据
select concat(substr(ymth,1,4),'年',substr(ymth,5,6),'月') as ymth
		, mau
		, ords
		, GMV
		, arpu
		from tablea
		where ymth in (
					  select substr(replace(date_add(str_to_date('20181201','%Y%m%d'), interval 0 month),'-',''),1,6)
				 	  )
按照自动化的原则,时间应当以current_date或者系统变量往前选择日期,但是因为数据集中的数据太久远,所以直接用str_to_date('20181201','%Y%m%d')来定准日期,将上面的SQL复制并用ymth来join连接起环比数据。
select concat(substr('20181201',1,4),'年',substr('20181201',5,2),'月') as ymth -- 链接键
		, concat(substr(ymth,1,4),'年',substr(ymth,5,2),'月') as mom_ymth -- 划定ymth的月份
		, mau
		, ords
		, GMV
		, arpu
		from tablea
		where ymth in (
						select substr(replace(date_add(str_to_date('20181201','%Y%m%d'), interval -1 month),'-',''),1,6)
						)
2.4 同比数据
由于数据范围有限,没有同期数据可以导入,同时也无法计算同比,但是连接方式和计算方法与环比一致。
2.5 计算环比数据与呈现四期数据
with tablea as(
		select substr(consump, 1, 6) as ymth
		, count(distinct bf_studentid) as mau
		, count(consump) as ords
		, round(sum(cost), 0) as GMV
		, round(sum(cost)/count(distinct bf_studentid), 0) as arpu
		from(
			select date_format(dealtime,'%Y%m%d') as consump
			, abs(mondeal) as cost
			, bf_studentid
			, accname
			, persex
			from consumption
			) a
		group by ymth
)
select t0.ymth
, t1.mom_ymth as last1_month_ymth
, t2.mom_ymth as last2_month_ymth
, t3.mom_ymth as last3_month_ymth
, t0.mau as this_month_mau
, t0.ords as this_month_ords
, t0.GMV as this_month_GMV
, t0.arpu as this_month_arpu
, round((t0.mau/t1.mau-1), 4) as mom_mau
, round((t0.ords/t1.ords-1), 4) as mom_ords
, round((t0.GMV/t1.GMV-1), 4) as mom_GMV
, round((t0.arpu/t1.arpu-1), 4) as mom_arpu
, t1.mau as last1_month_mau
, t1.ords as last1_month_ords
, t1.GMV as last1_month_GMV
, t1.arpu as last1_month_arpu
, t2.mau as last2_month_mau
, t2.ords as last2_month_ords
, t2.GMV as last2_month_GMV
, t2.arpu as last2_month_arpu
, t3.mau as last3_month_mau
, t3.ords as last3_month_ords
, t3.GMV as last3_month_GMV
, t3.arpu as last3_month_arpu
from(
-- 本期数据
		select concat(substr(ymth,1,4),'年',substr(ymth,5,6),'月') as ymth
		, mau
		, ords
		, GMV
		, arpu
		from tablea
		where ymth in (
					 select substr(replace(date_add(str_to_date('20181201','%Y%m%d'), interval 0 month),'-',''),1,6)
					  )
		) t0
left join
		(
-- 前1月数据
		select concat(substr('20181201',1,4),'年',substr('20181201',5,2),'月') as ymth
		, concat(substr(ymth,1,4),'年',substr(ymth,5,2),'月') as mom_ymth
		, mau
		, ords
		, GMV
		, arpu
		from tablea
		where ymth in (
					  select substr(replace(date_add(str_to_date('20181201','%Y%m%d'), interval -1 month),'-',''),1,6)
					  )
		) t1
on t0.ymth = t1.ymth
left join
		(
-- 前2月数据
		select concat(substr('20181201',1,4),'年',substr('20181201',5,2),'月') as ymth
		, concat(substr(ymth,1,4),'年',substr(ymth,5,2),'月') as mom_ymth
		, mau
		, ords
		, GMV
		, arpu
		from tablea
		where ymth in (
					  select substr(replace(date_add(str_to_date('20181201','%Y%m%d'), interval -2 month),'-',''),1,6)
					  )
		) t2
on t0.ymth = t2.ymth
left join
		(
-- 前3月数据
		select concat(substr('20181201',1,4),'年',substr('20181201',5,2),'月') as ymth
		, concat(substr(ymth,1,4),'年',substr(ymth,5,2),'月') as mom_ymth
		, mau
		, ords
		, GMV
		, arpu
		from tablea
		where ymth in (
					   select substr(replace(date_add(str_to_date('20181201','%Y%m%d'), interval -3 month),'-',''),1,6)
					  )
		) t3
on t0.ymth = t3.ymth
最主要的部分:环比(数据格式导入到tableau中)

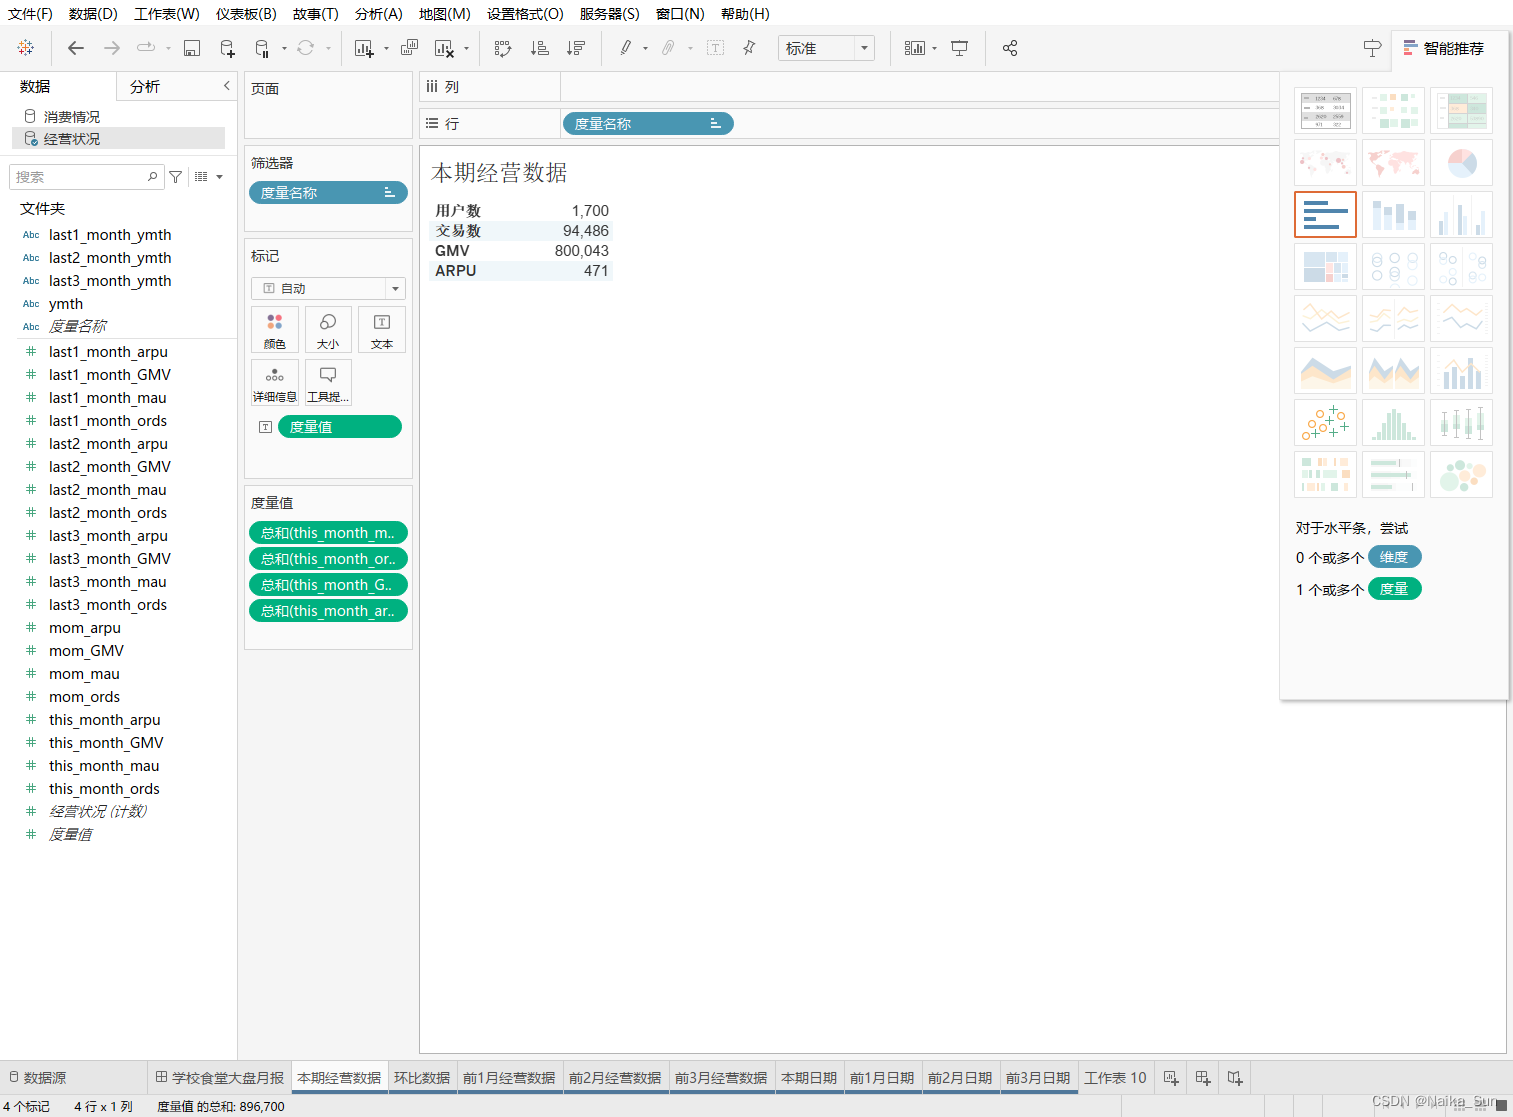
2.6 数据库连接到tableau进行可视化整理
a. 本期经营数据
b. 环比数据
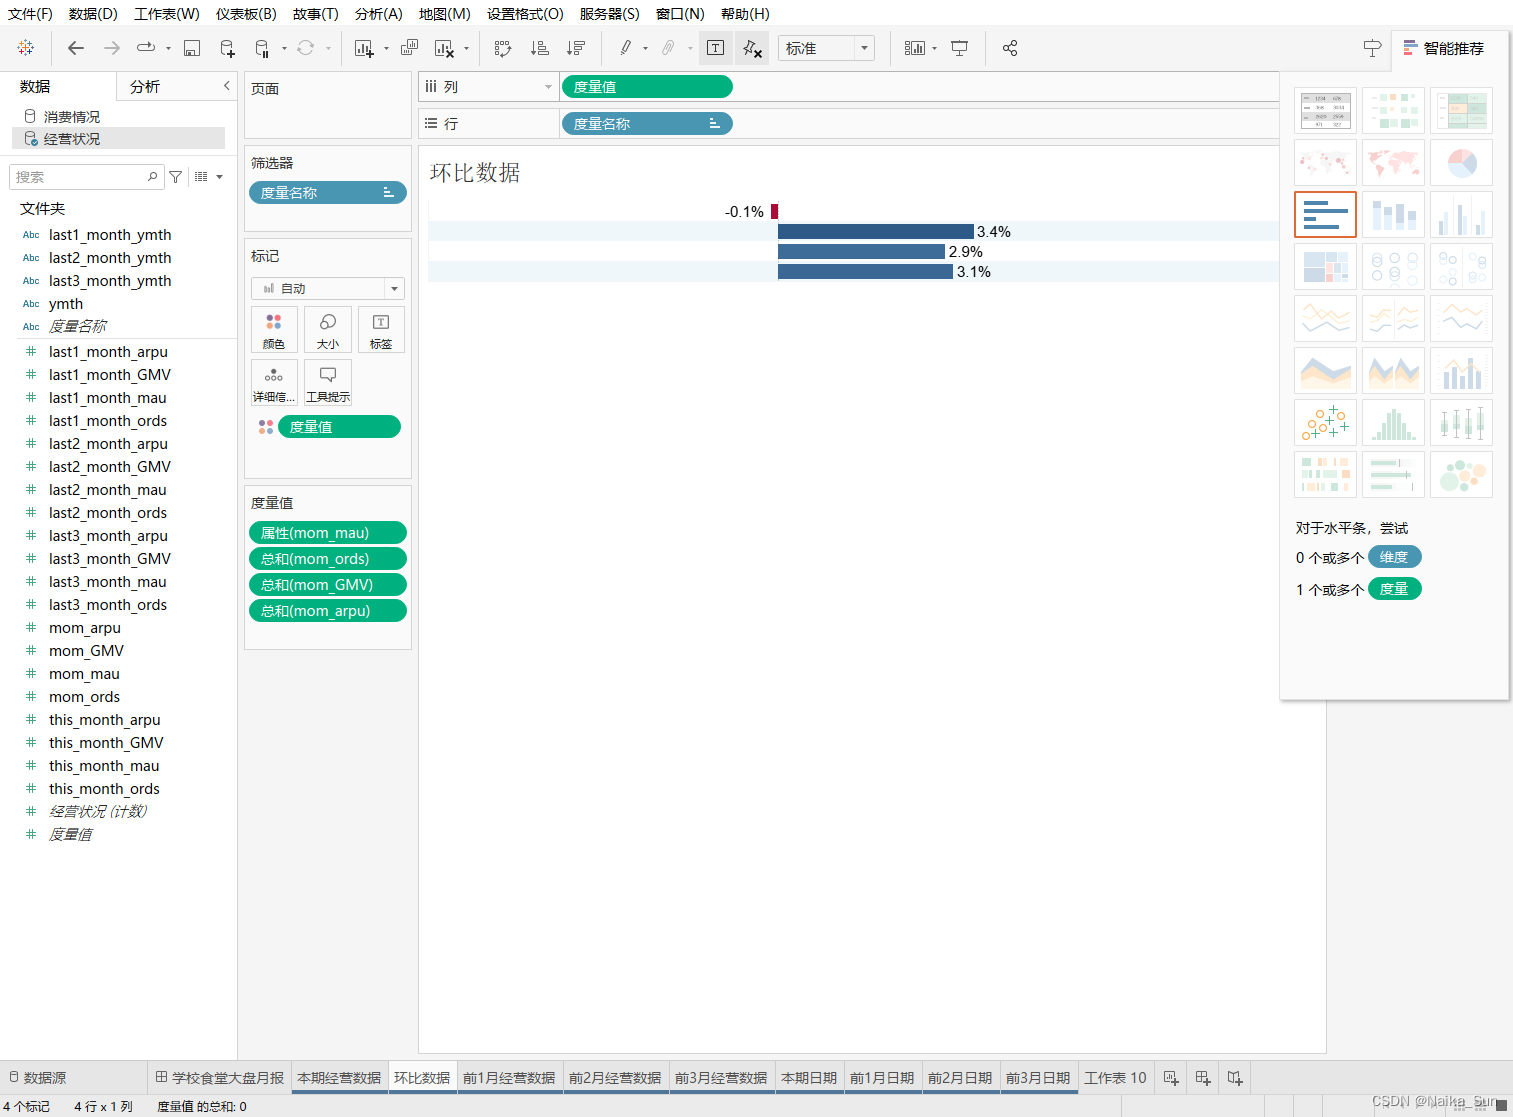
下降的指标用红色展示,上升的指标用蓝色表示,使增减更加直观可见。
可以看出,2018年12月相对于11月MAU有小幅度下降,其他都有一定的提升。
c. 大盘周报(汇总)
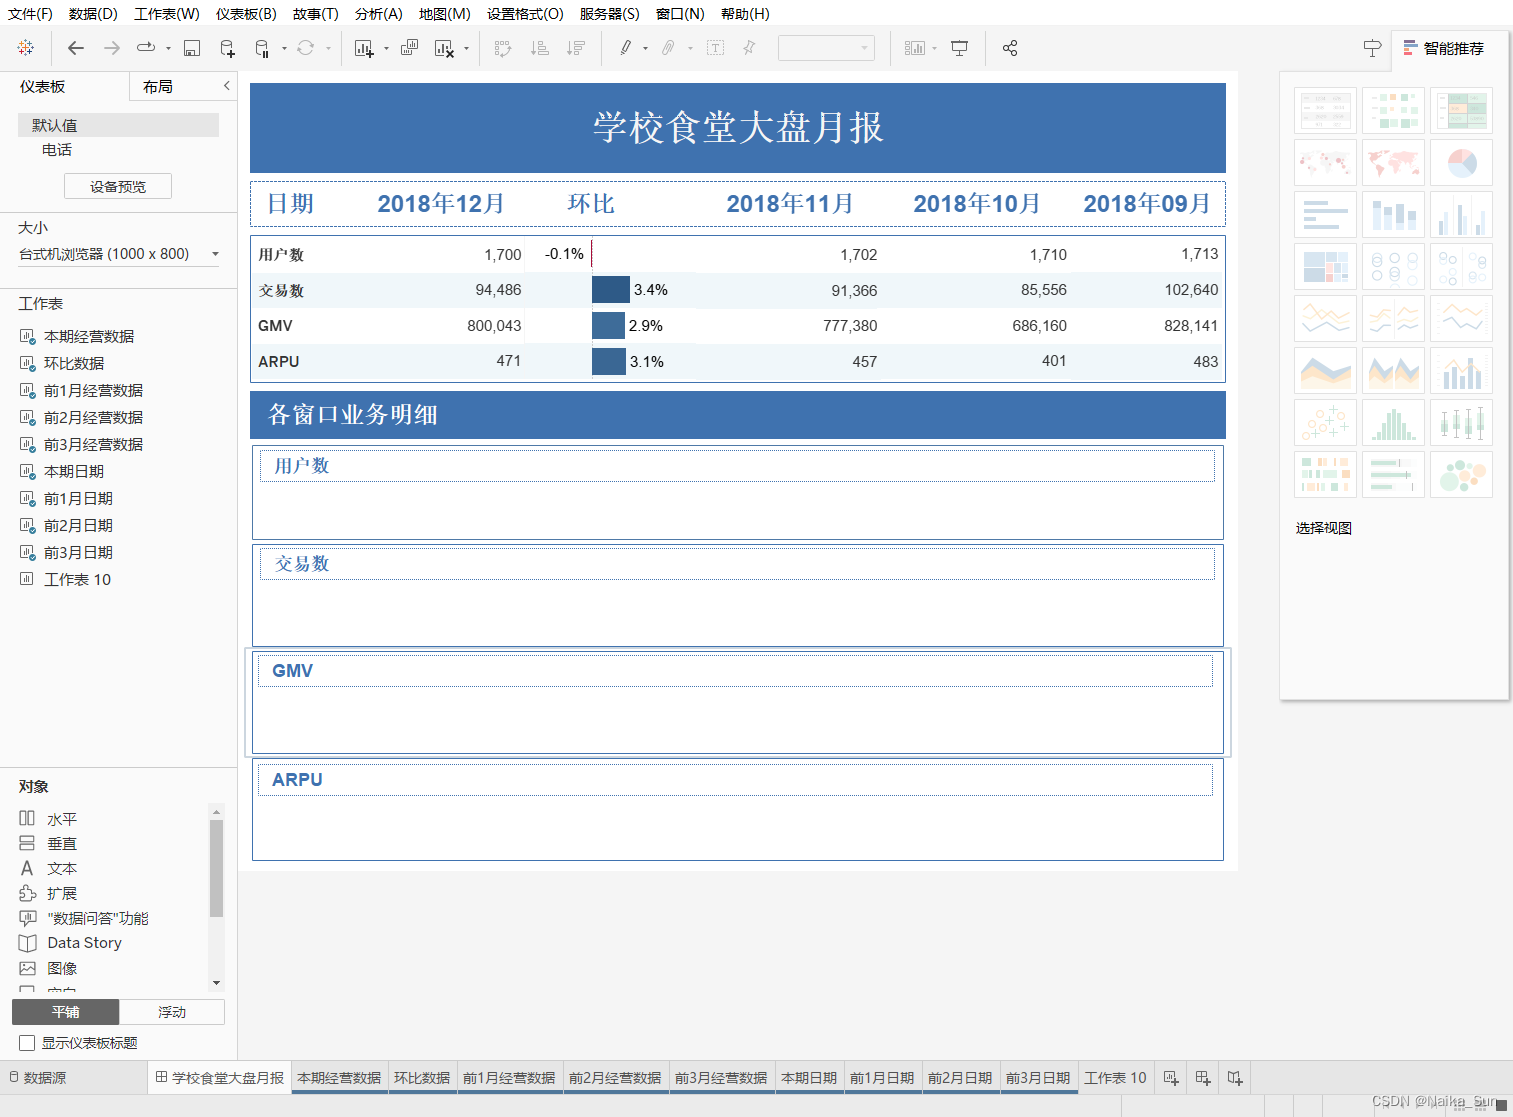
包含用户数、交易数、GMV、ARPU四个指标维度,数据范围包含四周,以查看月度经营状况。
2.7 可以优化的地方:
a.实际使用中周度报告更加满足精细化经营的目的,实际业务中使用周报效果会更好。
b.只包含四个连续自然月的数据,没有包括同期数据,难以体现出跨年份的变化,实际业务中,加入同比数据更能够看到新老业务的数据变动,以判断业务是否存在问题。
c.数据集存在的维度太少,如果有在哪个窗口消费的维度,可以了解学生更加偏好哪些窗口,从而更加精细化经营,也可以分散窗口高峰,避免拥挤和浪费时间。


 846
846


 被折叠的 条评论
为什么被折叠?
被折叠的 条评论
为什么被折叠?
 到【灌水乐园】发言


