


个人学习python过程中的记录, 自己汇总和改写后印象深刻, 方便个人查阅使用.
python基础知识和数据处理学习笔记
- 安装包
- 语法
- 应用
- 其它
- 列表 list
- 集合 set
- numpy 数组操作
- pandas
- pabdas的DataFrame数据框操作
- 子集选取的三种方法:[]、.loc[]、.iloc[]
- 添加新列 df['age'] =
- 删除指定列 data.drop()
- 按照行拼接两个数据框 pd.concat()
- 按照指定列合并两个数据框 pd.merge()
- 将数据框的两列合并为新的一列 df[] = df[] + df[]
- 修改数据列名称 df.rename()
- 通过替换的方式修改数据框列名
- 删除带有某些字符的列 df.drop()
- 从一个数据框中提取某一列在给定数集内的所有行 df[df[' '].isin( )]
- 将数据按照比例随机拆分为训练集和测试集 train_test_split(X, y, test_size=0.2, random_state=42)
- 将5天数据插值到13天 interp1d()
- 保存图片
- 常见报错
安装包
安装包
-
使用conda安装包
conda install open3d
conda install pyntcloud -c conda-forge -
使用pip安装包
pip install open3d -i http://pypi.douban.com/simple/ --trusted-host pypi.douban.com -
检验包是否安装成功
open3d --version
(输出包的版本和网址) -
查看库的版本
pip show jupyterlab -
查看所有的包
pip list
conda list -
卸载库
pip uninstall numpy -
删除包
conda remove --name <env_name> <package_name>
conda remove <package_name> # 卸载当前环境的包 -
更新指定包
conda upgrade conda
执行命令后,conda将会对版本进行比较并列出可以升级的版本。同时,也会告知用户其他相关包也会升级到相应版本。 -
更新所有包
conda updata --all
conda upgrade --all -
使用pip更新库
pip install --upgrade 库名 -
查看conda的帮助
conda -h
或者 conda -help
关于源
- 查看源
conda config --show channels - 添加源
conda config --add channels https://mirrors.tuna.tsinghua.edu.cn/anaconda/pkgs/free/
conda config --add channels https://mirrors.tuna.tsinghua.edu.cn/anaconda/pkgs/main/
conda config --set show_channel_urls yes - 删除源
conda config --remove channels
conda config --remove-key channels
环境
-
切换环境
activate <env_name> -
退出环境
deactivate
关于pycharm
- Pycharm 中Debug使用方法简介
https://blog.csdn.net/FRANKBANG/article/details/134359050
启动jupyterlab
-
安装jupyterlab
pip install jupyterlab -
启动jupyterlab
jupyter lab -
启动jupyter notebook
jupyter notebook -
切换工作目录
在Anaconda Prompt中输入 D: 即可
好用的jupyterlab插件分享
- 好用到飞起的12个jupyter lab插件
https://cloud.tencent.com/developer/article/1971947
语法
for 循环
for i in range(10):   # 注意range(10)是0-9,不包括右边界
    print(i)
# 使用for循环追加列表
num = list()  # num = []
for i in range(10):
	num.append(i)
print(num)
if 条件语句
单向选择:if…;
双向选择:if…else;
多向选择:if…elif…else;
age = 13
if age <= 3:
    print('The age under 3 is free.')
elif age <= 12:
    print('The age between 3 and 12 is half price.')
else:
    print('The age over 12 is full price.')
# 在列表中使用for循环
num = [i for i in range(10)]
print(num)
while
count = 0
while count < 10:
    print(f"第{count}次循环....")
    count+=1
continue和break
continue
只要程序一遇到continue,本次循环就不继续了,直接进入下一次循环
break
只要程序遇到break,就会结束当前这个循环,注意如果是多层嵌套循环,只结束当前这一层的循环。
循环添加进度条
from tqdm import tqdm
import time

for i in tqdm(range(100)):
    time.sleep(0.1)
使用for循环和if语句找最大值
挺有意思的, 以前都是循环结果追加在列表, 循环结束后再找最大值和下标.
for循环配合if语句就能在循环内部找出最大值了,
如果是定义函数, 就能直接返回最大值了.
data = [1,2,3,4,2]
max = 0
for i in range(len(data)):
    if data[i]**2 > max:
		max, max_ind = data[i]**2, i
print(max)
print(max_ind)
# -> 16
# -> 3
定义函数
嵌套函数
参考链接: https://www.yisu.com/zixun/225360.html
def foo():              #定义函数foo(),
    m=3                 #定义变量m=3;
    def bar():          #在foo内定义函数bar()
        n=4             #定义局部变量n=4
        print(m+n)      #m相当于函数bar()的全局变量
    return(bar())       #foo()函数内调用函数bar()

foo()
递归函数
学习机器学习决策树的时候发现的一个自定义函数被内部代码调用的写法, 和嵌套函数还不一样
一度以为写错了,但是能运行, 再回头复习的时候, 百度了一下, 果真是我不知道的用法.
下面的是我理解之后,写的测试递归函数
def fun(a):
    if a == 10:
        b = a**2            # 满足条件返回平方
        return(b)
    else:
        c = fun(a+1)        # 不满足条件就递归
        print(a)
        return(c)
fun(2)
网上有比较好的介绍
参考链接: https://blog.csdn.net/W_chuanqi/article/details/123823315
用递归计算阶乘
#计算阶乘:根据用户输入的整数n,计算并输出n的阶乘值。
def fact(n):#计算阶乘
    if n == 0:
        return 1
    else:
        return n * fact(n-1)

num = eval(input("请输入一个正整数: "))
print(fact(num))
应用
其它
字符串中插入变量并打印
要在字符串中插入变量并打印,你可以使用字符串的格式化操作。
在Python中,有几种方法可以实现这个目的,
包括使用字符串的format()方法、
使用f-strings(格式化字符串字面值)
或使用旧版本的字符串插值操作符"%"。
下面是使用这些方法在字符串中插入变量并打印的示例:
- 使用
format()方法:
name = "Alice"
age = 25
print("My name is {} and I am {} years old.".format(name, age))
- 使用f-strings(格式化字符串字面值):
name = "Alice"
age = 25
print(f"My name is {name} and I am {age} years old.")
- 使用旧版本的字符串插值操作符"%":
name = "Alice"
age = 25
print("My name is %s and I am %d years old." % (name, age))
复制数据 copy()和deepcopy
copy库有copy()和deepcopy()函数
- copy()是浅拷贝, 只拷贝一层, 有嵌套的慎用, .copy()函数可以不用导入copy库, python自带
- deepcopy()是深拷贝, 创建新的存储,需要导入copy库
两者详细区别可参考下面博文链接
https://blog.csdn.net/weixin_50829653/article/details/127675849
inport copy
d1 = [1,2,3]
d2 = copy.deepcopy(d1)
d2[1] = 100
print(d1)
print(d2)

# [1, 2, 3]
# [1, 100, 3]
读取文件夹内某一后缀的所有文件 glob,os
import glob
import os
path = "C:\\Users\\Dell\\Desktop\\"
file_path = glob.glob(os.path.join(path, '*.txt'))  # 读取指定后缀的文件名, 是绝对路径
# file_path = glob.glob(path + '*.txt')             # 使用+号的方法

print(file_path[0].split("\\")[-1])            # 去掉第一个文件的路径只提取文件名
print(os.path.basename(file_path[0]))          # 使用函数的方法, 去掉第一个文件的路径只提取文件名

file_name = os.listdir(path))                # 读取指定目录下的所有文件名, 不带路径的所有文件名
print(os.path.splitext(file_name[0])[0])     # 将文件名分离为名称和后缀

for root, dirs, files in os.walk(path):           #  查找并子目录所有文件
	print('当前目录:', root)                     # 打印当前目录的路径
	print('子文件夹:', dirs)                     # 打印该目录下的所有子文件夹
	print('文件名:', files)                      # 打印该目录下的所有文件名
	for filename in files:
		print('绝对路径:', os.path.join(root, filename))   # 拼接为绝对路径,来读取文件
将字符串按照指定位数用0在前面补全
.zfill(6)
str = ["1name","11name"]
for i in str:
    print(i, len(i))              # 读取字符串长度
print(str[0].zfill(6))            # 在左用0补齐
# -->
# 1name 5
# 11name 6
# 01name
#-->
获取下标的函数 .index()
data = list(range(1,10))
print(data)
data.index(5)
判断数据类型 isinstance(), type()
python的数据类型有:数字(int)、浮点(float)、字符串(str),列表(list)、元组(tuple)、字典(dict)、集合(set)。
value  = [1, 0.2, 'wang', True, False]
isinstance(value[2], str)  # 返回bool类型
# -> True

type(value[1])
# -> float
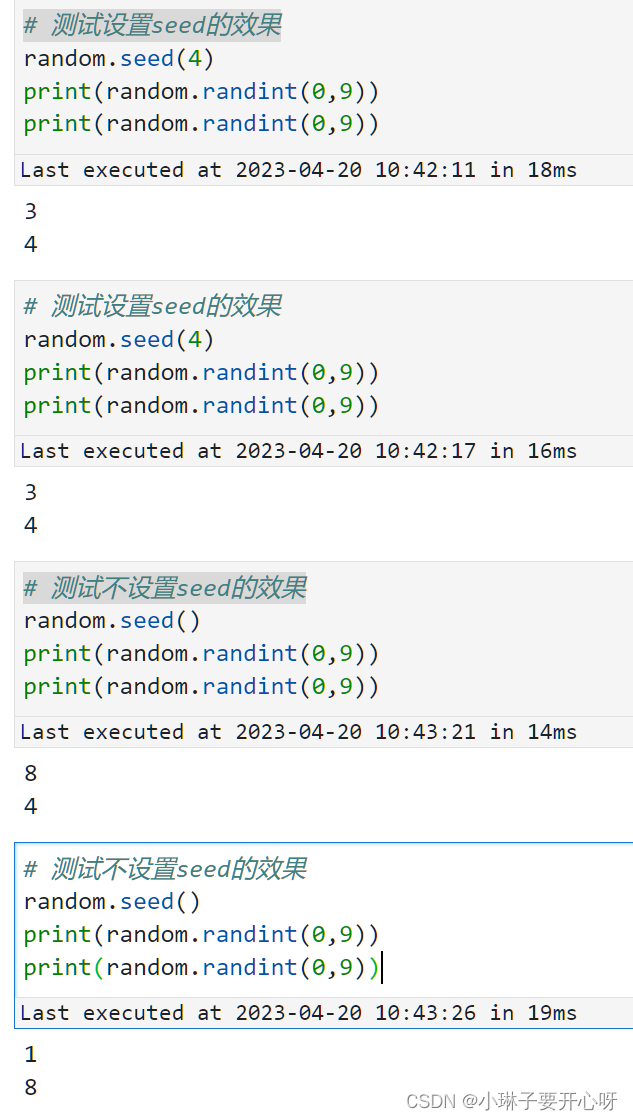
生成随机数 random.randint(0, 10)
参考自
- https://blog.csdn.net/m0_51526532/article/details/121270833
- https://zhuanlan.zhihu.com/p/474425448
下面示例来自random库。
此外,还可以学一下来自numpy.random, 能设置生成随机数的数量,
import random
#random.seed(1)       # 设置种子,设置之后每次运行生成的随机数都相同,测试如下面图片。不懂可以不写, 会根据时间自行设置。
random.random()       # 没有参数,返回一个[0.0,1.0)之间的随机小数
random.uniform(1,2)  # 返回一个[1.0, 2.0)之间的随机小数
random.randint(0, 9)  # 返回一个[0,9]之间的随机整数
random.choice([1,5.4,-1,'wang',(7,8,9)])   # 从序列中获取一个随机元素,list, tuple, 字符串都属于sequence。
random.sample([1,5.4,-1,'wang',(7,8,9)], 3)  # 从指定序列中获取指定个数的随机元素。
random.randrange([start], stop[, step])  #  从指定范围(start, stop[, step])内,按指定基数递增的集合中获取一个随机数。和randint()类似,但是不包括两端
list = [1,2,3,4] ; random.shuffle(list); print(list)  # 将一个列表内的元素顺序打乱,随机排列
使用 numpy.random生成随机数
np.random.rand(2,3)            # rand(d0, d1, ..., dn),可以生成指定形状的[0,1)范围之间的随机值。
np.random.randint(1,10,(3,4))  #  (low, high=None, size=None, dtype=int), 返回随机指定size的随机整数。只输入一个参数表示返回[0,low)的一个整数;输入2个参数表示返回[low,high)之间的一个整数;输入三个参数(或者指定size),返回指定size的[low,high)之间的数值

np.random.choice([1,2.5,-1,-2], size=(2,2)) # (a, size=None, replace=True, p=None) 从给定的一维数组生成指定size的随机样本,replace参数表示是否放回,P表示每个数被抽取的概率
np.random.random_sample((3,4))              # random_sample(size=None), 在半开放间隔[0.0,1.0)中返回随机小数。
np.random.shuffle()                         # shuffle(x), x可以是要搅乱的数组、列表或可变序列。通过打乱序列的内容,在适当的位置修改序列。如果数据为为多维数组,只沿第一条轴洗牌.
a =[[1,2,3],[4,5,6]]; np.random.shuffle(a); print(a)
np.random.permutation()                    # permutation(x), 随机排列序列,或返回排列后的范围。
a =[[1,2,3.1,4,5]];  np.random.permutation(a) # 直接返回打乱后的序列,shuffle只是修改

np.random.randn(3,4)           # randn(d0, d1, ..., dn), 从“标准正态”分布中返回一个(或多个)样本
np.random.random(3,4)               # (size=None), 输入参数为形状, 返回[0,1)之间指定szie下的随机数
np.random.standard_normal((3,1))    # (size=None), 输入参数为形状, 从标准正态分布中抽取样本(平均值=0,标准差=1)

np.random.seed(2)                   # 设置随机种子,保证每次的结果相同
np.random.seed(2); np.random.randint(10);
np.random.seed(2); np.random.randint(10);   # 设置相同的随机种子之后两次运行结果一样
查看列表的长度(或维度)len(); np.shape()
# 使用len()查看长度
data = [[1,2,3],[4,5,6]]
print(len(data))   # -> 2

# 使用numpy的shape()查看维度
import numpy as np
print(np.shape(data))  # ->(2,3)
列表的切片索引只能是整数,而pandas的数据框切片索引可以是列表
# 列表的切片索引
data = [[1,2,3],[4,5,6]]
print(data[0][0])

# 数据框的切片索引
import pandas as pd
data_df = pd.DataFrame(data)
print(data_df.shape)
print(data_df.iloc[0,[0,1]])
科学计算
- 除法取整
//
7//4 # 1 - 除法取余
- %
7%4 # 3

统计列表中数值出现的次数
参考链接: https://blog.csdn.net/qdPython/article/details/120887619
列表 list
学习过程中发现列表还是很很常见的, 内置函数的使用也是很方便, 需要总结一下
创建列表
- list(iterable=(), /)
Built-in mutable sequence.
If no argument is given, the constructor creates a new empty list.
The argument must be an iterable if specified.
data = list()
data = [1,2,3]
列表的内置函数
参考链接:https://blog.csdn.net/weixin_37645480/article/details/124198423
追加 append
- data.append(object, /)
Append object to the end of the list.
注意不返回, 直接追加在object最后
data = [1,2,3]
data.append(4)
print(data)
# -> [1,2,3,4]
插入 insert
- data.insert(index, object, /)
Insert object before index.
在指定下标index位置插入, 原位置的依次往后排.
data = [1,2,3]
data.insert(1, 4)
print(data)
# -> [1,4,2,3]

# 列表很长,插在后部不好找索引,可以用反序插在倒数的位置(-1,-2,-3...), 原来位置的数往后排
data = [1,2,3]
data.insert(-1,4)
print(data)
# -> [1,2,4,3]
删除 remove(x)、pop(index)、clear()
- data.remove(value, /)
Remove first occurrence of value.
Raises ValueError if the value is not present.
按照内容删除, 删除第一次出现的值.
data = [1,2,3]
data.remove(2)
print(data)
# -> [1, 3]
- data.pop(index=-1, /)
Remove and return item at index (default last).
Raises IndexError if list is empty or index is out of range.
按照下标删除, 会返回索引的值.
data = [1,2,3]
print(data.pop(1))
# -> 2
print(data)
# -> [1, 3]
- data.clear()
Remove all items from list.
移除列表所有items.
data = [1,2,3]
data.clear()
print(data)
# -> []
扩展 extend
- data1.extend(iterable, /)
Extend list by appending elements from the iterable.
通过从可迭代项中追加元素来扩展列表。
看起来和append相似,实际不一样.
append如果追加列表2到列表1, 会在在列表1嵌套列表2.
Extend则会把列表2的元素合并在列表1中.
此外Extend效果与+类似.
data1 = [1,2,3]
data2 = [4,5,6]
data1.extend(data2)
print(data1)
# -> [1, 2, 3, 4, 5, 6]

# 区别于append的效果
data1 = [1,2,3]
data2 = [4,5,6]
data1.append(data2)
print(data1)
# -> [1, 2, 3, [4, 5, 6]]

# 类似于+的效果
data1 = [1,2,3]
data2 = [4,5,6]
print(data1+data2)
# -> [1, 2, 3, 4, 5, 6]
索引 index
- data.index(value, start=0, stop=9223372036854775807, /)
Return first index of value.
Raises ValueError if the value is not present.
返回与value在data中的第一个值的索引.
data = [1,2,3]
print(data.index(2))
# -> 1
次数 count
- data.count(value, /)
Return number of occurrences of value.
返回值的出现次数。
data = [1,2,3,3,4,3,4]
print(data.count(4))
# -> 2
倒序 reverse
- data.reverse()
Reverse IN PLACE.
data = [1,2,3]
data.reverse()
print(data)
# -> [3, 2, 1]
升序 sort; sorted
参考链接: https://baijiahao.baidu.com/s?id=1760420005175167476&wfr=spider&for=pc
- data.sort(*, key=None, reverse=False)
Sort the list in ascending order and return None.
The sort is in-place (i.e. the list itself is modified) and stable (i.e. theorder of two equal elements is maintained).
If a key function is given, apply it once to each list item and sort them,
ascending or descending, according to their function values.The reverse flag can be set to sort in descending order.
按升序对列表进行排序,然后返回None。
key参数可以设置排序规则,比如字符长度len.
reverse参数还能设置倒序.
data = [1,4,3,2]
data.sort()
print(data)
# -> [1, 2, 3, 4]

# 测试key参数功能
# 按照字符串长度排序
words = ["apple", "banana", "cat", "dog", "elephant"]
words.sort(key=len)
print(words)
# -> ['cat', 'dog', 'apple', 'banana', 'elephant']

# 先按照元素长度排序,然后再按照首字母排序:
words = ['pear', 'banana', 'apple', 'kiwi', 'orange']
words.sort(key=lambda x: (len(x), x[0]))
print(words)
# -> ['kiwi', 'pear', 'apple', 'banana', 'orange']

#reverse参数还能设置倒序. 不过只倒序还是使用reverse吧
numbers = [3, 5, 2, 8, 1, 9]
numbers.sort(reverse=True)
print(numbers)
# -> [9, 8, 5, 3, 2, 1]
- 对元组等不可变类型进行排序,
对于Python内置的不可变类型(如字符串、元组等),sort()函数无法修改原对象,需要使用sorted()函数。 - sorted(iterable, /, *, key=None, reverse=False)
Return a new list containing all items from the iterable in ascending order.
A custom key function can be supplied to customize the sort order,
and thereverse flag can be set to request the result in descending order.
str = 'python'
sorted_str = sorted(str)
print(sorted_str)
# -> ['h', 'n', 'o', 'p', 't', 'y']
浅复制 copy
- data.copy()
Return a shallow copy of the list.
复制后, 修改新变量, 不会影响旧变量
找出现次数最多的数值 max()
print( max(data, key=data.count) )
计算列表维度len(); np.array(my_list).shape
- len()函数只能返回列表的长度,返回维度需要使用numpy库的shape属性
my_list = [[1, 2], [3, 4], [5, 6]]
print( len(my_list) )
- 将列表转换为numpy数组, 使用shape属性获取数组的维度
import numpy as np
my_list = [[1, 2], [3, 4], [5, 6]]
print( np.array(my_list).shape )
集合 set
参考链接: https://zhuanlan.zhihu.com/p/520476920
集合set是具有唯一元素的无序集合,它和列表很像.
但它只能包含唯一的元素,同时需要注意的是集合是无序的,也就是说集合中没有第一个、第二个元素之说.
通常我们只是说集合中是否含有这些元素。
创建集合
- set(self, /, *args, **kwargs)
set() -> new empty set object
set(iterable) -> new set object
Build an unordered collection of unique elements.
data = set()
data = {1,2,3}
用途
- 快速查找
inport numpy as
data = set( np.random.randint(0,100000,10000000) )
print(50 in data)
- 找列表的唯一值
data = [1,2,3,2,3,4,3,4,5]
data_unique = list(set(data))
print(data_unique)
# -> [1, 2, 3, 4, 5]
集合的内置函数
data = set([1,2,3])
data2 = set([2,3,4,5])
data.add(4); print(data) # 添加元素到集合
print( 3 in data ) # 判断元素是否在集合中, 返回bool值
data.remove(3); print(data) # 移除
data.discard(10); print(data) # 舍弃不存在的,也不会警告
print(data.union(data2)) # 计算并集
print(data.intersection(data2)) # 计算交集
print(data - data2) # 计算差集
numpy 数组操作
计算三维数组两个纬度的均值 np.mean(), np.nanmean()
#来自chatgpt
import numpy as np
# 创建一个三维数组
arr = np.array([[[1, 2, 3],
                 [4, 5, 6]],
                [[7, 8, 9],
                 [10, 11, 12]]])

# 计算第一个维度(轴0)和第三个维度(轴2)的均值
mean_axis0 = np.mean(arr, axis=(0, 2))
print("第一个维度和第三个维度的均值:", mean_axis0)

# 计算第二个维度(轴1)和第三个维度(轴2)的均值
mean_axis1 = np.mean(arr, axis=(1, 2))
print("第二个维度和第三个维度的均值:", mean_axis1)

# 输出结果为:
# 第一个维度和第三个维度的均值: [ 4.5  5.5  6.5]
# 第二个维度和第三个维度的均值: [ 3.5  9.5]
- 此外,有空值的话需要使用np.nanmean(arr),
- 或者,使用np.isnan()剔除nan值,np.mean(~np.isnan(arr))
- 如果, 有inf值的话可以使用np.isinf()剔除异常值,np.mean(~np.isinf(arr))
保存和加载 .npy文件 np.save() np.load()
#  保存
import numpy as np
a=np.arange(5)
np.save('test.npy',a)

# 加载
a=np.load('test.npy')
print(a)

# 同时保存多个数组
a=np.arange(3)
b=np.arange(4)
c=np.arange(5)
np.savez('array_save.npz',a,b,c_array=c)

# 加载多个数据
A=np.load('array_save.npz')
print(A['arr_0'])
print(A['arr_1'])
print(A['c_array'])
保留指定小数点位数 np.round(arr,2)
需要将多个数值都保留两位小数打印
使用round()不行, 不支持列表,元组等格式
- np.round()可以, 支持将列表元组等
import numpy as np
print(np.round([z_95, z_99, z_995, z_999, z_max, z_95_mean], 2))
字符串和数字打印样式 print(“%.2f” % 0.13333)
https://blog.csdn.net/qq_17576739/article/details/120720019
(Python 格式化输出保留两位小数)
%s : 字符串
%d :十进制整数
%f : 浮点型, %.3f: 保留三位小数
%x : 十六进制
指定长度:
%5d 右对齐,不足左边补空格
%-5d - 代表左对齐,不足右边默认补空格
%05d 右对齐,不足左边补0
浮点数:
%f
默认是输出6位有效数据, 会进行四舍五入
指定小数点位数的输出 %.2f—保留小数点后2位
‘%4.8f’
4代表整个浮点数的长度,包括小数,只有当字符串的长度大于4位才起作用.不足4位空格补足,可以用%04.8使用0补足空格
#方法1:
print("%.2f" % 0.13333)   # 0.13
print("%02d"%1)   # 01     右对齐,不足左边补0

#方法2
print("{:.2f}".format(0.13333))
#方法3
round(0.13333, 2)
计算百分位 np.percentile(arr, 95)
np.percentile(a, q, axis=None, out=None, overwrite_input=False, interpolation=‘linear’, keepdims=False)
- a : array,用来算分位数的对象,可以是多维的数组
- q : 介于0-100的float,用来计算是几分位的参数,如四分之一位就是25,如要算两个位置的数就(25,75)
- axis : 坐标轴的方向,一维的就不用考虑了,多维的就用这个调整计算的维度方向,取值范围0/1
- out : 输出数据的存放对象,参数要与预期输出有相同的形状和缓冲区长度
- overwrite_input : bool,默认False,为True时及计算直接在数组内存计算,计算后原数组无法保存
- interpolation : 取值范围{‘linear’, ‘lower’, ‘higher’, ‘midpoint’, ‘nearest’}
默认liner,比如取中位数,但是中位数有两个数字6和7,选不同参数来调整输出 - keepdims : bool,默认False,为真时取中位数的那个轴将保留在结果中
import numpy as np
a = np.array([[6,10,11],[3,2,12]])
print(a)
print(np.percentile(a, [0,25,50,75,100]))
# [ 2.    3.75  8.   10.75 12.  ]
# 线性插值法计算百分位数

a = np.array([[10,7,4],[3,2,1]])
np.percentile(a, 50, axis=0) # 对行  array([6.5, 4.5, 2.5])
np.percentile(a, 50, axis=1) # 对列  array([7., 2.])
np.percentile(a, 50, axis=1, keepdims=True) # 保持维度不变
'''
array([[7.],
       [2.]])
'''
 - 不过针对不同的数据类型使用相应的函数, 速度会更快一点
针对DataFrame数据的复制可以使用 pd.DataFrame(data, copy=True)函数
d2 = pd.DataFrame(d1, copy=True)
```python
import pandas as pd
d1 = pd.DataFrame([[1,2,3], [4,5,6]])
d2 = pd.DataFrame(d1, copy=True)
d2[1,1] = 100
print(d1)
print(d2)
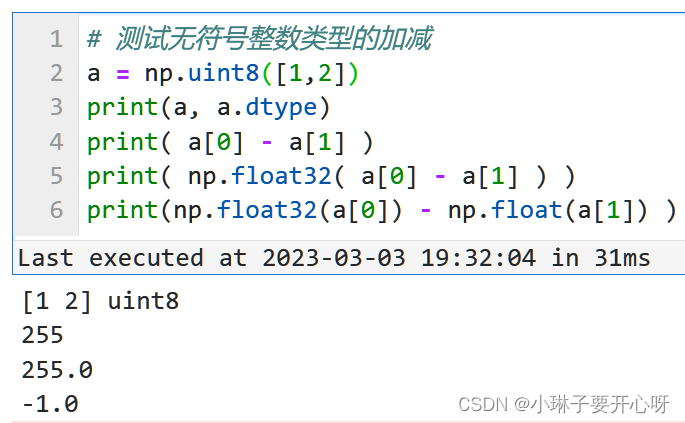
科学计算前要修改为浮点类型 np.float32()
遇到的问题:
无符号整数类型的(uint8)的两个数相减,结果就算是负数, 也会被uint8数据类型改为正。
想要得到正确的计算结果, 需要先将数据格式转换为float, 再进行科学计算.
按照行列拼接两个矩阵 np.r_[], np.c_[]
import numpy as np
a1 = np.array([1,2,3])
a2 = np.array([4,5,6])
print(a1,a2)
a3 = np.r_[a1,a2]   # 按照行拼接
print(a3)
a3_1 = np.r_[a1,a2,7,8,9]
print(a3_1)
a4 = np.c_[a1,a2]  #  # 按照列拼接
print(a4)
a4_1 = np.c_[a1,a2, [7,8,9]]
print(a4_1)
计算数组的唯一(不重复)元素和出现的频数 np.unique()
参考链接: https://blog.csdn.net/qdPython/article/details/120887619
- 使用numpy的unique
np.unique(
ar,
return_index=False,
return_inverse=False,
return_counts=False,
axis=None,
)
查找数组的唯一元素。返回一个数组中经过排序的唯一元素。
除了唯一元素外,还有三个可选的输出:
给出唯一值的输入数组的索引
重构输入数组的唯一数组的索引
每个唯一值在输入数组中出现的次数
# 计算随机抽取1-10之间的10个数的唯一值和频率
import numpy as np
data_unique, data_count = np.unique(data, return_counts=True)
count = [(data_unique[i], data_count[i]) for i in range(len(data_unique))]
print(dict(count))
# -> {2: 1, 4: 1, 6: 2, 7: 2, 9: 1, 10: 3}
- 使用python自带的count也能实现
# 测试随机取样
import numpy as np
data = np.random.randint(1, 11, 10)
data_count = [(i,list(data).count(i)) for i in range(1,11)]
print(data_count)
求两个数组的交集 np.intersect1d( )
- 方法一
import numpy as np
# 假设 unique_trait_gen 和 unique_yield_gen 是两个 NumPy 数组
unique_trait_gen = np.array([1, 2, 3, 4, 5])
unique_yield_gen = np.array([3, 4, 5, 6, 7])
# 计算交集
intersection = np.intersect1d(unique_trait_gen, unique_yield_gen)
print(intersection)
- 方法二
import numpy as np
# 假设 unique_trait_gen 和 unique_yield_gen 是两个 NumPy 数组
unique_trait_gen = np.array([1, 2, 3, 4, 5])
unique_yield_gen = np.array([3, 4, 5, 6, 7])
# 将 NumPy 数组转换为集合
unique_trait_gen_set = set(unique_trait_gen)
unique_yield_gen_set = set(unique_yield_gen)
# 计算交集
intersection = unique_trait_gen_set.intersection(unique_yield_gen_set)
print(intersection)
pandas
创建DataFrame格式数据 pd.DataFrame([1,2,3])
import pandas as pd
import numpy as np
# 创建空数据框
df = pd.DataFrame()
df.info()

# Empty DataFrame
# Columns: []
# Index: []

# 通过字典创建数据框
dic = {"a": [1, 2, 3, 4],           # 列表
       "a2": ['a','b','c','d'],     # 列表, 注意pd中将str识别为object
       "b": np.array([4, 5, 6, 7]), # 数组
       "c": (1, 2, 3, 4),           # 元组
       "d" : pd.series(3,4,5,6)}    # pd的series

data = pd.DataFrame(dic, index=["一", "二", "三", "四"]) # 创建Dataframe
df.columns = ["A",'A2', "B", "C"]   # 修改Columns和名称
df.info()

# 通过列表创建数据框
ls = np.arange(12).reshape(3, 4)  # 创建二维数组
df = pd.DataFrame(ls)
参考链接:
- Python:Pandas创建Dataframe数据框的六种方法
https://blog.csdn.net/DY7778F/article/details/119782352
读取和保存csv格式文件pd.read_csv(); data.to_csv()
import pandas as pd
# 读取 .csv文件
df = pd.read_csv('./data/test.csv')
# 保存 .csv文件
data = pd.DataFrame( { 'name':['wang','li'], 'age':[27, 18] } )
data.to_csv("test.csv", index=False, sep=',')
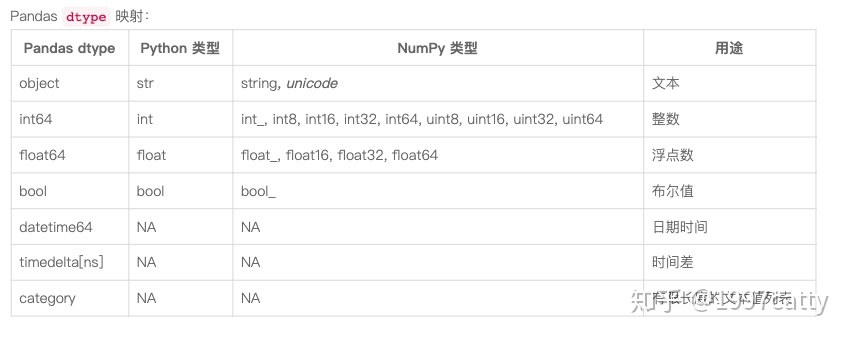
Pandas中的object数据类型
注意Python中的str和Numpy中的string、unicode(字符编码) ,在Pandas中都表示为object,也就是字符串在Pandas中的类型为object。
由于Python中一切皆对象,对于由多种数据类型组成的字段,也会将他们都处理为最宽泛的"对象"也就是object了。
参考链接:
- Pandas中的object数据类型|Python
https://zhuanlan.zhihu.com/p/161073173?utm_id=0
打印变量和字符串 print(f’D:\test{name}')
使用变量和字符串给文件名命名
# 1. 使用f-string语法(这个比较直观, 推荐使用)
# 直接在需要添加变量的位置添加大括号和变量名, 最后在引号前面加上f
name = 'tem.txt'
print(f'D:\test\{name}')
file = open(f'D:\test\{name}')
# 2. 使用转换说明符(占位符),需要用表示字符串类型的%s或者%r
name = 'tem.txt'
print(f'D:\test\%s'%name)
file = open(’'D:\test\%s'%name)
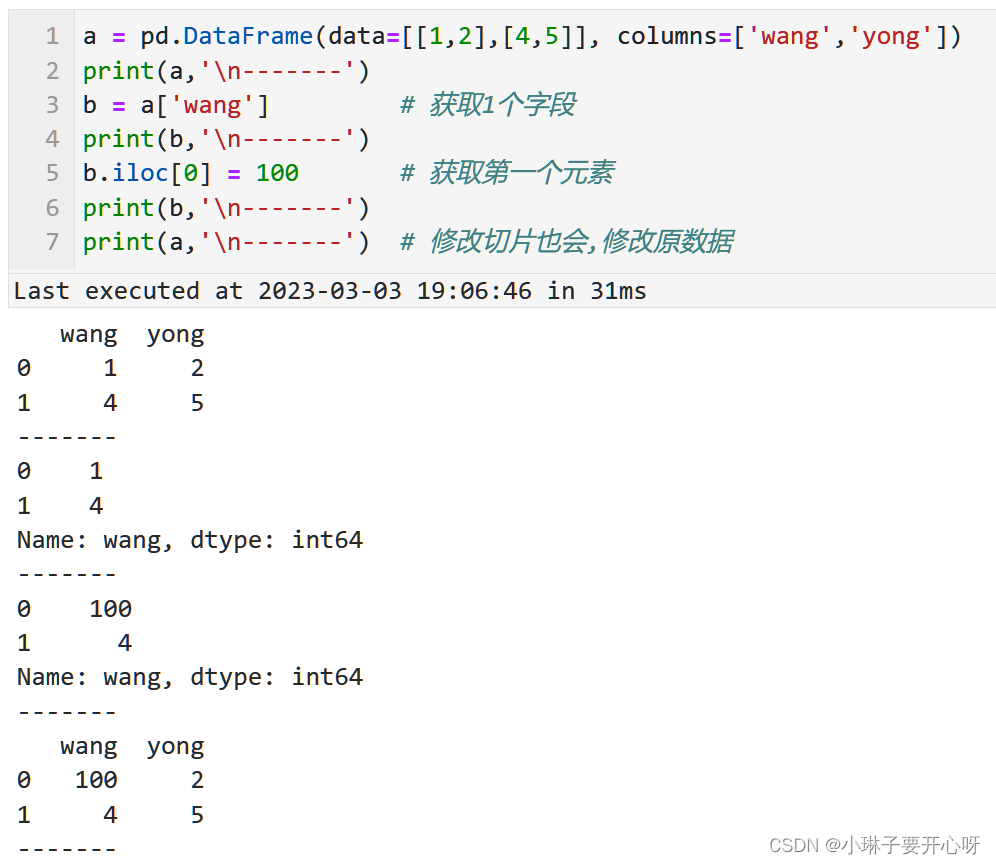
小心切片会改变原数据 .copy() copy.deepcopy()
注意:
使用切片或者等号(=)从数据框获取的数据框或者series, 如果发生修改会影响原数据.
可以使用copy库中的 .deepcopy() 函数进行深拷贝
或者使用python自带的 .copy()函数进行浅拷贝
数据类型转换 df.astype(‘float32’, errors=‘raise’)
- padans的dataframe列数据格式转换
方法一
pandas.to_numeric(arg, errors=‘raise’, downcast=None)
将参数arg转为numpy数值类型
- arg:需要被转换的参数;
- errors:默认’raise’,处理错误的方式,可选{‘ignore’, ‘raise’, ‘coerce’};
‘ignore’:无效的转换将返回输入;
‘raise’:无效的转换将引发异常;
‘coerce’:无效的转换将设为NaN; - downcast:默认None, 可选{‘integer’, ‘signed’, ‘unsigned’, ‘float’};
如果不是None,并且数据已成功转换为数字数据类型,则根据一定规则将结果数据向下转换为可能的最小数字数据类型;
‘integer’ 或 ‘signed’: 最小的有符号整型(numpy.int8);
‘unsigned’: 最小的无符号整型(numpy.uint8);
‘float’: 最小的浮点型(numpy.float32);
方法二
(不知道为啥方法1总是不成功, 所有找到方法二)
使用函数 df.astype(‘float32’,errors=‘raise’)
df.astype('float32',errors='raise').dtypes    # 转换整个数据框
df[['red', 'green']].astype('float32', errors='raise').dtypes  # 转换整数据框里面的某些字段
df.astype({'red':'float32', 'green':'int16'} errors='raise').dtypes  # 转换整数据框里面的某些字段
python自带函数的数据格式转换
int(x [,base ]) 将x转换为一个整数
long(x [,base ]) 将x转换为一个长整数
float(x ) 将x转换到一个浮点数
complex(real [,imag ]) 创建一个复数
str(x ) 将对象 x 转换为字符串
repr(x ) 将对象 x 转换为表达式字符串
eval(str ) 用来计算在字符串中的有效Python表达式,并返回一个对象
tuple(s ) 将序列 s 转换为一个元组
list(s ) 将序列 s 转换为一个列表
chr(x ) 将一个整数转换为一个字符
unichr(x ) 将一个整数转换为Unicode字符
ord(x ) 将一个字符转换为它的整数值
hex(x ) 将一个整数转换为一个十六进制字符串
oct(x ) 将一个整数转换为一个八进制字符串
pabdas的DataFrame数据框操作
子集选取的三种方法:[]、.loc[]、.iloc[]
参考链接:https://zhuanlan.zhihu.com/p/510379173
- 快捷的整行整列选取 df[]
df[1:4]  # 切片
df['数学']  # 列
df[['数学', '语文']]   # 多列
- 按标签的行列交叉选取 df.loc[]
df.loc['小王','数学']
- 按位置序号的行列交叉选取 df.iloc[]:
df.iloc[1, 2]
df.iloc[1, [0,2]]
df.iloc[:, 2]
df.iloc[:, [0,2]]
- 按照一定条件抽取数据:
df[ (df['语文'] > 105) & (df['数学'] > 80]) ]
添加新列 df[‘age’] =
df = pd.DataFrame()
df['age'] = [18, 20, 25]
print(pd)
删除指定列 data.drop()
# 删除"ndvi"这一列,并且覆盖源数据
data.drop(columns = 'ndvi', inplace = True)
按照行拼接两个数据框 pd.concat()
拼接两个DataFrame
d = pd.concat([d1, d2])
import pandas as pd
d1 = pd.DataFrame([[1,2,3], [4,5,6]])
d2 = pd.DataFrame([[7,7,7], [8,8,8]])
d = pd.concat([d1, d2])
print(d)
按照指定列合并两个数据框 pd.merge()
在Python中,可以使用pandas库中的merge、join或concat函数来合并两个DataFrame。
使用merge函数按照一个或多个键(列)合并行:
import pandas as pd
# 创建两个DataFrame
df1 = pd.DataFrame({'key': ['A', 'B', 'C', 'D'],
                    'value': [1, 2, 3, 4]})
df2 = pd.DataFrame({'key': ['B', 'D', 'D', 'E'],
                    'value': [5, 6, 7, 8]})
# 按照'key'列合并
result = pd.merge(df1, df2, on='key')
使用join函数基于索引列合并两个DataFrame:
result = df1.join(df2, lsuffix='_left', rsuffix='_right', on='key')
使用concat函数在轴向上合并多个DataFrame:
result = pd.concat([df1, df2], axis=0)  # 按行合并
# 或者
result = pd.concat([df1, df2], axis=1)  # 按列合并
将数据框的两列合并为新的一列 df[] = df[] + df[]
VI["date_geno_trea"] = VI["date"].astype(str) + "_" + VI["genotype_num"].astype(str)
修改数据列名称 df.rename()
import pandas as pd
# 创建一个数据框
data = {'Name': ['Alice', 'Bob', 'Charlie'],
        'Age': [25, 30, 35],
        'Gender': ['Female', 'Male', 'Male']}
df = pd.DataFrame(data)
print(df.columns)  # 查看数据框名称
df.rename(columns={'Name': '姓名', 'Age': '年龄', 'Gender': '性别'}, inplace=True)  # 使用rename()函数修改列名
print(df)
或者
# 直接赋值给columns属性修改列名
df.columns = ['姓名', '年龄', '性别']
通过替换的方式修改数据框列名
import pandas as pd
# 创建一个示例 DataFrame
data = {
    'A_x': [1, 2, 3],
    'B_x': [4, 5, 6],
    'C_y': [7, 8, 9]
}
df = pd.DataFrame(data)
# 打印修改前的列名
print("修改前的列名:", df.columns)
# 使用 rename 方法去除 "_x"
df.rename(columns=lambda x: x.replace('_x', ''), inplace=True)
# 打印修改后的列名
print("修改后的列名:", df.columns)
或者
# 使用列表推导修改列名
df.columns = [col.replace('_x', '') for col in df.columns]
删除带有某些字符的列 df.drop()
import pandas as pd
# 创建一个示例 DataFrame
data = {
    'A_x': [1, 2, 3],
    'B_x': [4, 5, 6],
    'C_y': [7, 8, 9],
    'D_y': [10, 11, 12]
}
df = pd.DataFrame(data)
# 使用列表推导创建一个新的列名列表,去除所有包含 "_y" 的列名
columns_to_drop = [col for col in df.columns if '_y' in col]
# 使用 drop 方法删除这些列
df.drop(columns=columns_to_drop, inplace=True)
# 打印删除后的 DataFrame
print(df)
从一个数据框中提取某一列在给定数集内的所有行 df[df[’ '].isin( )]
import pandas as pd
# 示例数据
data = {
    'A': [1, 2, 3, 4, 5],
    'B': ['a', 'b', 'c', 'd', 'e']
}
df = pd.DataFrame(data)
# 给定的数集
given_set = [2, 4]
# 提取'A'列在给定数集内的所有行
filtered_df = df[df['A'].isin(given_set)]
print(filtered_df)
将数据按照比例随机拆分为训练集和测试集 train_test_split(X, y, test_size=0.2, random_state=42)
from sklearn.model_selection import train_test_split
x_index, y_index = train_test_split([x for x in range(1, 111) if x != 108], test_size=0.2, random_state=1)
import pandas as pd
from sklearn.model_selection import train_test_split
# 示例数据
data = {
    'feature1': [1, 3, 5, 7, 9],
    'feature2': [2, 4, 6, 8, 10],
    'label': [1, 0, 1, 0, 1]
}
df = pd.DataFrame(data)
# 定义特征和标签
X = df[['feature1', 'feature2']]
y = df['label']
# 拆分数据集
X_train, X_test, y_train, y_test = train_test_split(X, y, test_size=0.2, random_state=42)
print("X_train:\n", X_train)
print("X_test:\n", X_test)
print("y_train:\n", y_train)
print("y_test:\n", y_test)
将5天数据插值到13天 interp1d()
import numpy as np
from scipy.interpolate import interp1d
# 原始数据
x = np.array([1, 2, 3, 4, 5])  # 日期
y = np.array([10, 15, 20, 25, 30])  # 数据
# 创建插值函数
f = interp1d(x, y, kind='linear')
# 生成13天的数据
new_x = np.linspace(1, 5, 13)
# 进行插值
interpolated_y = f(new_x)
# 输出插值后的数据
for day, data in zip(new_x, interpolated_y):
    print(f"Day {day}: {data}")
保存图片
plt的savefig()函数
savefig(fname, *, dpi='figure', format=None, metadata=None,
          bbox_inches=None, pad_inches=0.1,
          facecolor='auto', edgecolor='auto',
          backend=None, **kwargs
         )
- fname:str,可以带路径、带图片格式后缀的文件名
- format:str,可以自动从fname中识别,可以不用填
- dpi:float,表示分辨率
- bbox_inches: str,调整保存的图片白边样式(紧凑)。可选 bbox_inches=‘tight’,或者默认不写。
plt.savefig('hist.png', dpi=600, bbox_inches='tight')
设置figure尺寸和axis的边界
fig = plt.figure( figsize=(4,3) )
ax = fig.add_axes([0.15,0.15,0.8,0.80])
ax.hist(data)
ax.set_title('title')
ax.xlabel('xlabel')
ax.ylabel('ylabel')
plt.show()
- 让边界变得紧凑,少一些白边,还有一个简单的办法。
在保存图片的时候加上参数 bbox_inches=‘tight’。
plt.savefig('hist.png', dpi=600, bbox_inches='tight')
添加文本
# annotate()   使用绝对位置
plt.annotate("z_max", xy=(800, 12000),xytext=(700, 12000))
# text() 使用绝对位置
plt.text(800, 12000, "z_max")
# figtext() 使用相对位置
plt.figtext(0.9, 1, "z_max")
添加横竖线
- axvline() 添加竖线
plt.axvline(800, color=‘r’) - axvline() 添加横线
plt.axhline(800, c=‘r’, ls=‘–’, lw=2)
画子图(plt.subplots)
fig, axes = plt.subplots(nrows=2, ncols=3, figsize=(15,4))
axes[0][0].hist(pc_unit1.red, range=(0,150), bins=50)
axes[0][0].set_title(“red”)
axes[1][0].hist(pc_new.red, range=(0,150), bins=50)
axes[1][0].set_title(“red_new”)
axes[0][1].hist(pc_unit1.green, range=(0,150), bins=50)
axes[0][1].set_title(“green”)
axes[1][1].hist(pc_new.green, range=(0,150), bins=50)
axes[1][1].set_title(“green_new”)
axes[0][2].hist(pc_unit1.blue, range=(0,150), bins=50)
axes[0][2].set_title(“blue”)
axes[1][2].hist(pc_new.blue, range=(0,150), bins=50)
axes[1][2].set_title(“blue_new”)
调整子图的间距 plt.subplots_adjust()
plt.subplots_adjust(left=None,bottom=None,right=None,top=None,wspace=0.2,hspace=0.25)
# left : float, optional,The position of the left edge of the subplots, as a fraction of the figure width.
# right : float, optional,The position of the right edge of the subplots, as a fraction of the figure width.
#bottom : float, optional The position of the bottom edge of the subplots, as a fraction of the figure height.
# top : float, optional,The position of the top edge of the subplots,    as a fraction of the figure height.
# wspace : float, optional,The width of the padding between subplots,    as a fraction of the average Axes width.
# hspace : float, optional,The height of the padding between subplots,    as a fraction of the average Axes height.
画箱线图(plt.boxplot)
plt.boxplot(x, labels=[‘top’, ‘mid’, ‘bot’])
- x :绘图数据。
- notch :是否以凹口的形式展现箱线图,默认非凹口。
- sym:指定异常点的形状,默认为+号显示。
- vert :是否需要将箱线图垂直放,默认垂直放。
- whis :指定上下须与上下四分位的距离,默认为1.5倍的四分位差。
- positions :指定箱线图位置,默认为[0,1,2.…]。
- widths :指定箱线图宽度,默认为0.5。
- patch _ artist :是否填充箱体的颜色。
- meanline :是否用线的形式表示均值,默认用点表示。
- showmeans :是否显示均值,默认不显示。
- showcaps :是否显示箱线图顶端和末端两条线,默认显示。
- showbox :是否显示箱线图的箱体,默认显示。
- showfliers :是否显示异常值,默认显示。
- boxprops :设置箱体的属性,如边框色、填充色等。
- labels :为箱线图添加标签,类似于图例的作用。
- filerprops :设置异常值的属性,如异常点的形状、大小、填充色等。
- medianprops :设置中位数的属性,如线的类型、粗细等。
- meanprops :设置均值的属性,如点的大小、颜色等。
- capprops :设置箱线图顶端和末端线条的属性,如颜色、粗细等。
- whiskerprops :设置须的属性,如颜色、粗细、线的类型等。
画直方图(plt.hist)
matplotlib.pyplot.hist(x, bins=None, density=None,……kwargs*)
- bins: 指定bin(箱子)的个数。例如(bins=10)
- color: 设置箱子颜色。例如(color=‘r’)
- normed: 设置箱子密度。例如(normed=1)
- alpha: 设置透明度。例如(alpha=0.5)
- range: 设置x轴的范围。例如(range=(0,100))
- bottom: 设置y轴起始范围。例如(bottom=100)
- histtype:箱子类型。“bar”: 方形,“barstacked”: 柱形,“step”: “未填充线条”,“stepfilled”: “填充线条”。
- align:对齐方式。 “left”: 左,“mid”: 中间,“right”: 右。
- orientation 箱子方向。“horizontal”: 水平,“vertical”: 垂直。
- log,单位是否以科学计术法,bool。
画条形图(plt.bar)
- plt.bar(x, height, width=0.8, bottom=None, *, align=‘center’, data=None, **kwargs,)
plt.bar(x, height, width=0.8,bottom=None, *, align='center', data=None, **kwargs,)
Parameters
----------
x : float or array-like
    The x coordinates of the bars. See also *align* for the alignment of the bars to the coordinates.
height : float or array-like. The height(s) of the bars.
width : float or array-like, default: 0.8. The width(s) of the bars.
bottom : float or array-like, default: 0. The y coordinate(s) of the bars bases.
align : {'center', 'edge'}, default: 'center'
    Alignment of the bars to the *x* coordinates:
    - 'center': Center the base on the *x* positions.
    - 'edge': Align the left edges of the bars with the *x* positions.
    To align the bars on the right edge pass a negative *width* and  ``align='edge'``.
画水平条形图 plt.barh()
- plt.barh(y, width, height=0.8, left=None, *, align=‘center’, **kwargs)
plt.barh(y, width, height=0.8, left=None, *, align='center', **kwargs)
Parameters
----------
y : float or array-like.
    The y coordinates of the bars. See also *align* for the alignment of the bars to the coordinates.
width : float or array-like. The width(s) of the bars.
height : float or array-like, default: 0.8. The heights of the bars.
left : float or array-like, default: 0. The x coordinates of the left sides of the bars.
align : {'center', 'edge'}, default: 'center'
    Alignment of the base to the *y* coordinates*:
    - 'center': Center the bars on the *y* positions.
    - 'edge': Align the bottom edges of the bars with the *y* positions.
    To align the bars on the top edge pass a negative *height* and ``align='edge'``.
常见报错
SettingWithCopyWarning:A value is trying to be set on a copy of a slice from a DataFrame(Pandas库)
推荐看下面的博客, 写的很清楚.
- https://blog.csdn.net/Fwuyi/article/details/123519659
(SettingWithCopyWarning:A value is trying to be set on a copy of a slice from a DataFrame(Pandas库))
解决方案有两种
- 使用链式索引赋值会报错(使用多个中括号[ ][ ]提取dataframe数据)
推荐使用.loc和.iloc - 使用.loc和.iloc获取切片, 之后再对切片赋值, 也会报错
推荐在切片后面增加 .copy() 明确表示进行复制,不再是原dataframe的切片视图


 392
392


 被折叠的 条评论
为什么被折叠?
被折叠的 条评论
为什么被折叠?
 到【灌水乐园】发言


