import numpy as np
import random
import os
import math
import matplotlib.pyplot as plt
#step1:设置随机数种子,保证实验可以重复进行
seed=11
random.seed(seed)
np.random.seed(seed)
os.environ['PYTHONHASHSEED']=str(seed)#step2:构造拒绝接受机制_,判断采样值是否有效,并返回defacceptreject_():
sum_=(math.pow(1-0.4,5)-math.pow(0-0.4,5))/5
max_fx=math.pow(1-0.4,4)/sum_
samplesinx=[]
samplesoutx=[]
samplesiny=[]
samplesouty=[]for i inrange(2000):
x=random.uniform(0,1)
y=random.uniform(0,max_fx)if y<=math.pow(x-0.4,4)/sum_:
samplesinx.append(x)
samplesiny.append(y)else:
samplesoutx.append(x)
samplesouty.append(y)return(samplesinx,samplesiny,samplesoutx,samplesouty)#step3:生成绘图所需相关函数
sum_=(math.pow(1-0.4,5)-math.pow(0-0.4,5))/5
max_fx=math.pow(1-0.4,4)/sum_
x=np.linspace(0,1,100)
max_fx_=[max_fx for i in x]
fx=[math.pow(xi-0.4,4)/sum_ for xi in x]
samplesinx,samplesiny,samplesoutx,samplesouty=acceptreject_()#step4:绘采样结果的散点图
plt.figure(figsize=(16,4))
plt.subplot(1,2,1)
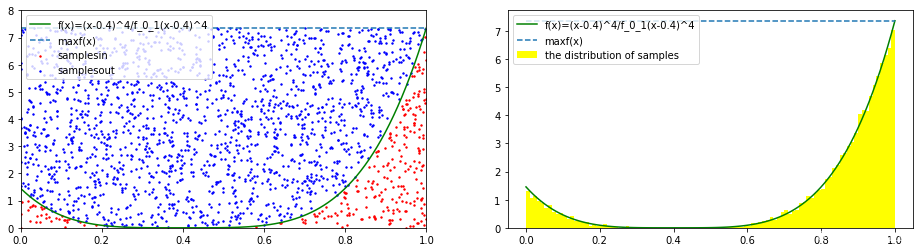
plt.plot(x,fx,color='green',label='f(x)=(x-0.4)^4/f_0_1(x-0.4)^4')
plt.plot(x,max_fx_,'--',label='maxf(x)')
plt.scatter(samplesinx,samplesiny,c='red', s=2,label='samplesin')
plt.scatter(samplesoutx,samplesouty,c='blue', s=2,label='samplesout')
plt.legend(loc="upper left")
plt.xlim(0,1)
plt.ylim(0,8)#step5:绘采样结果的直方图
plt.subplot(1,2,2)
plt.plot(x,fx,color='green',label='f(x)=(x-0.4)^4/f_0_1(x-0.4)^4')
plt.plot(x,max_fx_,'--',label='maxf(x)')
plt.hist(samples,bins=100,density=True,color='yellow',label="the distribution of samples")
plt.legend(loc="upper left")
plt.show()


 240
240


 被折叠的 条评论
为什么被折叠?
被折叠的 条评论
为什么被折叠?
 到【灌水乐园】发言


