


1.bar()的基础参数如下:
x:柱子在x轴上的坐标。
height:柱子的高度,即y轴上的坐标。
width:柱子的宽度。默认值为0.8。
bottom:柱子的基准高度。
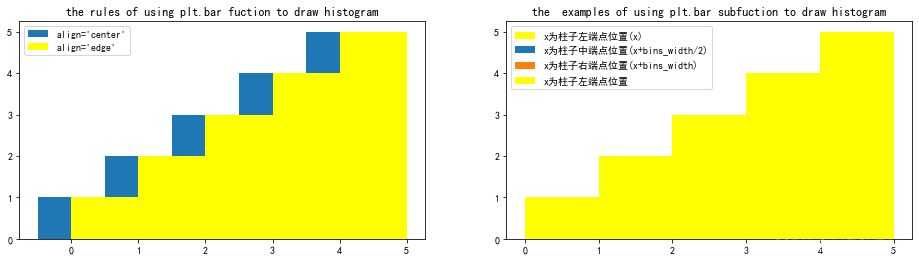
align:柱子在x轴上的对齐方式。取值范围为{‘center’, ‘edge’},默认为’center’。
‘center’:x为柱子中端点位置。align=‘center’。
‘edge’:x为柱子左端点位置。如果想让x位于柱子右侧,需要同时设置(负width 以及align=‘edge’)。
eg:
2.实验代码
import matplotlib.pyplot as plt
import os
x1=[0,1,2,3,4]
n1=[1,2,3,4,5]

bins_width=1
x2=[]
for i in x1:
    x2.append(i+bins_width/2)

x3=[]
for i in x1:
    x3.append(i+bins_width)

#plt.rcParams['font.sans-serif']=['SimHei']
#plt.rcParams['axes.unicode_minus'] = False

plt.figure(figsize=(16,4))
plt.subplot(1,2,1)
plt.title('the rules of using plt.bar fuction to draw histogram')
plt.bar(x1,n1,width=1,align='center',label="align='center'")
plt.bar(x1,n1,width=1,align='edge',color='yellow',label="align='edge'")
plt.legend()


plt.subplot(1,2,2)
plt.title('the  examples of using plt.bar subfuction to draw histogram')
plt.bar(x1,n1,width=1,align='edge',color='yellow',label='x为柱子左端点位置(x)')
plt.bar(x2,n1,width=1,align='center',label='x为柱子中端点位置(x+bins_width/2)')
plt.bar(x3,n1,width=-1,align='edge',label='x为柱子右端点位置(x+bins_width)')
plt.bar(x1,n1,width=1,align='edge',color='yellow',label='x为柱子左端点位置')
plt.legend()
plt.show()


 1万+
1万+


 被折叠的 条评论
为什么被折叠?
被折叠的 条评论
为什么被折叠?
 到【灌水乐园】发言


