


文章目录
前言
本文为《Task05 - 样式色彩秀芳华》笔记。
1 matplotlib全局样式设定
从头到尾保持绘图的样式。
1.1 matplotlib自带的样式
直接调用即可。
plt.style.use('default')
一共有26中自带样式:
print(plt.style.available)
['Solarize_Light2', '_classic_test_patch', 'bmh', 'classic', 'dark_background', 'fast', 'fivethirtyeight', 'ggplot', 'grayscale', 'seaborn', 'seaborn-bright', 'seaborn-colorblind', 'seaborn-dark', 'seaborn-dark-palette', 'seaborn-darkgrid', 'seaborn-deep', 'seaborn-muted', 'seaborn-notebook', 'seaborn-paper', 'seaborn-pastel', 'seaborn-poster', 'seaborn-talk', 'seaborn-ticks', 'seaborn-white', 'seaborn-whitegrid', 'tableau-colorblind10']
1.2 打造属于自己的全局绘图样式
1.2.1 使用.mplstyle文件来设置
创建后缀名为.mplstyle的文件,添加如下列所示的内容:
axes.titlesize : 24
axes.labelsize : 20
lines.linewidth : 3
lines.markersize : 10
xtick.labelsize : 16
ytick.labelsize : 16
之后调用如下所示的代码(路径自己填自己的):
plt.style.use('file/presentation.mplstyle')
plt.plot([1,2,3,4],[2,3,4,5])
另外,样式可以混合使用:
plt.style.use(['dark_background', 'file/presentation.mplstyle'])
plt.plot([1,2,3,4],[2,3,4,5])
1.2.2 设置rcparams
import matplotlib as mpl
import matplotlib.pyplot as plt
import numpy as np

mpl.rcParams['lines.linewidth'] = 2
mpl.rcParams['lines.linestyle'] = '--'
plt.plot([1,2,3,4],[2,3,4,5])

更便捷的方式:
mpl.rc('lines', linewidth=4, linestyle='-.')
plt.plot([1,2,3,4],[2,3,4,5])
1.2.3 修改matolotlibrc文件来修改样式
1.2.2中的rc其实是matolotlibrc文件。
# 查找matplotlibrc文件的路径
mpl.matplotlib_fname()
然后根据输出的路径找到matolotlibrc文件直接修改。好家伙!
2 matplotlib的色彩设置
- 可视化编码的角度对颜色进行分析
- 色相:没有明显的顺序性、一般不用来表达数据量的高低,而是用来表达数据列的类别。
- 亮度和饱和度:在视觉上很容易区分出优先级的高低、被用作表达顺序或者表达数据量视觉通道。
👉图表配色指南🔗
👉学会这6个可视化配色基本技巧,还原数据本身的意义🔗
2.1 设置颜色的方式
2.1.1 RGB/RGBA
- RGB
(red, green, blue) - RGBA
(red, green, blue, alpha)
plt.style.use('default')

# 颜色用[0,1]之间的浮点数表示,四个分量按顺序分别为(red, green, blue, alpha),其中alpha透明度可省略
plt.plot([1,2,3],[4,5,6],color=(0.1, 0.2, 0.5))
plt.plot([4,5,6],[1,2,3],color=(0.1, 0.2, 0.5, 0.5))

2.1.2 HEX RGB/RGBA
# 用十六进制颜色码表示,同样最后两位表示透明度,可省略
plt.plot([1,2,3],[4,5,6],color='#0f0f0f')
plt.plot([4,5,6],[1,2,3],color='#0f0f0f80')

2.1.3 灰度色阶
当只有一个位于[0,1]的值时,表示灰度色阶。
plt.plot([1,2,3],[4,5,6],color='0.5')

2.1.4 八种基本颜色
matplotlib有八个基本颜色,可以用单字符串来表示,分别是’:
| b’ | ‘g’ | ‘r’ | ‘c’ | ‘m’ | ‘y’ | ‘k’ | ‘w’ |
|---|---|---|---|---|---|---|---|
| blue | green | red | cyan | magenta | yellow | black | white |
import matplotlib.pyplot as plt
import numpy as np

colors = [ 'b', 'g', 'r', 'c', 'm', 'y', 'k', 'w' ]

fig, axs = plt.subplots(2,4)

for ax,c in zip(axs.flat,colors):
    ax.plot([1,2,3],[4,5,6],color=c)

fig.tight_layout()

在参数color处可以使用以下颜色:
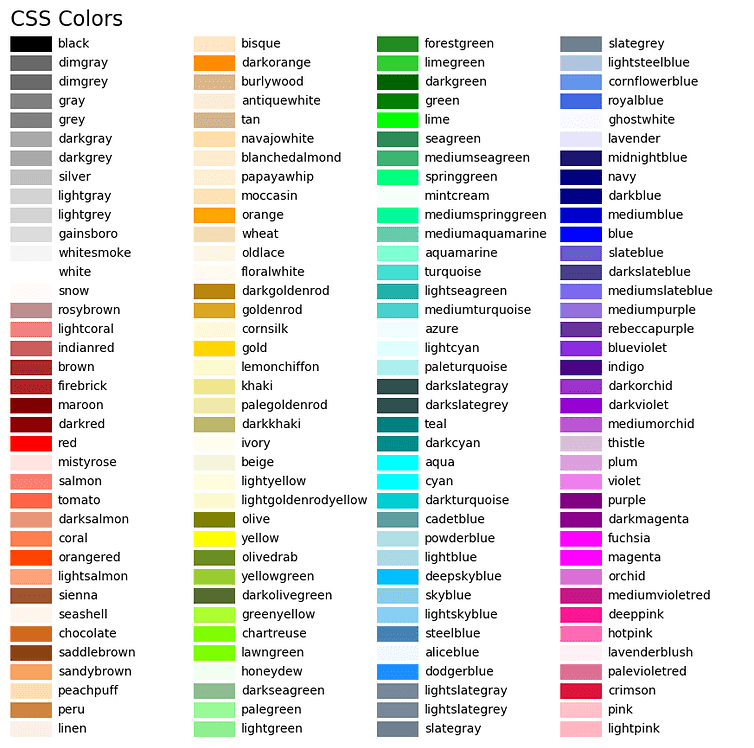
2.2 使用colormap设置一组颜色
作业
- 查阅matplotlib官网,列举出Sequential,Diverging,Cyclic,Qualitative,Miscellaneous分别有哪些内置的colormap,并以代码绘图的形式展现出来
import numpy as np
import matplotlib.pyplot as plt
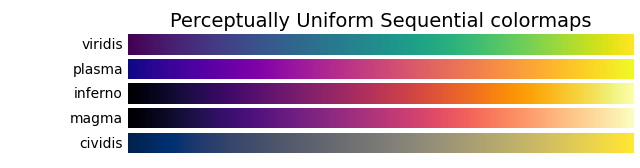
cmaps = [('Perceptually Uniform Sequential', [
'viridis', 'plasma', 'inferno', 'magma', 'cividis']),
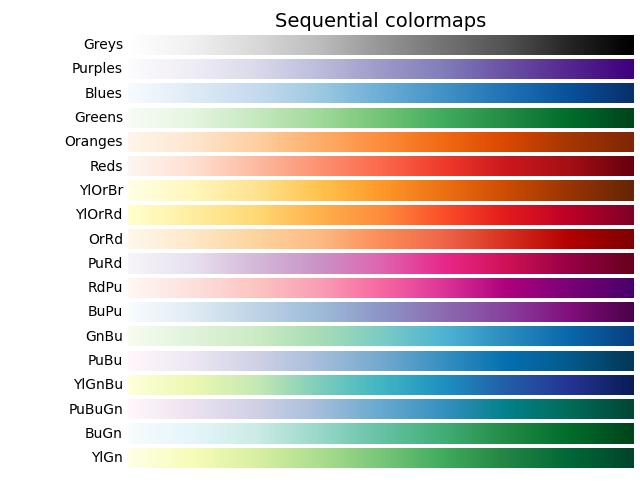
('Sequential', [
'Greys', 'Purples', 'Blues', 'Greens', 'Oranges', 'Reds',
'YlOrBr', 'YlOrRd', 'OrRd', 'PuRd', 'RdPu', 'BuPu',
'GnBu', 'PuBu', 'YlGnBu', 'PuBuGn', 'BuGn', 'YlGn']),
('Sequential (2)', [
'binary', 'gist_yarg', 'gist_gray', 'gray', 'bone', 'pink',
'spring', 'summer', 'autumn', 'winter', 'cool', 'Wistia',
'hot', 'afmhot', 'gist_heat', 'copper']),
('Diverging', [
'PiYG', 'PRGn', 'BrBG', 'PuOr', 'RdGy', 'RdBu',
'RdYlBu', 'RdYlGn', 'Spectral', 'coolwarm', 'bwr', 'seismic']),
('Cyclic', ['twilight', 'twilight_shifted', 'hsv']),
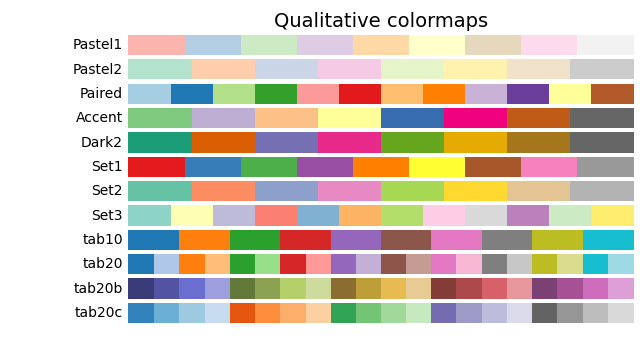
('Qualitative', [
'Pastel1', 'Pastel2', 'Paired', 'Accent',
'Dark2', 'Set1', 'Set2', 'Set3',
'tab10', 'tab20', 'tab20b', 'tab20c']),
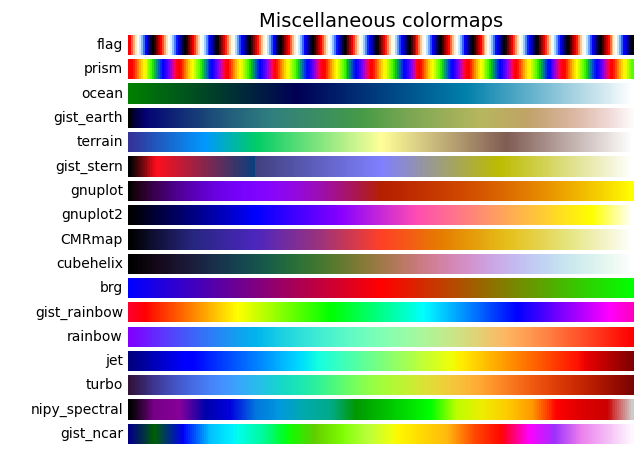
('Miscellaneous', [
'flag', 'prism', 'ocean', 'gist_earth', 'terrain', 'gist_stern',
'gnuplot', 'gnuplot2', 'CMRmap', 'cubehelix', 'brg',
'gist_rainbow', 'rainbow', 'jet', 'turbo', 'nipy_spectral',
'gist_ncar'])]
gradient = np.linspace(0, 1, 256)
gradient = np.vstack((gradient, gradient))
def plot_color_gradients(cmap_category, cmap_list):
# Create figure and adjust figure height to number of colormaps
nrows = len(cmap_list)
figh = 0.35 + 0.15 + (nrows + (nrows-1)*0.1)*0.22
fig, axs = plt.subplots(nrows=nrows, figsize=(6.4, figh))
fig.subplots_adjust(top=1-.35/figh, bottom=.15/figh, left=0.2, right=0.99)
axs[0].set_title(cmap_category + ' colormaps', fontsize=14)
for ax, name in zip(axs, cmap_list):
ax.imshow(gradient, aspect='auto', cmap=name)
ax.text(-.01, .5, name, va='center', ha='right', fontsize=10,
transform=ax.transAxes)
# Turn off *all* ticks & spines, not just the ones with colormaps.
for ax in axs:
ax.set_axis_off()
for cmap_category, cmap_list in cmaps:
plot_color_gradients(cmap_category, cmap_list)
fig.savefig('colrmap.png')
plt.show()

<img src="https://img-blog.csdnimg.cn/20201224103616817.png?x-oss-process=image/watermark,type_ZmFuZ3poZW5naGVpdGk,shadow_10,text_aHR0cHM6Ly9ibG9nLmNzZG4ubmV0L3dlaXhpbl80MzY1NTI4Mg==,size_16,color_FFFFFF,t_70)

- 学习如何自定义colormap,并将其应用到任意一个数据集中,绘制一幅图像,注意colormap的类型要和数据集的特性相匹配,并做简单解释
import matplotlib.pyplot as plt
from matplotlib.colors import ListedColormap

def plot_examples(colormaps):
    """
    Helper function to plot data with associated colormap.
    """
    np.random.seed(19680801)
    data = np.random.randn(30, 30)
    n = len(colormaps) # 在下面代码中有n=1
    fig, axs = plt.subplots(1, n, figsize=(n * 2 + 2, 3),
                            constrained_layout=True, squeeze=False)
    for ax, cmap in zip(axs.flat, colormaps):
        """
        创建不规则的矩形网格图。
            vmin,vmax: 颜色条的范围
            rasterized: 栅格化(位图),默认为None.
            cmap:注意得是ListedColormap类型的
        """
        psm = ax.pcolormesh(data, cmap=cmap, rasterized=True, vmin=-4, vmax=4)
        fig.colorbar(psm, ax=ax)
    plt.show()

"""
ListedColormap:
    matplotlib.colors.ListedColormap(colors, name='from_list', N=None).
    Colormap object generated from a list of colors.
"""
cmap = ListedColormap(["darkorange", "gold", "lawngreen", "lightseagreen"])
# print(len([cmap]))
# [out] 1
plot_examples([cmap]) #注意添加[]


 506
506


 被折叠的 条评论
为什么被折叠?
被折叠的 条评论
为什么被折叠?
 到【灌水乐园】发言


