


目标跟踪评价工具(基于OTB数据集 - tracker_benchmark_v1.0)
一、perfPlot.m代码
// perfPlot.m代码
clear
close all;
clc
addpath('./util');
% 包含序列属性注释文件的文件夹
attPath = '.\anno\att\';
% 属性名称和对应的图形名称
attName = {'illumination variation', 'out-of-plane rotation', 'scale variation', ...
'occlusion', 'deformation', 'motion blur', 'fast motion', ...
'in-plane rotation', 'out of view', 'background clutter', 'low resolution'};
attFigName = {'illumination_variations', 'out-of-plane_rotation', ...
'scale_variations', 'occlusions', 'deformation', ...
'blur', 'abrupt_motion', 'in-plane_rotation', ...
'out-of-view', 'background_clutter', 'low_resolution'};
% 定义绘图样式
plotDrawStyleAll = {struct('color', [1, 0, 0], 'lineStyle', '-'), ...
struct('color', [0, 1, 0], 'lineStyle', '-'), ...
struct('color', [0, 0, 1], 'lineStyle', '-'), ...
struct('color', [0, 0, 0], 'lineStyle', '-'), ...
struct('color', [1, 0, 1], 'lineStyle', '-'), ...
struct('color', [0, 1, 1], 'lineStyle', '-'), ...
struct('color', [0.5, 0.5, 0.5], 'lineStyle', '-'), ...
struct('color', [136, 0, 21]/255, 'lineStyle', '-'), ...
struct('color', [255, 127, 39]/255, 'lineStyle', '-'), ...
struct('color', [0, 162, 232]/255, 'lineStyle', '-'), ...
struct('color', [163, 73, 164]/255, 'lineStyle', '-')};
plotDrawStyle10 = {struct('color', [1, 0, 0], 'lineStyle', '-'), ...
struct('color', [0, 1, 0], 'lineStyle', '--'), ...
struct('color', [0, 0, 1], 'lineStyle', ':'), ...
struct('color', [0, 0, 0], 'lineStyle', '-'), ...
struct('color', [1, 0, 1], 'lineStyle', '--'), ...
struct('color', [0, 1, 1], 'lineStyle', ':'), ...
struct('color', [0.5, 0.5, 0.5], 'lineStyle', '-'), ...
struct('color', [136, 0, 21]/255, 'lineStyle', '--'), ...
struct('color', [255, 127, 39]/255, 'lineStyle', ':'), ...
struct('color', [0, 162, 232]/255, 'lineStyle', '-')};
% 获取序列和跟踪器配置
seqs = configSeqs;
trackers = configTrackers;
numSeq = length(seqs); % 序列数量
numTrk = length(trackers); % 跟踪器数量
% 初始化跟踪器名称
nameTrkAll = cell(numTrk, 1);
for idxTrk = 1:numTrk
t = trackers{idxTrk};
nameTrkAll{idxTrk} = t.namePaper;
end
% 初始化序列名称和属性
nameSeqAll = cell(numSeq, 1);
numAllSeq = zeros(numSeq, 1);
att = [];
for idxSeq = 1:numSeq
s = seqs{idxSeq};
nameSeqAll{idxSeq} = s.name;
s.len = s.endFrame - s.startFrame + 1; % 计算序列长度
numAllSeq(idxSeq) = s.len;
att(idxSeq, :) = load([attPath s.name '.txt']); % 加载属性数据
end
attNum = size(att, 2); % 属性数量
figPath = '.\figs\overall\'; % 图形保存路径
perfMatPath = '.\perfMat\overall\'; % 性能矩阵保存路径
% 如果图形路径不存在,则创建
if ~exist(figPath, 'dir')
mkdir(figPath);
end
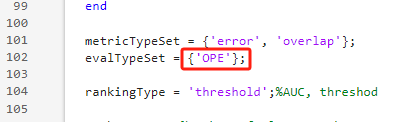
metricTypeSet = {'error', 'overlap'}; % 评估指标类型
evalTypeSet = 'OPE'; % 评估类型
rankingType = 'threshold'; % 排名类型:AUC或threshold
rankNum = 10; % 要显示的图形数量
% 根据排名数量设置绘图样式
if rankNum == 10
plotDrawStyle = plotDrawStyle10;
else
plotDrawStyle = plotDrawStyleAll;
end
% 定义阈值
thresholdSetOverlap = 0:0.05:1; % 重叠阈值
thresholdSetError = 0:50; % 误差阈值
for i = 1:length(metricTypeSet)
metricType = metricTypeSet{i}; % 当前评估指标:error或overlap
switch metricType
case 'overlap'
thresholdSet = thresholdSetOverlap; % 设置重叠阈值
rankIdx = 11; % 重叠排名索引
xLabelName = 'Overlap threshold'; % X轴标签
yLabelName = 'Success rate'; % Y轴标签
case 'error'
thresholdSet = thresholdSetError; % 设置误差阈值
rankIdx = 21; % 误差排名索引
xLabelName = 'Location error threshold'; % X轴标签
yLabelName = 'Precision'; % Y轴标签
end
if strcmp(metricType, 'error') && strcmp(rankingType, 'AUC')
continue; % 如果是误差指标且排名为AUC,则跳过
end
tNum = length(thresholdSet); % 阈值数量
evalType = evalTypeSet; % 单一评估类型
plotType = [metricType '_' evalType]; % 绘图类型
switch metricType
case 'overlap'
titleName = ['Success plots of ' evalType]; % 标题
case 'error'
titleName = ['Precision plots of ' evalType]; % 标题
end
dataName = [perfMatPath 'aveSuccessRatePlot_' num2str(numTrk) 'alg_' plotType '.mat']; % 数据文件名
% 如果性能矩阵文件不存在,则生成它
if ~exist(dataName, 'file')
genPerfMat(seqs, trackers, evalType, nameTrkAll, perfMatPath);
end
load(dataName); % 加载性能数据
numTrk = size(aveSuccessRatePlot, 1); % 跟踪器数量
if rankNum > numTrk || rankNum < 0
rankNum = numTrk; % 确保排名数量在合理范围内
end
figName = [figPath 'quality_plot_' plotType '_' rankingType]; % 图形文件名
idxSeqSet = 1:length(seqs); % 序列索引集合
% 绘制并保存整体性能图
plotDrawSave(numTrk, plotDrawStyle, aveSuccessRatePlot, idxSeqSet, ...
rankNum, rankingType, rankIdx, nameTrkAll, ...
thresholdSet, titleName, xLabelName, yLabelName, figName, metricType);
% 绘制并保存每个属性的性能图
attTrld = 0; % 属性阈值
for attIdx = 1:attNum
idxSeqSet = find(att(:, attIdx) > attTrld); % 符合条件的序列索引
if length(idxSeqSet) < 2
continue; % 如果符合条件的序列少于2,跳过
end
disp([attName{attIdx} ' ' num2str(length(idxSeqSet))]); % 显示属性信息
figName = [figPath attFigName{attIdx} '_' plotType '_' rankingType]; % 属性图形文件名
titleName = ['Plots of ' evalType ': ' attName{attIdx} ' (' num2str(length(idxSeqSet)) ')']; % 标题
switch metricType
case 'overlap'
titleName = ['Success plots of ' evalType ' - ' attName{attIdx} ' (' num2str(length(idxSeqSet)) ')'];
case 'error'
titleName = ['Precision plots of ' evalType ' - ' attName{attIdx} ' (' num2str(length(idxSeqSet)) ')'];
end
% 绘制并保存属性性能图
plotDrawSave(numTrk, plotDrawStyle, aveSuccessRatePlot, idxSeqSet, ...
rankNum, rankingType, rankIdx, nameTrkAll, ...
thresholdSet, titleName, xLabelName, yLabelName, figName, metricType);
end
end
;
二、效果

三、错误总结
错误使用 exist
存在的第一个输入必须为字符串标量或字符向量。

出错 perfPlot (第 158 行)
        if ~exist(dataName)
            ^^^^^^^^^^^^^^^;

 改为
改为


 479
479

 被折叠的 条评论
为什么被折叠?
被折叠的 条评论
为什么被折叠?
 到【灌水乐园】发言


