


前言
python学习笔记—matplotlib day9(仅供学习使用)
常用函数如下:
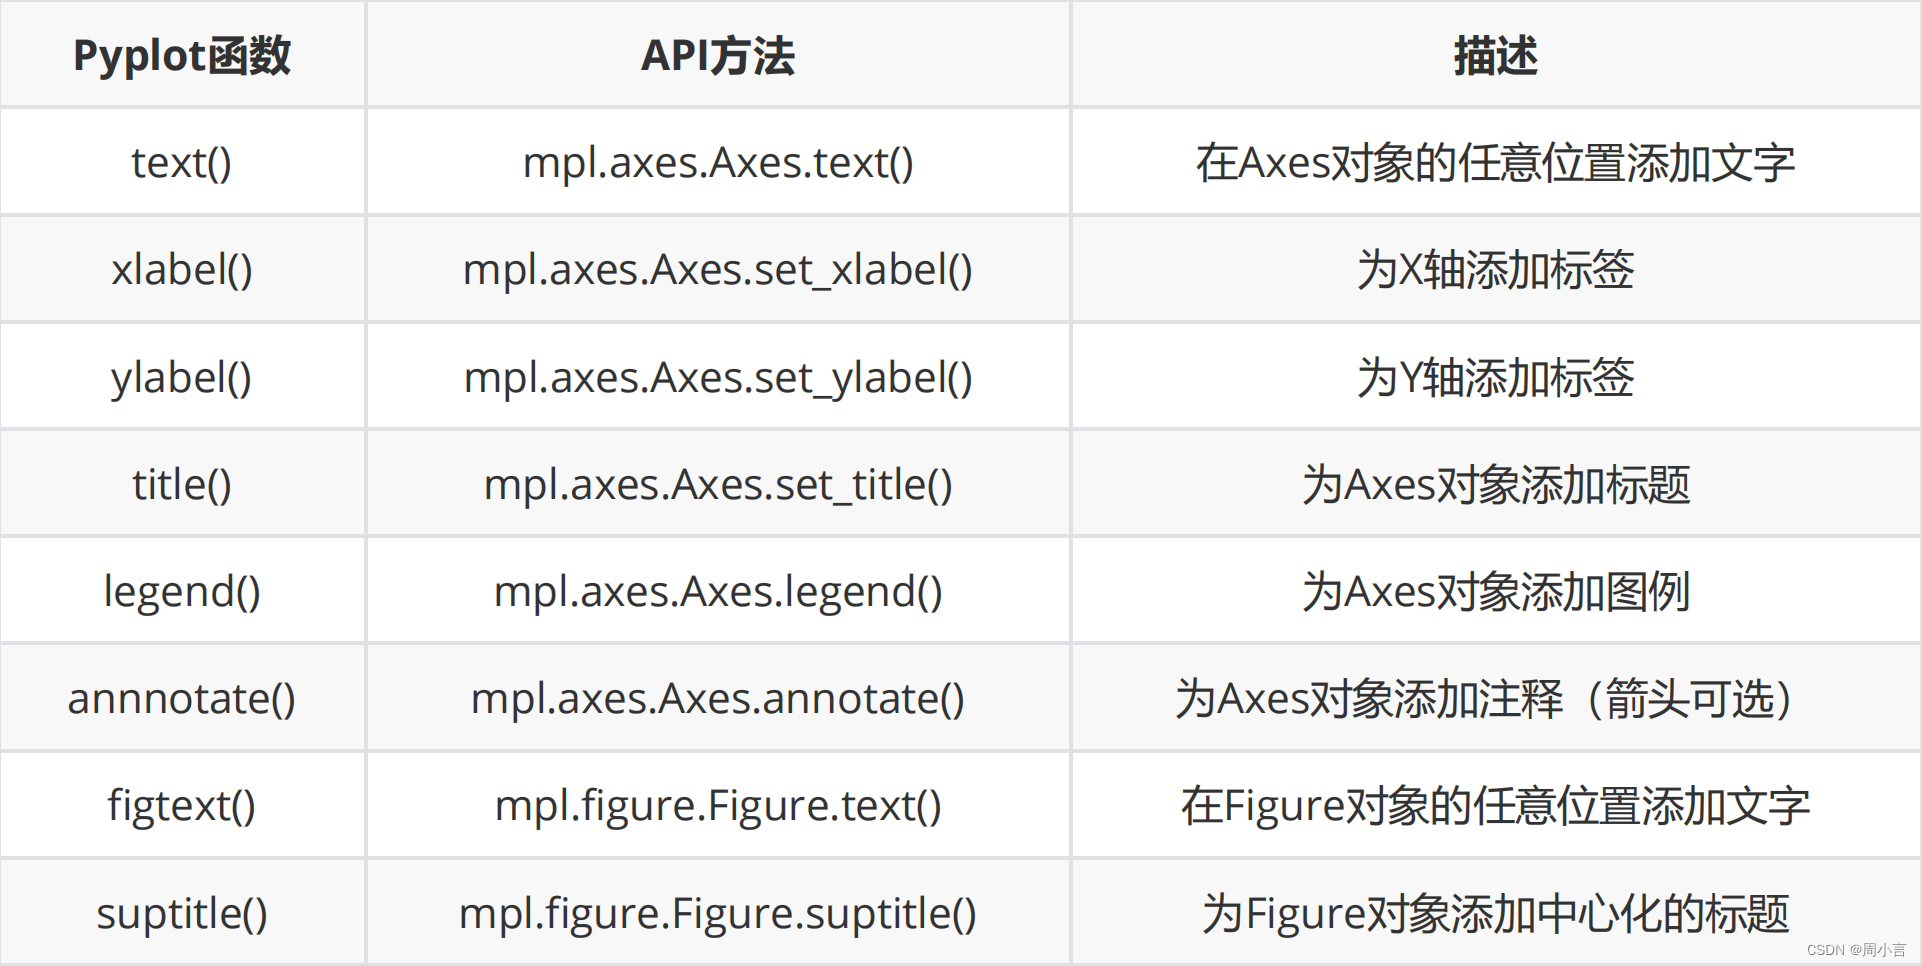
一、文本
import numpy as np
import matplotlib.pyplot as plt
# 字体属性
font = {'fontsize': 20,
'family': 'KaiTi',
'color': 'red',
'weight': 'bold'} # 字体加粗
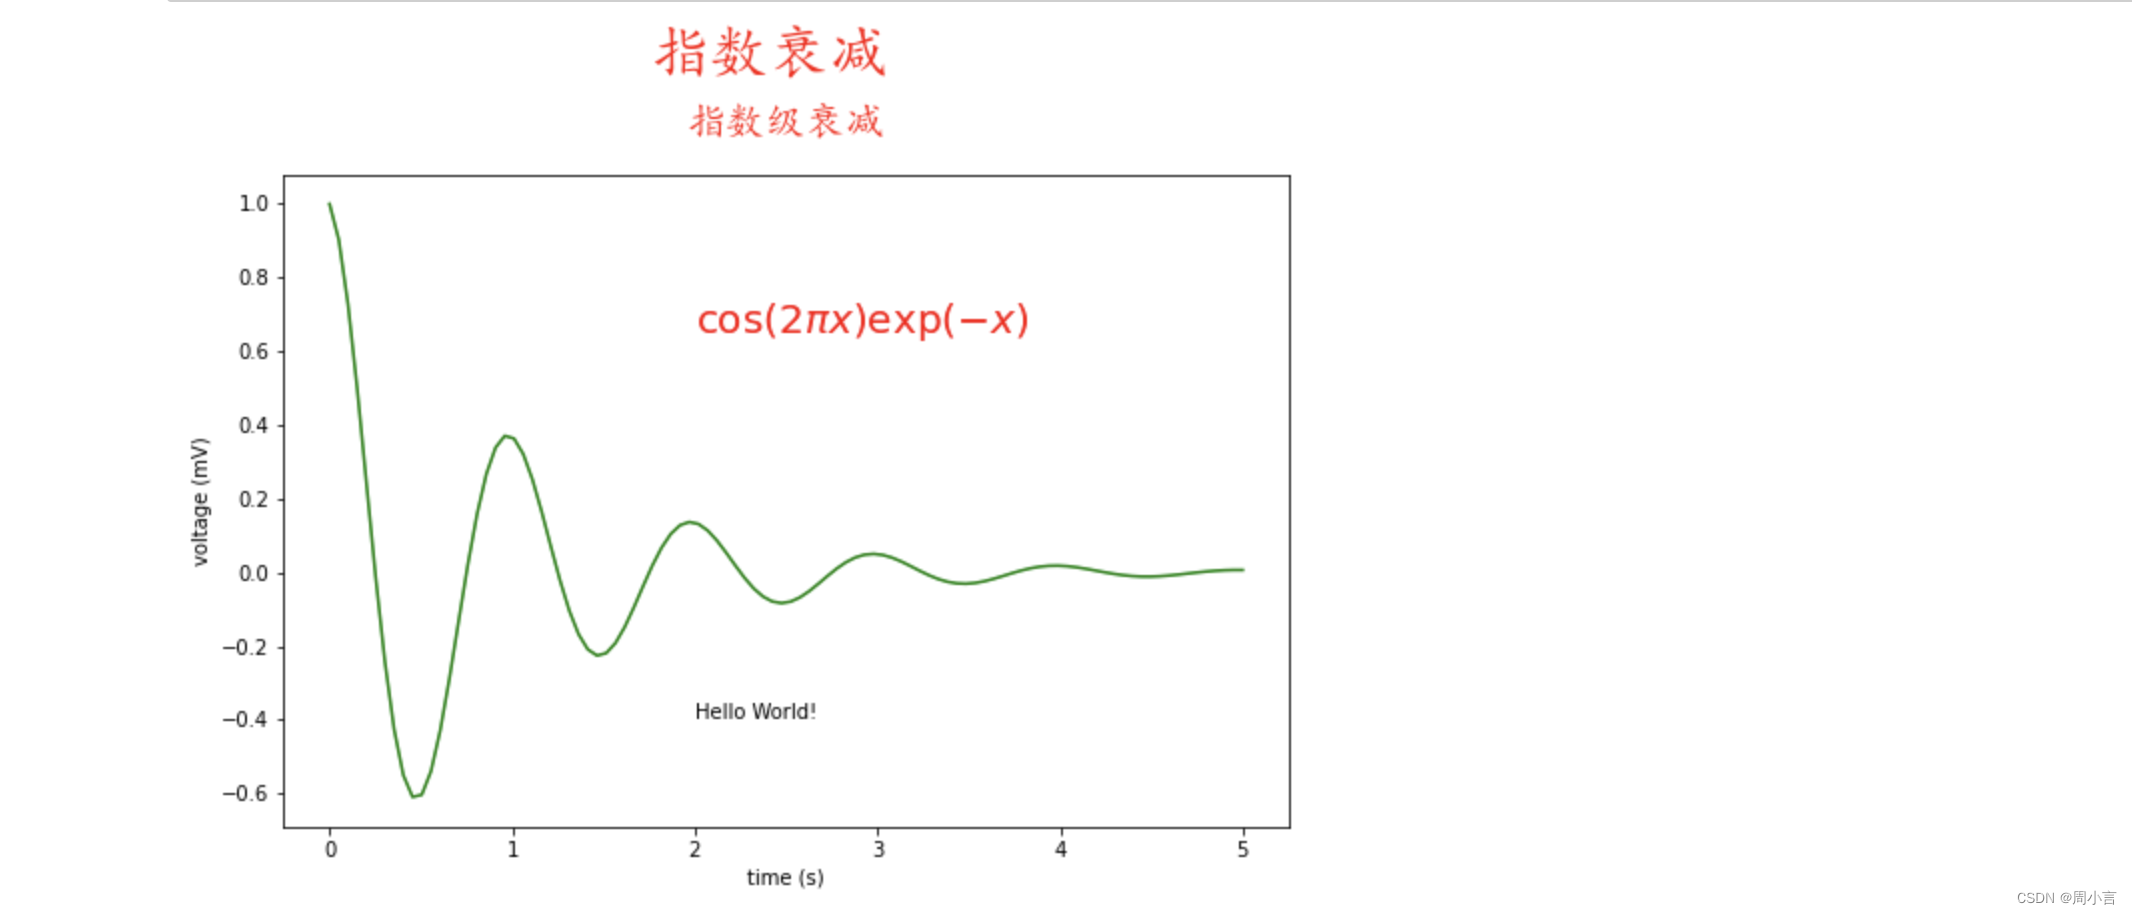
x = np.linspace(0.0, 5.0, 100)
y = np.cos(2*np.pi*x) * np.exp(-x)
plt.figure(figsize=(9,6))
plt.plot(x, y, 'green')
# 视图的标题,小标题
plt.title('指数级衰减',fontdict=font,pad = 20)#pad是标题到图片之间的距离
# figure的大标题,大标题
plt.suptitle('指数衰减',y = 1.05,fontdict = font,fontsize = 30)
plt.text(x = 2, y = 0.65, # 横纵坐标位置
s = r'$\cos(2 \pi x) \exp(-x)$',fontdict=font) # 文本内容
plt.text(x = 2,y = -0.4,s = 'Hello World!')
plt.xlabel('time (s)')
plt.ylabel('voltage (mV)')
plt.show()
二、箭头
import matplotlib.pyplot as plt
import numpy
# 随机生成数字 10行2列(x,y)
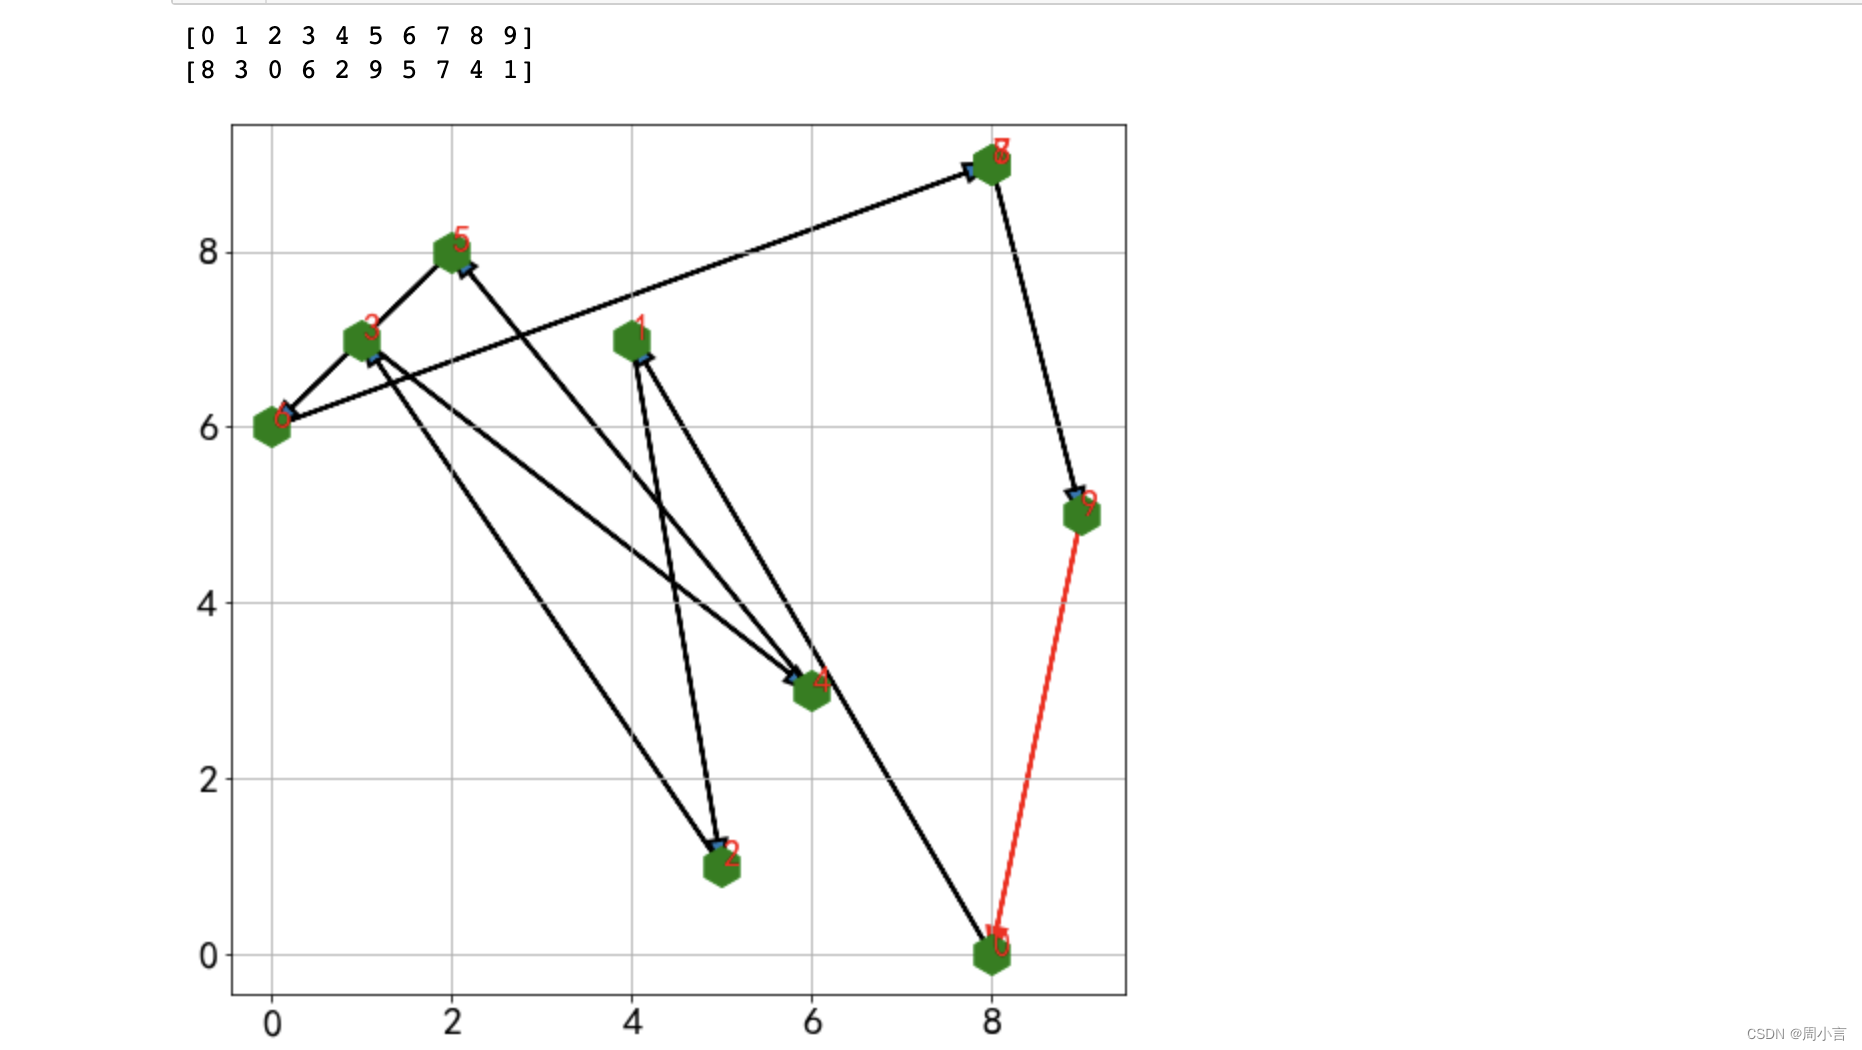
loc = np.random.randint(0,10,size = (10,2))
plt.figure(figsize=(8, 8))
# 画图,所有行,都获取,索引0---->横坐标
# 所有行,都获取,索引1---->纵坐标
plt.plot(loc[:,0], loc[:,1], 'gh', ms=20)
plt.grid(True)
# 路径
way = np.arange(10) # 0、1、2…、9索引
print(way)
np.random.shuffle(way) # 洗牌,打乱顺序
print(way)
# 10个点,连9条线
for i in range(0, 9): # for循环遍历,少一个,最后一个特殊
start = loc[way[i]] # 起点
end = loc[way[i+1]] # 终点
plt.arrow(x = start[0], y = start[1], # 箭头起点
dx = end[0]-start[0], dy = end[1]-start[1], # 坐标移动位置
head_width=0.2, lw=2,#箭头长度,箭尾线宽
length_includes_head = True) # 长度计算包含箭头箭尾
plt.text(start[0],start[1],s = i,fontsize = 18,color = 'red') # 文本
if i == len(way) - 2: # 最后一个点
plt.text(end[0],end[1],s = i + 1,fontsize = 18,color = 'red')
#以下代码画出做后的一条红线
start = loc[way[-1]] # 最后一个点
end = loc[way[0]] # 起点,对应着0点
plt.arrow(x = start[0], y = start[1], # 箭头起点
dx = end[0]-start[0], dy = end[1]-start[1], # 坐标移动位置
head_width=0.2, lw=2,#箭头长度,箭尾线宽
length_includes_head = True,color = 'red') # 长度计算包含箭头箭尾
三、注释
import numpy as np
import matplotlib.pyplot as plt
fig, ax = plt.subplots()
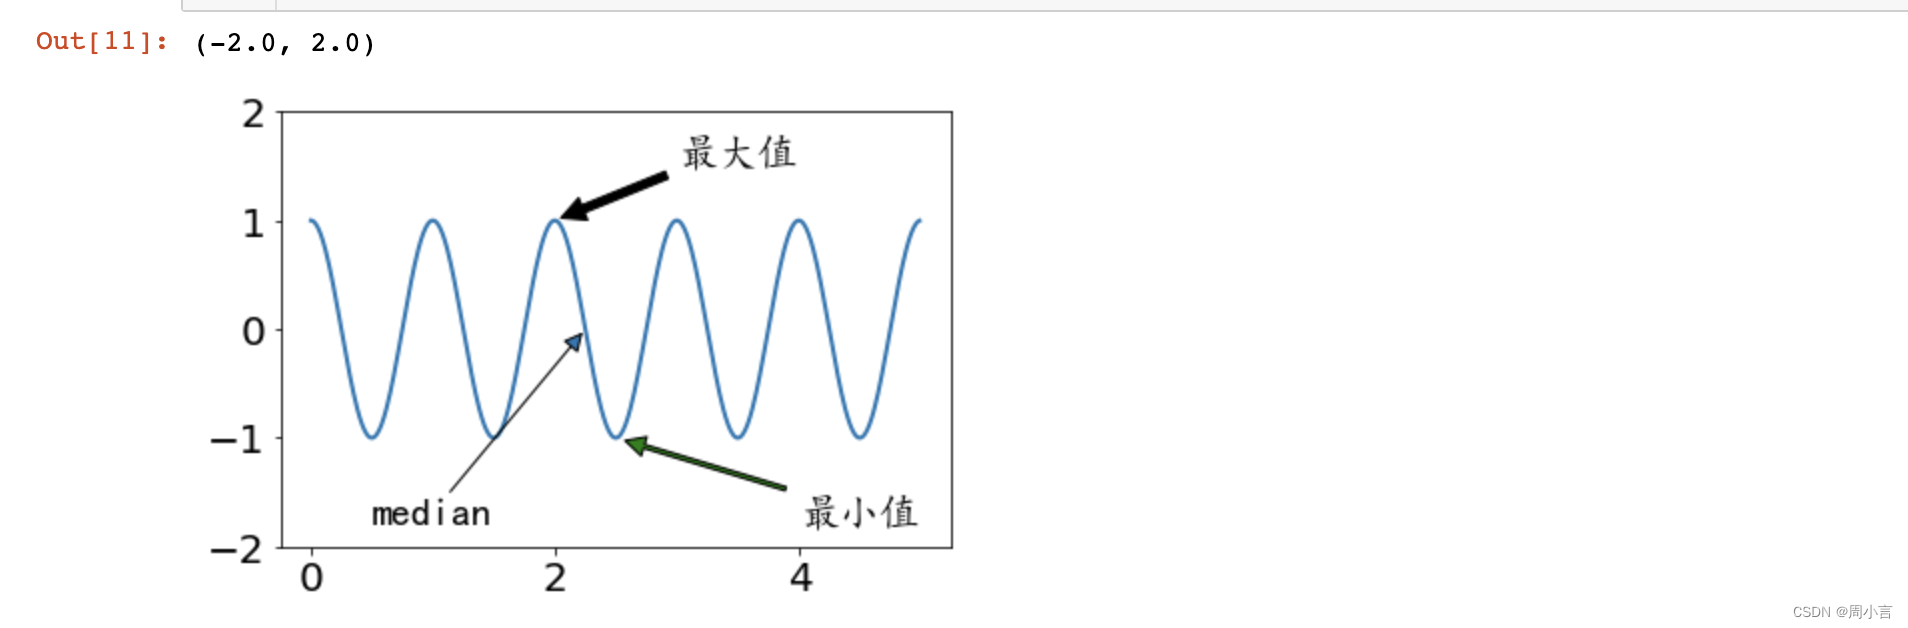
x = np.arange(0.0, 5.0, 0.01)
y = np.cos(2*np.pi*x)
line, = ax.plot(x,y,lw=2)
plt.rcParams['font.family'] = 'KaiTi'
plt.rcParams['font.size'] = 20
# 注释
ax.annotate('最大值', # 文本内容
xy=(2, 1), # 箭头指向位置
xytext=(3, 1.5), # 文本位置
arrowprops=dict(facecolor='black', shrink=0.05)) # 箭头模样
ax.annotate('最小值',
xy = (2.5,-1),
xytext = (4,-1.8),
arrowprops = dict(facecolor = 'green',
width = 2, # 箭头宽度
headwidth = 10,# 箭头头部宽度
headlength = 10, # 箭头头部长度
shrink = 0.05)) # 箭头两端收缩的百分比(占总长)
ax.annotate('median',
xy = (2.25,0),
xytext = (0.5,-1.8),
arrowprops = dict(arrowstyle = '-|>'), # 箭头样式
fontsize = 20)
ax.set_ylim(-2, 2) # y轴范围调宽,方便文本的放置
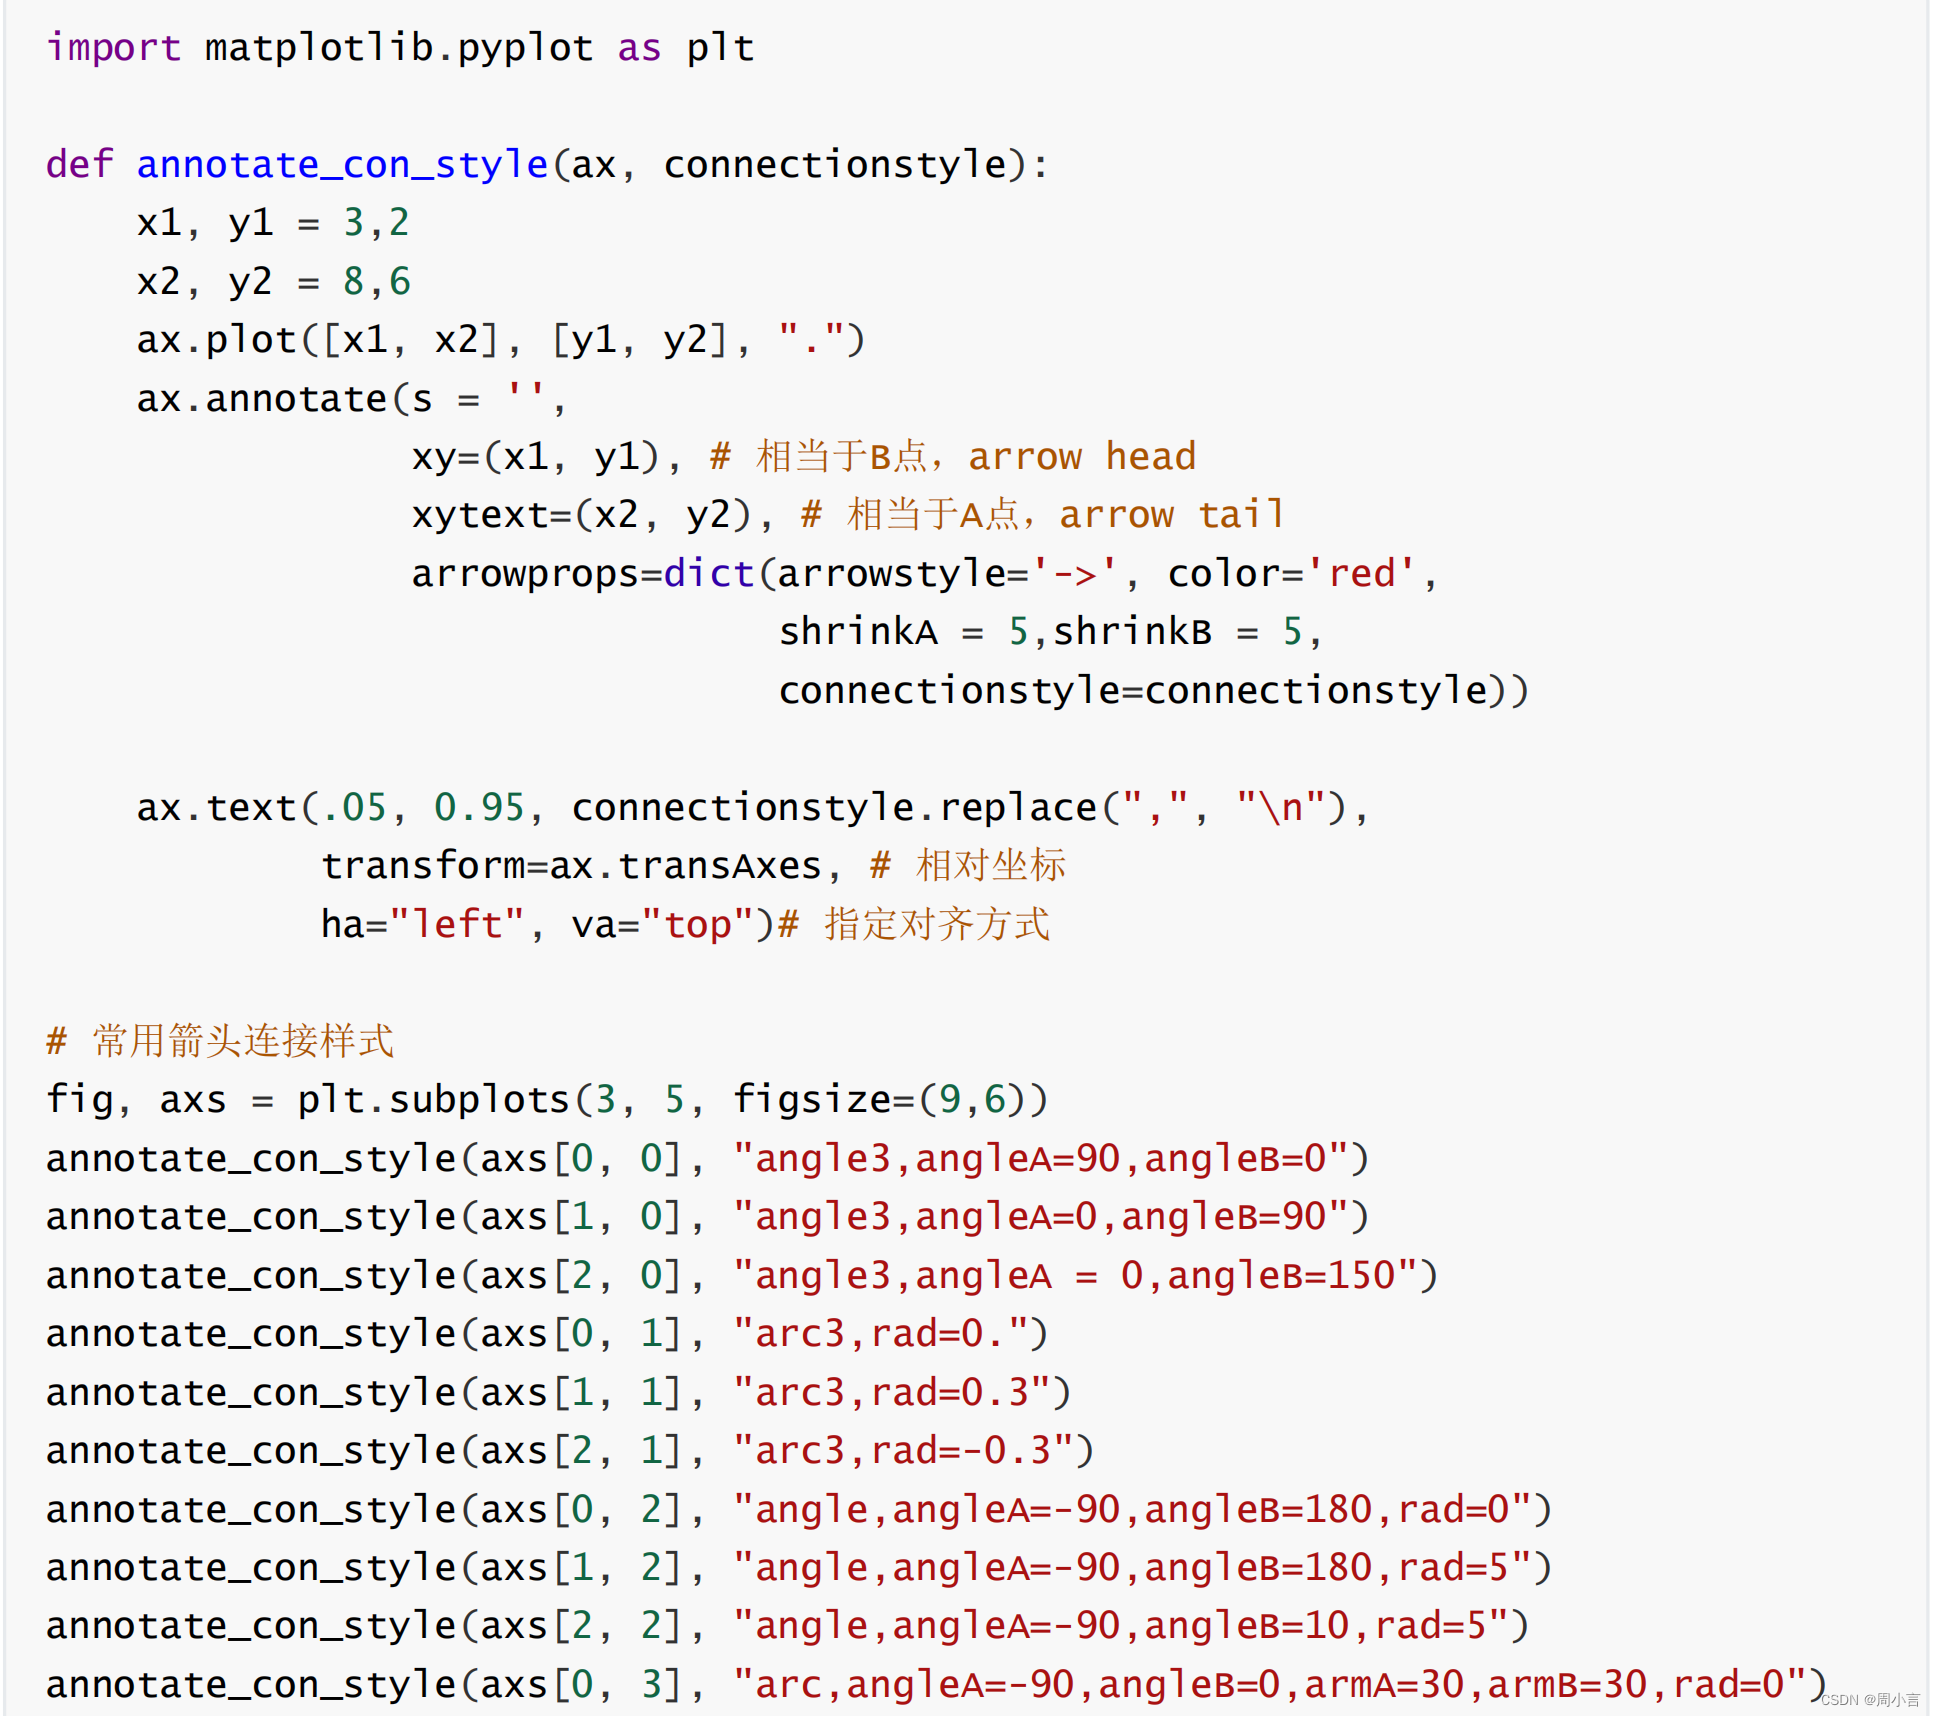
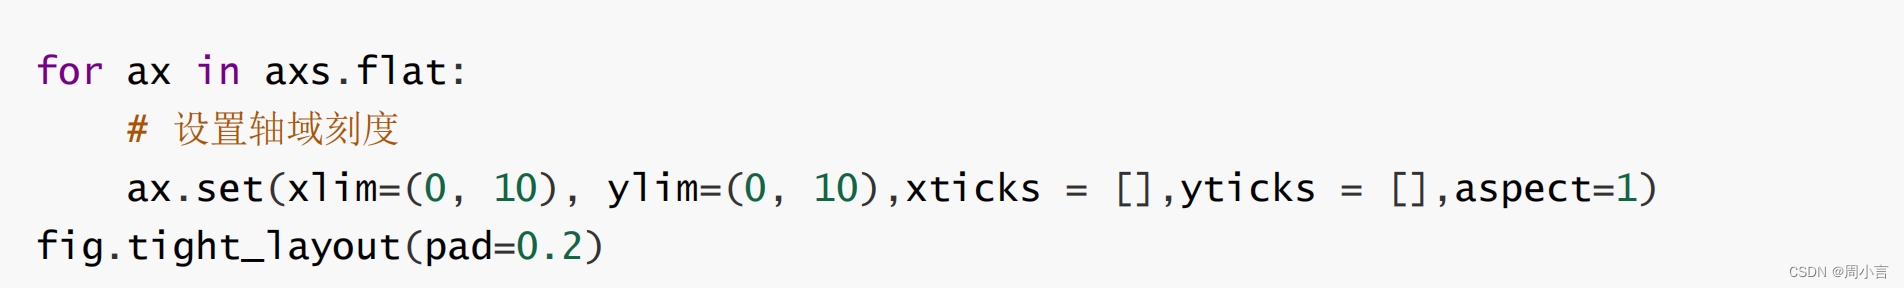
四、注释箭头连接形状
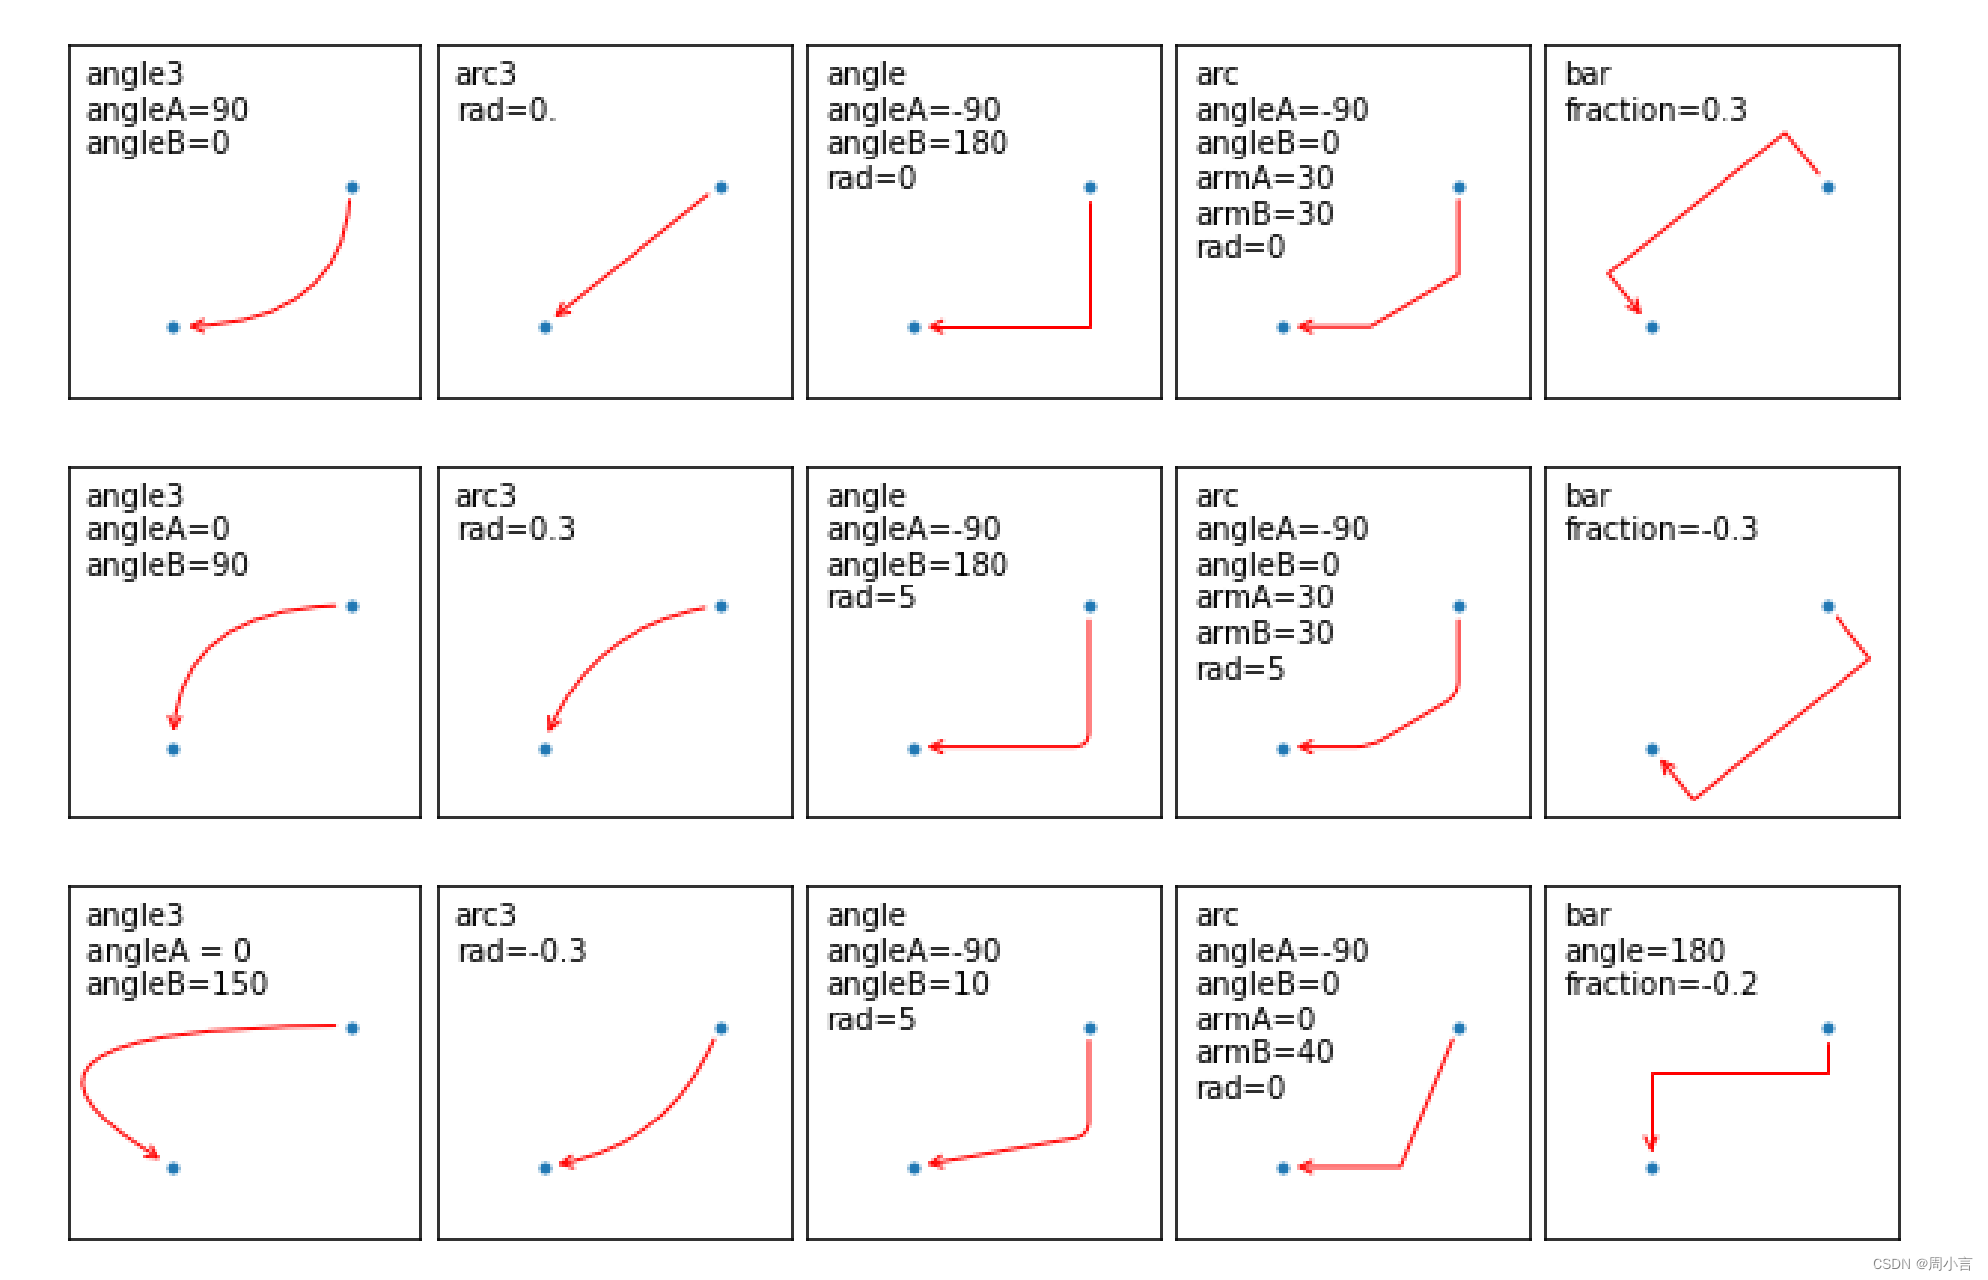
代码实现:


 390
390


 被折叠的 条评论
为什么被折叠?
被折叠的 条评论
为什么被折叠?
 到【灌水乐园】发言


