Kmeans 算法
import pandas as pd
import numpy as np
data = pd.read_csv('data.csv')
data.head()

X = data.drop(['labels'],axis=1)
y = data.loc[:,'labels']
y.head()
pd.value_counts(y)

%matplotlib inline
from matplotlib import pyplot as plt
fig1 = plt.figure()
plt.scatter(X.loc[:,'V1'],X.loc[:,'V2'])
plt.title("un-labled data")
plt.xlabel('V1')
plt.ylabel('V2')
plt.show()

fig2 = plt.figure()
label0 = plt.scatter(X.loc[:,'V1'][y==0],X.loc[:,'V2'][y==0])
label1 = plt.scatter(X.loc[:,'V1'][y==1],X.loc[:,'V2'][y==1])
label2 = plt.scatter(X.loc[:,'V1'][y==2],X.loc[:,'V2'][y==2])
plt.title("labled data")
plt.xlabel('V1')
plt.ylabel('V2')
plt.legend((label0,label1,label2),('label0','label1','label2'))
plt.show()

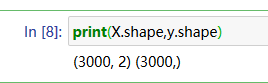
print(X.shape,y.shape)
from sklearn.cluster import KMeans
KM = KMeans(n_clusters=3,random_state=0)
KM.fit(X)
centers = KM.cluster_centers_
fig3 = plt.figure()
label0 = plt.scatter(X.loc[:,'V1'][y==0],X.loc[:,'V2'][y==0])
label1 = plt.scatter(X.loc[:,'V1'][y==1],X.loc[:,'V2'][y==1])
label2 = plt.scatter(X.loc[:,'V1'][y==2],X.loc[:,'V2'][y==2])
plt.title("labled data")
plt.xlabel('V1')
plt.ylabel('V2')
plt.legend((label0,label1,label2),('label0','label1','label2'))
plt.scatter(centers[:,0],centers[:,1])
plt.show()

y_predict_test = KM.predict([[80,60]])
print(y_predict_test)
y_predict = KM.predict(X)
print(pd.value_counts(y_predict),pd.value_counts(y))
from sklearn.metrics import accuracy_score
accuracy = accuracy_score(y,y_predict)
print(accuracy)

fig4 = plt.figure()
label0 = plt.scatter(X.loc[:,'V1'][y_predict==0],X.loc[:,'V2'][y_predict==0])
label1 = plt.scatter(X.loc[:,'V1'][y_predict==1],X.loc[:,'V2'][y_predict==1])
label2 = plt.scatter(X.loc[:,'V1'][y_predict==2],X.loc[:,'V2'][y_predict==2])
plt.title("predict data")
plt.xlabel('V1')
plt.ylabel('V2')
plt.legend((label0,label1,label2),('label0','label1','label2'))
plt.scatter(centers[:,0],centers[:,1])
fig5 = plt.figure()
label0 = plt.scatter(X.loc[:,'V1'][y==0],X.loc[:,'V2'][y==0])
label1 = plt.scatter(X.loc[:,'V1'][y==1],X.loc[:,'V2'][y==1])
label2 = plt.scatter(X.loc[:,'V1'][y==2],X.loc[:,'V2'][y==2])
plt.title("labled data")
plt.xlabel('V1')
plt.ylabel('V2')
plt.legend((label0,label1,label2),('label0','label1','label2'))
plt.scatter(centers[:,0],centers[:,1])
plt.show()

y_corrected = []
for i in y_predict:
if i==0:
y_corrected.append(2)
elif i==1:
y_corrected.append(1)
else:
y_corrected.append(0)
print(pd.value_counts(y_corrected))
print(accuracy_score(y,y_corrected))
y_corrected = np.array(y_corrected)
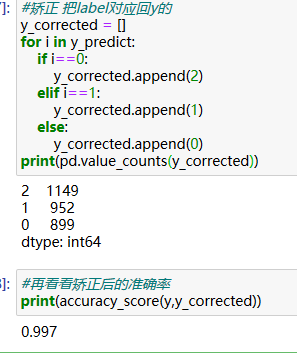
fig6 = plt.figure()
label0 = plt.scatter(X.loc[:,'V1'][y_corrected==0],X.loc[:,'V2'][y_corrected==0])
label1 = plt.scatter(X.loc[:,'V1'][y_corrected==1],X.loc[:,'V2'][y_corrected==1])
label2 = plt.scatter(X.loc[:,'V1'][y_corrected==2],X.loc[:,'V2'][y_corrected==2])
plt.title("corected data")
plt.xlabel('V1')
plt.ylabel('V2')
plt.legend((label0,label1,label2),('label0','label1','label2'))
plt.scatter(centers[:,0],centers[:,1])
fig7 = plt.figure()
label0 = plt.scatter(X.loc[:,'V1'][y==0],X.loc[:,'V2'][y==0])
label1 = plt.scatter(X.loc[:,'V1'][y==1],X.loc[:,'V2'][y==1])
label2 = plt.scatter(X.loc[:,'V1'][y==2],X.loc[:,'V2'][y==2])
plt.title("labled data")
plt.xlabel('V1')
plt.ylabel('V2')
plt.legend((label0,label1,label2),('label0','label1','label2'))
plt.scatter(centers[:,0],centers[:,1])
plt.show()

KNN 模型
from sklearn.neighbors import KNeighborsClassifier
KNN = KNeighborsClassifier(n_neighbors=3)
KNN.fit(X,y)
y_predict_knn_test = KNN.predict([[80,60]])
print(y_predict_knn_test)
y_predict_knn = KNN.predict(X)
print('knn accuracy',accuracy_score(y,y_predict_knn))
print(pd.value_counts(y),pd.value_counts(y_predict_knn))

fig8 = plt.figure()
label0 = plt.scatter(X.loc[:,'V1'][y_predict_knn==0],X.loc[:,'V2'][y_predict_knn==0])
label1 = plt.scatter(X.loc[:,'V1'][y_predict_knn==1],X.loc[:,'V2'][y_predict_knn==1])
label2 = plt.scatter(X.loc[:,'V1'][y_predict_knn==2],X.loc[:,'V2'][y_predict_knn==2])
plt.title("KNN data")
plt.xlabel('V1')
plt.ylabel('V2')
plt.legend((label0,label1,label2),('label0','label1','label2'))
plt.scatter(centers[:,0],centers[:,1])
fig9 = plt.figure()
label0 = plt.scatter(X.loc[:,'V1'][y==0],X.loc[:,'V2'][y==0])
label1 = plt.scatter(X.loc[:,'V1'][y==1],X.loc[:,'V2'][y==1])
label2 = plt.scatter(X.loc[:,'V1'][y==2],X.loc[:,'V2'][y==2])
plt.title("labled data")
plt.xlabel('V1')
plt.ylabel('V2')
plt.legend((label0,label1,label2),('label0','label1','label2'))
plt.scatter(centers[:,0],centers[:,1])
plt.show()

Meanshift算法
from sklearn.cluster import MeanShift,estimate_bandwidth
bw = estimate_bandwidth(X,n_samples=500)
print(bw)
ms = MeanShift(bandwidth=bw)
ms.fit(X)
y_predict_ms = ms.predict(X)
print(pd.value_counts(y_predict_ms),
pd.value_counts(y)
)

y_corrected_ms = []
for i in y_predict_ms:
if i==0:
y_corrected_ms.append(2)
elif i==1:
y_corrected_ms.append(1)
else:
y_corrected_ms.append(0)
print(pd.value_counts(y_corrected_ms),
pd.value_counts(y))
print(accuracy_score(y,y_corrected_ms))

y_corrected_ms = np.array(y_corrected_ms)
fig10 = plt.figure()
label0 = plt.scatter(X.loc[:,'V1'][y_corrected_ms==0],X.loc[:,'V2'][y_corrected_ms==0])
label1 = plt.scatter(X.loc[:,'V1'][y_corrected_ms==1],X.loc[:,'V2'][y_corrected_ms==1])
label2 = plt.scatter(X.loc[:,'V1'][y_corrected_ms==2],X.loc[:,'V2'][y_corrected_ms==2])
plt.title("ms data")
plt.xlabel('V1')
plt.ylabel('V2')
plt.legend((label0,label1,label2),('label0','label1','label2'))
plt.scatter(centers[:,0],centers[:,1])
fig11 = plt.figure()
label0 = plt.scatter(X.loc[:,'V1'][y==0],X.loc[:,'V2'][y==0])
label1 = plt.scatter(X.loc[:,'V1'][y==1],X.loc[:,'V2'][y==1])
label2 = plt.scatter(X.loc[:,'V1'][y==2],X.loc[:,'V2'][y==2])
plt.title("labled data")
plt.xlabel('V1')
plt.ylabel('V2')
plt.legend((label0,label1,label2),('label0','label1','label2'))
plt.scatter(centers[:,0],centers[:,1])
plt.show()


 966
966


 被折叠的 条评论
为什么被折叠?
被折叠的 条评论
为什么被折叠?
 到【灌水乐园】发言


