


echarts 折线图
官网:Documentation - Apache ECharts
********************
配置属性
option = {
  xAxis: {
    type: 'category',
    data: ['A', 'B', 'C']
  },
  yAxis: {
    type: 'value'
  },
  series: [
    {
      data: [120, 200, 150],
      type: 'line'              //type:line表示折线图
    }
  ]
};
基本属性
id:组件id,默认不指定
name:系列名称

type:series图表类型,常用值:bar(柱形图)、line(折线图)、pie(饼图)、scatter(散点图)
stack:数据堆叠,stack相同时会在同一个水平或者垂直位上
step:是否是阶梯折线图,默认false,可选值:true、start、middle、end

colorBy: series(同一系列颜色相同)、data(同一维度颜色相同)
legendHoverLink:鼠标滑过时legend(图标)是否高亮,默认true
coordinateSystem:series使用的坐标系,可选值(cartesian2d,直角坐标系,默认)、polar(极坐标系)

xAxisIndex:x轴的index,单个图表实例中有多个x轴时使用
yAxisIndex:y轴的index,单个图表实例中有多个y轴时使用
polarIndex:极坐标轴index,单个图表实例中有多个polar时使用

symbol:标记的图形,可选值:circle、emptyCircle、rect、roundRect、image://url、path://等
symbilSize:标记大小
symbolRotate:标记的旋转角度
symbolKeepAspect:symbol为path://时,是否在缩放时保持长宽比,默认false
symbolOffset:标记偏移量,如:[0,0]
showAllSymbol:轴为category时有效,可选值:auto(默认)、true(显示所有图形)、false(随主轴标签间隔隐藏策略)

cursor:鼠标悬浮时在图形元素上时鼠标的样式是什么,如:pointer
connectNulls:是否连接空数据,默认false
clip:是否裁剪超出坐标系的图形,默认true
动画属性
animation:是否开启动画,默认true
animationThreshold:动画阈值,动画数量大于该值会关闭动画,默认2000
animationDuration:动画持续时间,默认1000ms
animationEasing:动画缓动效果,如:cubicOut
animationDelay:动画初始延时时间
animationDurationUpdate:动画更新时长
animationEasingUpdate:动画更新缓动时长
animationDelayUpdate:动画延时更新时长

# universalTransition:全局过渡动画配置
universalTransition.enabled:是否开启全局延时动画
universalTransition.seriesKey:如何关联需要动画的系列,默认取系列的id

universalTransition.divideShape:对多或者多对一的动画中,当前系列的图形如何分裂成多个图形,可选值:
split:通过一定的算法将分割图形成为多个(柱状图默认)
clone:从当前图形克隆得到多个(散点图默认)

universalTransition.delay:一对多或者多对一的动画中每个图形的动画延时
标签属性:label
label.show:是否显示标签,默认false
label.position:文本标签位置,如:top、left、right、bottom、[10,10]、[10%,10%]等label.distance:距离图形元素的距离
label.rotate:标签旋转,从-90度到90度,正值是逆时针
label.offset:是否对文字进行偏移,默认不偏移,如:[30, 40]表示文字在横向上偏移30,纵向上偏移40

label.formatter:标签内容格式器,支持字符串模板和回调函数两种形式
模板字符串:formatter: '{b}: {@score}'
{a}:系列名
{b}:数据名
{c}:数据值
{@×××}:维度名对应的数据,如{@product}:表示维度名为product的值
{@[n]}:维度n对应的数据,如{@[2]}:表示维度2对应的数据,维度从0开始计数
回调函数:(params: Object|Array) => string

label.color:标签颜色,如:"#fff"
label.fontStyle:字体风格,可选值:normal、italic、oblique
label.fontWeight:字体粗细,可选值:normal、bold、bolder、lighter、100|200|300|400...
label.fontFamily:字体设置,可选值:sans-serif、serif、monospace、Arial、Courier New、Microsoft YaHei等
label.fontSize:字体大小,如:12

label.align:水平对齐方式,可选值:left、center、right
label.verticalAlign:垂直对齐方式,可选值:top、middle、bottom

label.width:文本宽度
label.height:文本高度
label.lineHight:行高

label.backgroundColor:标签背景色,如:'#123234', 'red', 'rgba(0,23,11,0.3)'
label.borderColor:边框颜色
label.borderWidth:边框宽度
label.borderType:边框类型,可选值:solid、dashed、dotted、5、[5, 10]
label.borderDashOffset:虚线偏移量
label.borderRadius:文字块的圆角,默认为0
label.padding:文字块的内边距,如:[3, 4, 5, 6](上、右、下、左)、[3,4]([3,4,3,4])、3([3,3,3,3])

label.shadowColor:阴影颜色
label.shadowBlur:阴影长度
label.shadowOffsetX:阴影水平偏移
label.shadowOffsetY:阴影垂直偏移

label.textBorderColor:文本边框颜色
label.textBorderWidth:文本边框宽度
label.textBorderType:文本边框类型,可选值:solid、dashed、dotted、5、[5,10]等
label.textBorderDashOffset:文字虚线偏移量

label.textShadowColor:文字阴影颜色
label.textShadowBlur:文字阴影大小
label.textShadowOffsetX:阴影水平偏移
label.textShadowOffsetY:阴影垂直偏移

label.overflow:文本超出长度后,是否截断或者换行
none:不截断或者换行,默认
truncate:截断
break:单词间换行
breanAll:除单词间换行,单词内也换行

label.ellipsis:文本超出长度,截断(truncate)后显示的文本,如:...

label.lineOverflow:文本超过高度是否截断,配置label.height生效
none:不截断
truncate:截断

label.rich:自定义富文本样式
折线端点标签:endLine
endLabel.show:是否显示标签,默认false
endLabel.distance:距离图形元素的距离
endLabel.rotate:标签旋转,从-90度到90度,正值是逆时针
endLabel.offset:是否对文字进行偏移,默认不偏移,如:[30, 40]表示文字在横向上偏移30,纵向上偏移40

endLabel.formatter:标签内容格式器,支持字符串模板和回调函数两种形式
模板字符串:formatter: '{b}: {@score}'
{a}:系列名
{b}:数据名
{c}:数据值
{@×××}:维度名对应的数据,如{@product}:表示维度名为product的值
{@[n]}:维度n对应的数据,如{@[2]}:表示维度2对应的数据,维度从0开始计数
回调函数:(params: Object|Array) => string

endLabel.color:标签颜色,如:"#fff"
endLabel.fontStyle:字体风格,可选值:normal、italic、oblique
endLabel.fontWeight:字体粗细,可选值:normal、bold、bolder、lighter、100|200|300|400...
endLabel.fontFamily:字体设置,可选值:sans-serif、serif、monospace、Arial、Courier New、Microsoft YaHei等
endLabel.fontSize:字体大小,如:12

endLabel.align:水平对齐方式,可选值:left、center、right
endLabel.verticalAlign:垂直对齐方式,可选值:top、middle、bottom

endLabel.width:文本宽度
endLabel.height:文本高度
endLabel.lineHight:行高

endLabel.backgroundColor:标签背景色,如:'#123234', 'red', 'rgba(0,23,11,0.3)'
endLabel.borderColor:边框颜色
endLabel.borderWidth:边框宽度
endLabel.borderType:边框类型,可选值:solid、dashed、dotted、5、[5, 10]
endLabel.borderDashOffset:虚线偏移量
endLabel.borderRadius:文字块的圆角,默认为0
endLabel.padding:文字块的内边距,如:[3, 4, 5, 6](上、右、下、左)、[3,4]([3,4,3,4])、3([3,3,3,3])

endLabel.shadowColor:阴影颜色
endLabel.shadowBlur:阴影长度
endLabel.shadowOffsetX:阴影水平偏移
endLabel.shadowOffsetY:阴影垂直偏移

endLabel.textBorderColor:文本边框颜色
endLabel.textBorderWidth:文本边框宽度
endLabel.textBorderType:文本边框类型,可选值:solid、dashed、dotted、5、[5,10]等
endLabel.textBorderDashOffset:文字虚线偏移量

endLabel.textShadowColor:文字阴影颜色
endLabel.textShadowBlur:文字阴影大小
endLabel.textShadowOffsetX:阴影水平偏移
endLabel.textShadowOffsetY:阴影垂直偏移

endLabel.overflow:文本超出长度后,是否截断或者换行
none:不截断或者换行,默认
truncate:截断
break:单词间换行
breanAll:除单词间换行,单词内也换行

endLabel.ellipsis:文本超出长度,截断(truncate)后显示的文本,如:...

endLabel.lineOverflow:文本超过高度是否截断,配置label.height生效
none:不截断
truncate:截断

endLabel.rich:自定义富文本样式
endLabel.valueAnimation:是否开启标签数字动画
标签视觉引导线:labelLine
labelLine.show:是否显示视觉引导线
labelLine.showAbove:是否显示在图形上方

labelLine.length2:视觉引导项第二段的长度
labelLine.smooth:是否平滑视觉引导线,默认false
labelLine.minTurnAngle:视觉引导线的最小转角,0-180度

labelLine.lineStyle.color:颜色,如:rgb(255,255,255),rgba(255,255,255,1),#fff
labelLine.lineStyle.width:宽度
labelLine.lineStyle.type:线型,如:solid、dashed、dotted、[5,10]等
labelLine.lineStyle.dashOffset:虚线偏移量
labelLine.lineStyle.cap:线段末端绘制方式,可选值:butt(方形,默认)、round、square(矩形)
labelLine.lineStyle.join:连接属性,可选值:bevel(三角形,默认)、round、miter(菱形)
labelLine.lineStyle.miterLimit:菱形斜接面比例,默认为10,负数、0、Infinity、NaN均会被忽略
labelLine.lineStyle.shadowBlur:阴影模糊大小
labelLine.lineStyle.shadowColor:阴影颜色
labelLine.lineStyle.shadowOffsetX:阴影水平偏移
labelLine.lineStyle.shadowOffsetY:阴影垂直偏移
labelLine.lineStyle.opacity:透明度,默认为1,数值为从0到1的数字(0不显示)
标签布局样式:labelLayout
labelLayout.hideOverlap:是否隐藏重叠的标签
labelLayout.moveOverlap:在标签重叠的时候是否挪动标签位置以防止重叠
labelLayout.x:标签的水平位置,如:2(像素值)、20%
labelLayout.y:标签的垂直位置,如:2(像素值)、20%
labelLayout.dx:标签在 x 方向上的像素偏移,可以和x一起使用
labelLayout.dy:标签在 y 方向上的像素偏移,可以和y一起使用

labelLayout.rotate:标签旋转角度
labelLayout.width:标签宽度
labelLayout.height:标签高度
labelLayout.align:标签水平对其方式,可选值:left、center、right
labelLayout.verticalAlign:标签垂直对齐方式,可选值:top、middle、bottom
labelLayout.fontSize:标签字体大小
labelLayout.draggable:标签是否可以拖拽
labelLayout.labelLinePoints:标签引导线三个点的位置,格式为:[[x, y], [x, y], [x, y]]
折线拐点样式:itemStyle
itemStyle.color:拐点颜色,默认为series.color,可设置:rgb(255,255,255),rgba(255,255,255,1),#fff
itemStyle.borderColor:拐点边框颜色
itemStyle.borderWidth:拐点边框宽度,默认无宽度
itemStyle.borderType:拐点边框线型,可选值:solid(默认)、dashed、dotted
itemStyle.borderDashOffset:虚线偏移量
itemStyle.borderCap:线段末端的绘制方式,可选值:butt(方形,默认)、round、square(矩形)
itemStyle.borderJoin:末端连接方式,可选值:bevel(三角形连接)、round、miter(菱形)
itemStyle.borderMiterLimit:斜截面限制比列,borderJoin为miter时有效

itemStyle.shadowBlur:阴影模糊大小
itemStyle.shadowColor:阴影颜色
itemStyle.shadowOffsetX:阴影水平偏移
itemStyle.shadowOffsetY:阴影垂直偏移
itemStyle.opacity:柱条透明度,默认为1,0表示不显示

itemStyle.decal:图形贴花图案,在aria.enabled、aria.decal.show都是true时生效
                 如果为none表示不使用贴花图案
itemStyle.decal.symbol:贴花图案,如:rect、circle、image://url、path://等
itemStyle.decal.symbolSize:图案占比大小,从0到1
itemStyle.decal.symbolKeepAspect:是否保持图案长宽比,默认为true
itemStyle.decal.color:贴花图案颜色
itemStyle.decal.backgroundColor:贴花图案背景色
itemStyle.decal.dashArrayX:贴花图案横向模式
itemStyle.decal.dashArrayY:贴花图案纵向模式
itemStyle.decal.rotation:图案旋转角度(弧度值),从-Math.PI到Math.PI
itemStyle.decal.maxTileWidth:生成的图案在未重复之前的宽度上限,通常不需要设置
itemStyle.decal.maxTileHeight:生成的图案在未重复之前的高度上限,通常不需要设置
线条样式:LineStyle
lineStyle.color:线条颜色
lineStyle.width:线条宽度
lineStyle.type:线性,可选值:solid、dashed、dotted、[5,10]等
lineStyle.dashOffset:虚线偏移量
lineStyle.cap:线段末端绘制方式,可选值:butt(方形)、round、square(矩形)
lineStyle.join:线段末端连接方式,可选值:bevel(三角形连接)、round、miter(菱形)
lineStyle.miterLimit:菱形斜截面限制比列,join配置为miter时有效

lineStyle.shadowBlur:阴影大小
lineStyle.shadowColor:阴影颜色
lineStyle.shadowOffsetX:阴影水平偏移量
lineStyle.shadowOffsetY:阴影垂直偏移量
lineStyle.opacity:阴影透明度,默认为1,从0到1,0表示不显示
areaStyle:区域填充样式
areaStyle.color:区域填充颜色

areaStyle.origin:区域起始位置,可选值
auto:填充坐标轴轴线到数据间的区域,默认
start:填充坐标轴底部到数据间的区域
end:填充坐标轴顶部到数据间的区域

areaStyle.shadowBlur:阴影模糊大小
areaStyle.shadowColor:阴影颜色
areaStyle.shadowOffsetX:阴影水平方向偏移
areaStyle.shadowOffsetY:阴影垂直方向偏移
areaStyle.opacity:图形透明度,默认为1,从0到1,0表示不显示
高亮设置:emphasis
emphasis.scale:是否开启hover在拐点标志上的放大效果,默认true

emphasis.focus:高亮图形时,是否淡出其它数据的图形已达到聚焦的效果,可选值:
none:不淡出其他图形,默认
self:只聚焦(不淡出)当前高亮的数据的图形
series:聚焦当前高亮的数据所在的系列的所有图形

emphasis.blurScope:配置淡出范围,可选值:
coordinateSystem:淡出范围为坐标系,默认
series:淡出范围为系列
global:淡出范围为全局

emphasis.label:文本标签高亮配置,属性同label
emphasis.endLabel:折线端点高亮配置,属性同endLine
emphasis.labelLine:标签视觉引导线高亮配置,属性同labelLine
emphasis.itemStyle:图形高亮配置,属性同itemStyle
emphasis.lineStyle:线条高亮配置,属性同lineStyle
emphasis.areaStyle:填充高亮配置,属性同areaStyle
淡出样式:blur,开启emphasis.focus后有效
blur.label:标签淡出配置,属性同label
blur.endLabel:折线端点淡出配置,属性同endLine
blur.labelLine:标签视觉引导线淡出配置,属性同labelLine
blur.itemStyle:图形淡出配置,属性同itemStyle
blur.lineStyle:线条淡出配置,属性同lineStyle
blur.areaStyle:填充淡出配置,属性同areaStyle
选中状态:select,开启selectMode后有效
selectMode:是否支持多选,可选值:true、false(默认)、single、multiple

select.label:标签选中配置,属性同label
select.endLabel:折线端点选中配置,属性同endLine
select.labelLine:标签视觉引导线选中配置,属性同labelLine
select.itemStyle:图形选中配置,属性同itemStyle
select.lineStyle:线条选中配置,属性同lineStyle
select.areaStyle:填充选中配置,属性同areaStyle
系列提示框:tooltip,仅在tooltip.trigger为item时有效
tooltip.position:提示框位置,如:[10, 10](左侧10px、上侧10px)、[10%,10%]
tooltip.formatter:提示框内容格式化器
tooltip.backgroundColor:提示框背景色
tooltip.borderColor:提示框边框颜色
tooltip.borderWidth:提示框边框宽度

tooltip.padding:提示框内边距
padding: 5        // 设置内边距为 5
padding: [5, 10]  // 设置上下的内边距为 5,左右的内边距为 10
padding: [        // 分别设置四个方向的内边距
    5,  // 上
    10, // 右
    5,  // 下
    10, // 左
]

tooltip.textStyle:提示框文本样式
tooltip.textStyle.color:文字颜色
tooltip.textStyle.fontStyle:字体设置,可选值:normal、italic、oblique
tooltip.textStyle.fontWeight:字体粗细,可选值:normal、bold、bolder、lighter、100|200| 300|400...
tooltip.textStyle.fontFamily:字体,可选值:serif、sans-serif、monospace、Arial、Courier New、NewMicrosoft YaHei等
tooltip.textStyle.fontSize:字体大小
tooltip.textStyle.lineHeight:行高
tooltip.textStyle.width:文本宽度
tooltip.textStyle.height:文本高度
tooltip.textStyle.textBorderColor:边框颜色
tooltip.textStyle.textBorderWidth:边框宽度
tooltip.textStyle.textBorderType:边框线性,可选值:solid、dashed、dotted、[5,10]
tooltip.textStyle.textBorderDashOffset:虚线偏移量
tooltip.textStyle.textShadowColor:字体阴影颜色
tooltip.textStyle.textShadowBlur:字体阴影长度
tooltip.textStyle.textShadowOffsetX:字体水平偏移
tooltip.textStyle.textShadowOffsetY:字体垂直偏移

tooltip.textStyle.overflow:文本超出宽度是否阶段或者换行,可选值:
none:不截断或者换行
truncate:截断
break:单词间换行
breakAll:单词间、单词内换行

tooltip.textStyle.ellipsis:overflow为truncate时,文末显示文本
tooltip.textStyle.lineOverflow:文本超过高度后是否截断,可选值:none、truncate

tooltip.extraCssText:额外附加到浮层的css样式,如:box-shadow: 0 0 3px rgba(0, 0, 0, 0.3);
********************
示例
*************
普通折线图
<!DOCTYPE html>
<html lang="en">
<head>
    <meta charset="UTF-8">
    <title>Title</title>
    <script src="/echarts/echarts.min.js"></script>
    <script src="/js/jquery-3.6.0.min.js"></script>
    <script type="text/javascript">
        $(function (){
            const myChart = echarts.init($("#container")[0]);

            // 指定图表的配置项和数据
            const option = {
                title: {
                    left: 'center',
                    text: '水果季度销量折线图',
                    textStyle: {
                        color: '#6d6'
                    }
                },
                tooltip: {},
                legend: {
                    left: 'right',
                    data:['apple','banana']
                },
                dataset: {
                    source: [
                        ['quarter', '一季度', '二季度', '三季度', '四季度'],
                        ['apple', 200, 150, 180, 220],
                        ['banana', 100, 260, 220, 200]
                    ]
                },
                xAxis: {
                    type: 'category'
                },
                yAxis: {},
                series: [
                    {
                        name: 'apple',
                        type: 'line',
                        seriesLayoutBy: 'row',
                        label: {
                            show: true
                        }
                    },
                    {
                        name: 'banana',
                        type: 'line',
                        seriesLayoutBy: 'row',
                        label: {
                            show: true
                        }
                    }
                ]
            };

            // 使用刚指定的配置项和数据显示图表。
            myChart.setOption(option);
        })
    </script>
</head>
<body>
    <!-- 为 ECharts 准备一个定义了宽高的 DOM -->
    <div id="container" style="width: 600px;height:400px;"></div>
</body>
</html> 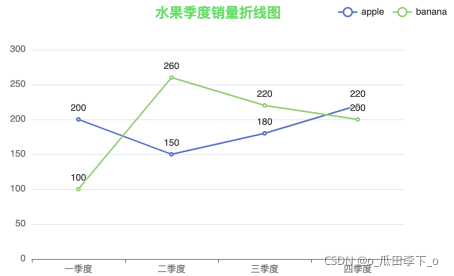
*************
区域面积图:每个折线图,使用不同的颜色填充
<!DOCTYPE html>
<html lang="en">
<head>
    <meta charset="UTF-8">
    <title>Title</title>
    <script src="/echarts/echarts.min.js"></script>
    <script src="/js/jquery-3.6.0.min.js"></script>
    <script type="text/javascript">
        $(function (){
            const myChart = echarts.init($("#container")[0]);

            // 指定图表的配置项和数据
            const option = {
                title: {
                    left: 'center',
                    text: '水果季度销量折线图',
                    textStyle: {
                        color: '#6d6'
                    }
                },
                tooltip: {},
                legend: {
                    left: 'right',
                    data:['apple','banana']
                },
                dataset: {
                    source: [
                        ['quarter', '一季度', '二季度', '三季度', '四季度'],
                        ['apple', 200, 150, 180, 220],
                        ['banana', 100, 260, 220, 200]
                    ]
                },
                xAxis: {
                    type: 'category'
                },
                yAxis: {},
                series: [
                    {
                        name: 'apple',
                        type: 'line',
                        seriesLayoutBy: 'row',
                        label: {
                            show: true
                        },
                        areaStyle: {
                            color: '#ed3'
                        }
                    },
                    {
                        name: 'banana',
                        type: 'line',
                        seriesLayoutBy: 'row',
                        label: {
                            show: true
                        },
                        areaStyle: {
                            color: '#842'
                        }
                    }
                ]
            };

            // 使用刚指定的配置项和数据显示图表。
            myChart.setOption(option);
        })
    </script>
</head>
<body>
    <!-- 为 ECharts 准备一个定义了宽高的 DOM -->
    <div id="container" style="width: 600px;height:400px;"></div>
</body>
</html> 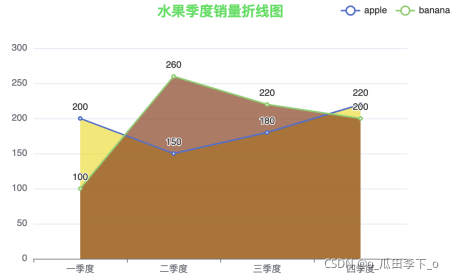
*************
堆叠折线图
<!DOCTYPE html>
<html lang="en">
<head>
    <meta charset="UTF-8">
    <title>Title</title>
    <script src="/echarts/echarts.min.js"></script>
    <script src="/js/jquery-3.6.0.min.js"></script>
    <script type="text/javascript">
        $(function (){
            const myChart = echarts.init($("#container")[0]);

            // 指定图表的配置项和数据
            const option = {
                title: {
                    left: 'center',
                    text: '水果季度销量折线图',
                    textStyle: {
                        color: '#6d6'
                    }
                },
                tooltip: {},
                legend: {
                    left: 'right',
                    data:['apple','banana']
                },
                dataset: {
                    source: [
                        ['quarter', '一季度', '二季度', '三季度', '四季度'],
                        ['apple', 200, 150, 180, 220],
                        ['banana', 100, 260, 220, 200]
                    ]
                },
                xAxis: {
                    type: 'category'
                },
                yAxis: {},
                series: [
                    {
                        name: 'apple',
                        type: 'line',
                        seriesLayoutBy: 'row',
                        label: {
                            show: true
                        },
                        stack: '2020',
                        areaStyle: {
                            color: '#ed3'
                        }
                    },
                    {
                        name: 'banana',
                        type: 'line',
                        seriesLayoutBy: 'row',
                        label: {
                            show: true
                        },
                        stack: '2020',
                        areaStyle: {
                            color: '#842'
                        }
                    }
                ]
            };

            // 使用刚指定的配置项和数据显示图表。
            myChart.setOption(option);
        })
    </script>
</head>
<body>
    <!-- 为 ECharts 准备一个定义了宽高的 DOM -->
    <div id="container" style="width: 600px;height:400px;"></div>
</body>
</html> 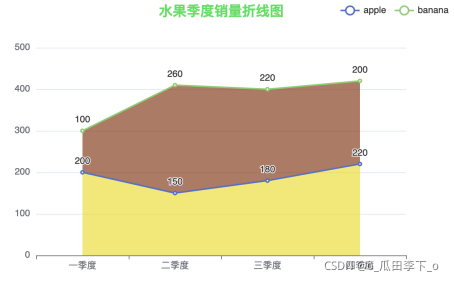
*************
平滑曲线图
<!DOCTYPE html>
<html lang="en">
<head>
    <meta charset="UTF-8">
    <title>Title</title>
    <script src="/echarts/echarts.min.js"></script>
    <script src="/js/jquery-3.6.0.min.js"></script>
    <script type="text/javascript">
        $(function (){
            const myChart = echarts.init($("#container")[0]);

            // 指定图表的配置项和数据
            const option = {
                title: {
                    left: 'center',
                    text: '水果季度销量折线图',
                    textStyle: {
                        color: '#6d6'
                    }
                },
                tooltip: {},
                legend: {
                    left: 'right',
                    data:['apple','banana']
                },
                dataset: {
                    source: [
                        ['quarter', '一季度', '二季度', '三季度', '四季度'],
                        ['apple', 200, 150, 180, 220],
                        ['banana', 100, 260, 220, 200]
                    ]
                },
                xAxis: {
                    type: 'category'
                },
                yAxis: {},
                series: [
                    {
                        name: 'apple',
                        type: 'line',
                        smooth: true,      //平滑曲线
                        seriesLayoutBy: 'row',
                        label: {
                            show: true
                        },
                        areaStyle: {
                            color: '#ed3'
                        }
                    },
                    {
                        name: 'banana',
                        type: 'line',
                        smooth: true,      //平滑曲线
                        seriesLayoutBy: 'row',
                        label: {
                            show: true
                        },
                        areaStyle: {
                            color: '#842'
                        }
                    }
                ]
            };

            // 使用刚指定的配置项和数据显示图表。
            myChart.setOption(option);
        })
    </script>
</head>
<body>
    <!-- 为 ECharts 准备一个定义了宽高的 DOM -->
    <div id="container" style="width: 600px;height:400px;"></div>
</body>
</html> 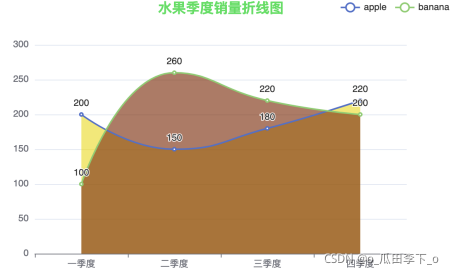
*************
阶梯折线图
<!DOCTYPE html>
<html lang="en">
<head>
    <meta charset="UTF-8">
    <title>Title</title>
    <script src="/echarts/echarts.min.js"></script>
    <script src="/js/jquery-3.6.0.min.js"></script>
    <script type="text/javascript">
        $(function (){
            const myChart = echarts.init($("#container")[0]);

            // 指定图表的配置项和数据
            const option = {
                title: {
                    left: 'center',
                    text: '水果季度销量折线图',
                    textStyle: {
                        color: '#6d6'
                    }
                },
                tooltip: {},
                legend: {
                    left: 'right',
                    top: '10',
                    orient: 'vertical',
                    data:['apple start','banana middle','orange end']
                },
                dataset: {
                    source: [
                        ['quarter', '一季度', '二季度', '三季度', '四季度'],
                        ['apple', 200, 350, 380, 320],
                        ['banana', 100, 260, 220, 200],
                        ['orange', 40, 180, 80, 140]
                    ]
                },
                xAxis: {
                    type: 'category'
                },
                yAxis: {},
                series: [
                    {
                        name: 'apple start',
                        type: 'line',
                        step: 'start',
                        seriesLayoutBy: 'row',
                        label: {
                            show: true
                        }
                    },
                    {
                        name: 'banana middle',
                        type: 'line',
                        step: 'middle',
                        seriesLayoutBy: 'row',
                        label: {
                            show: true
                        }
                    },
                    {
                        name: 'orange end',
                        type: 'line',
                        step: 'end',
                        seriesLayoutBy: 'row',
                        label: {
                            show: true
                        }
                    }
                ]
            };

            // 使用刚指定的配置项和数据显示图表。
            myChart.setOption(option);
        })
    </script>
</head>
<body>
    <!-- 为 ECharts 准备一个定义了宽高的 DOM -->
    <div id="container" style="width: 600px;height:400px;"></div>
</body>
</html> 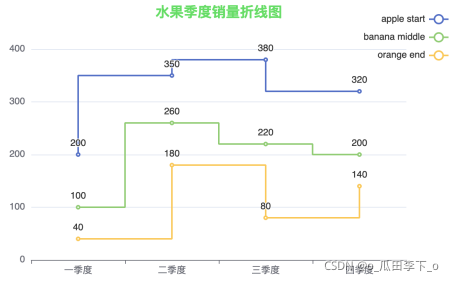


 310
310

 被折叠的 条评论
为什么被折叠?
被折叠的 条评论
为什么被折叠?
 到【灌水乐园】发言


