


文章目录
0.泰勒图介绍
见参考文献[4]
1.准备步骤
(1)taylordiag.m。
在参考文献【2】下载泰勒图的函数脚本。
表1.函数需要的输入变量如下表
| 输入变量 | 术语解释 |
|---|---|
| STDs | 标准差(Standard deviations) |
| RMSs | 去中心的均方根误差(Centered Root Mean Square Difference 就是减去平均值再求RMS) |
| CORs | 皮尔逊相关系数(Correlation) |
(2)allstats.m
在参考文献【1】下载计算输入变量的函数脚本。
为了计算表1.中的参数,可直接利用allstats.m函数计算。如表2,随意设计一组原始数据格式,记为a,第一行为参考序列,第二行为模式1,第二行模式2,依次类推。
表2 原始数据
| 模式 | 值1 | 值2 | 值3 | 值4 | 值5 | 值6 | 值7 |
|---|---|---|---|---|---|---|---|
| 参考序列 | 26 | 47 | 51 | 52 | 28 | 47 | 32 |
| 模式1 | 32 | 37 | 40 | 52 | 46 | 45 | 21 |
| 模式2 | 49 | 58 | 51 | 52 | 38 | 47 | 35 |
| 模式3 | 26 | 47 | 51 | 52 | 28 | 47 | 32 |
| 模式4 | 26 | 47 | 51 | 22 | 28 | 47 | 32 |
| 模式5 | 26 | 47 | 51 | 52 | 38 | 47 | 35 |
下列代码计算表1中的变量
for iserie = 2 : size(a,1)
 		    S = allstats(a(1,:),a(iserie,:));
 		    MYSTATS(iserie,:) = S(:,2); % We get stats versus reference
end       %for iserie
 MYSTATS(1,:) = S(:,1); % We assign reference stats to the first row
2.生成泰勒图
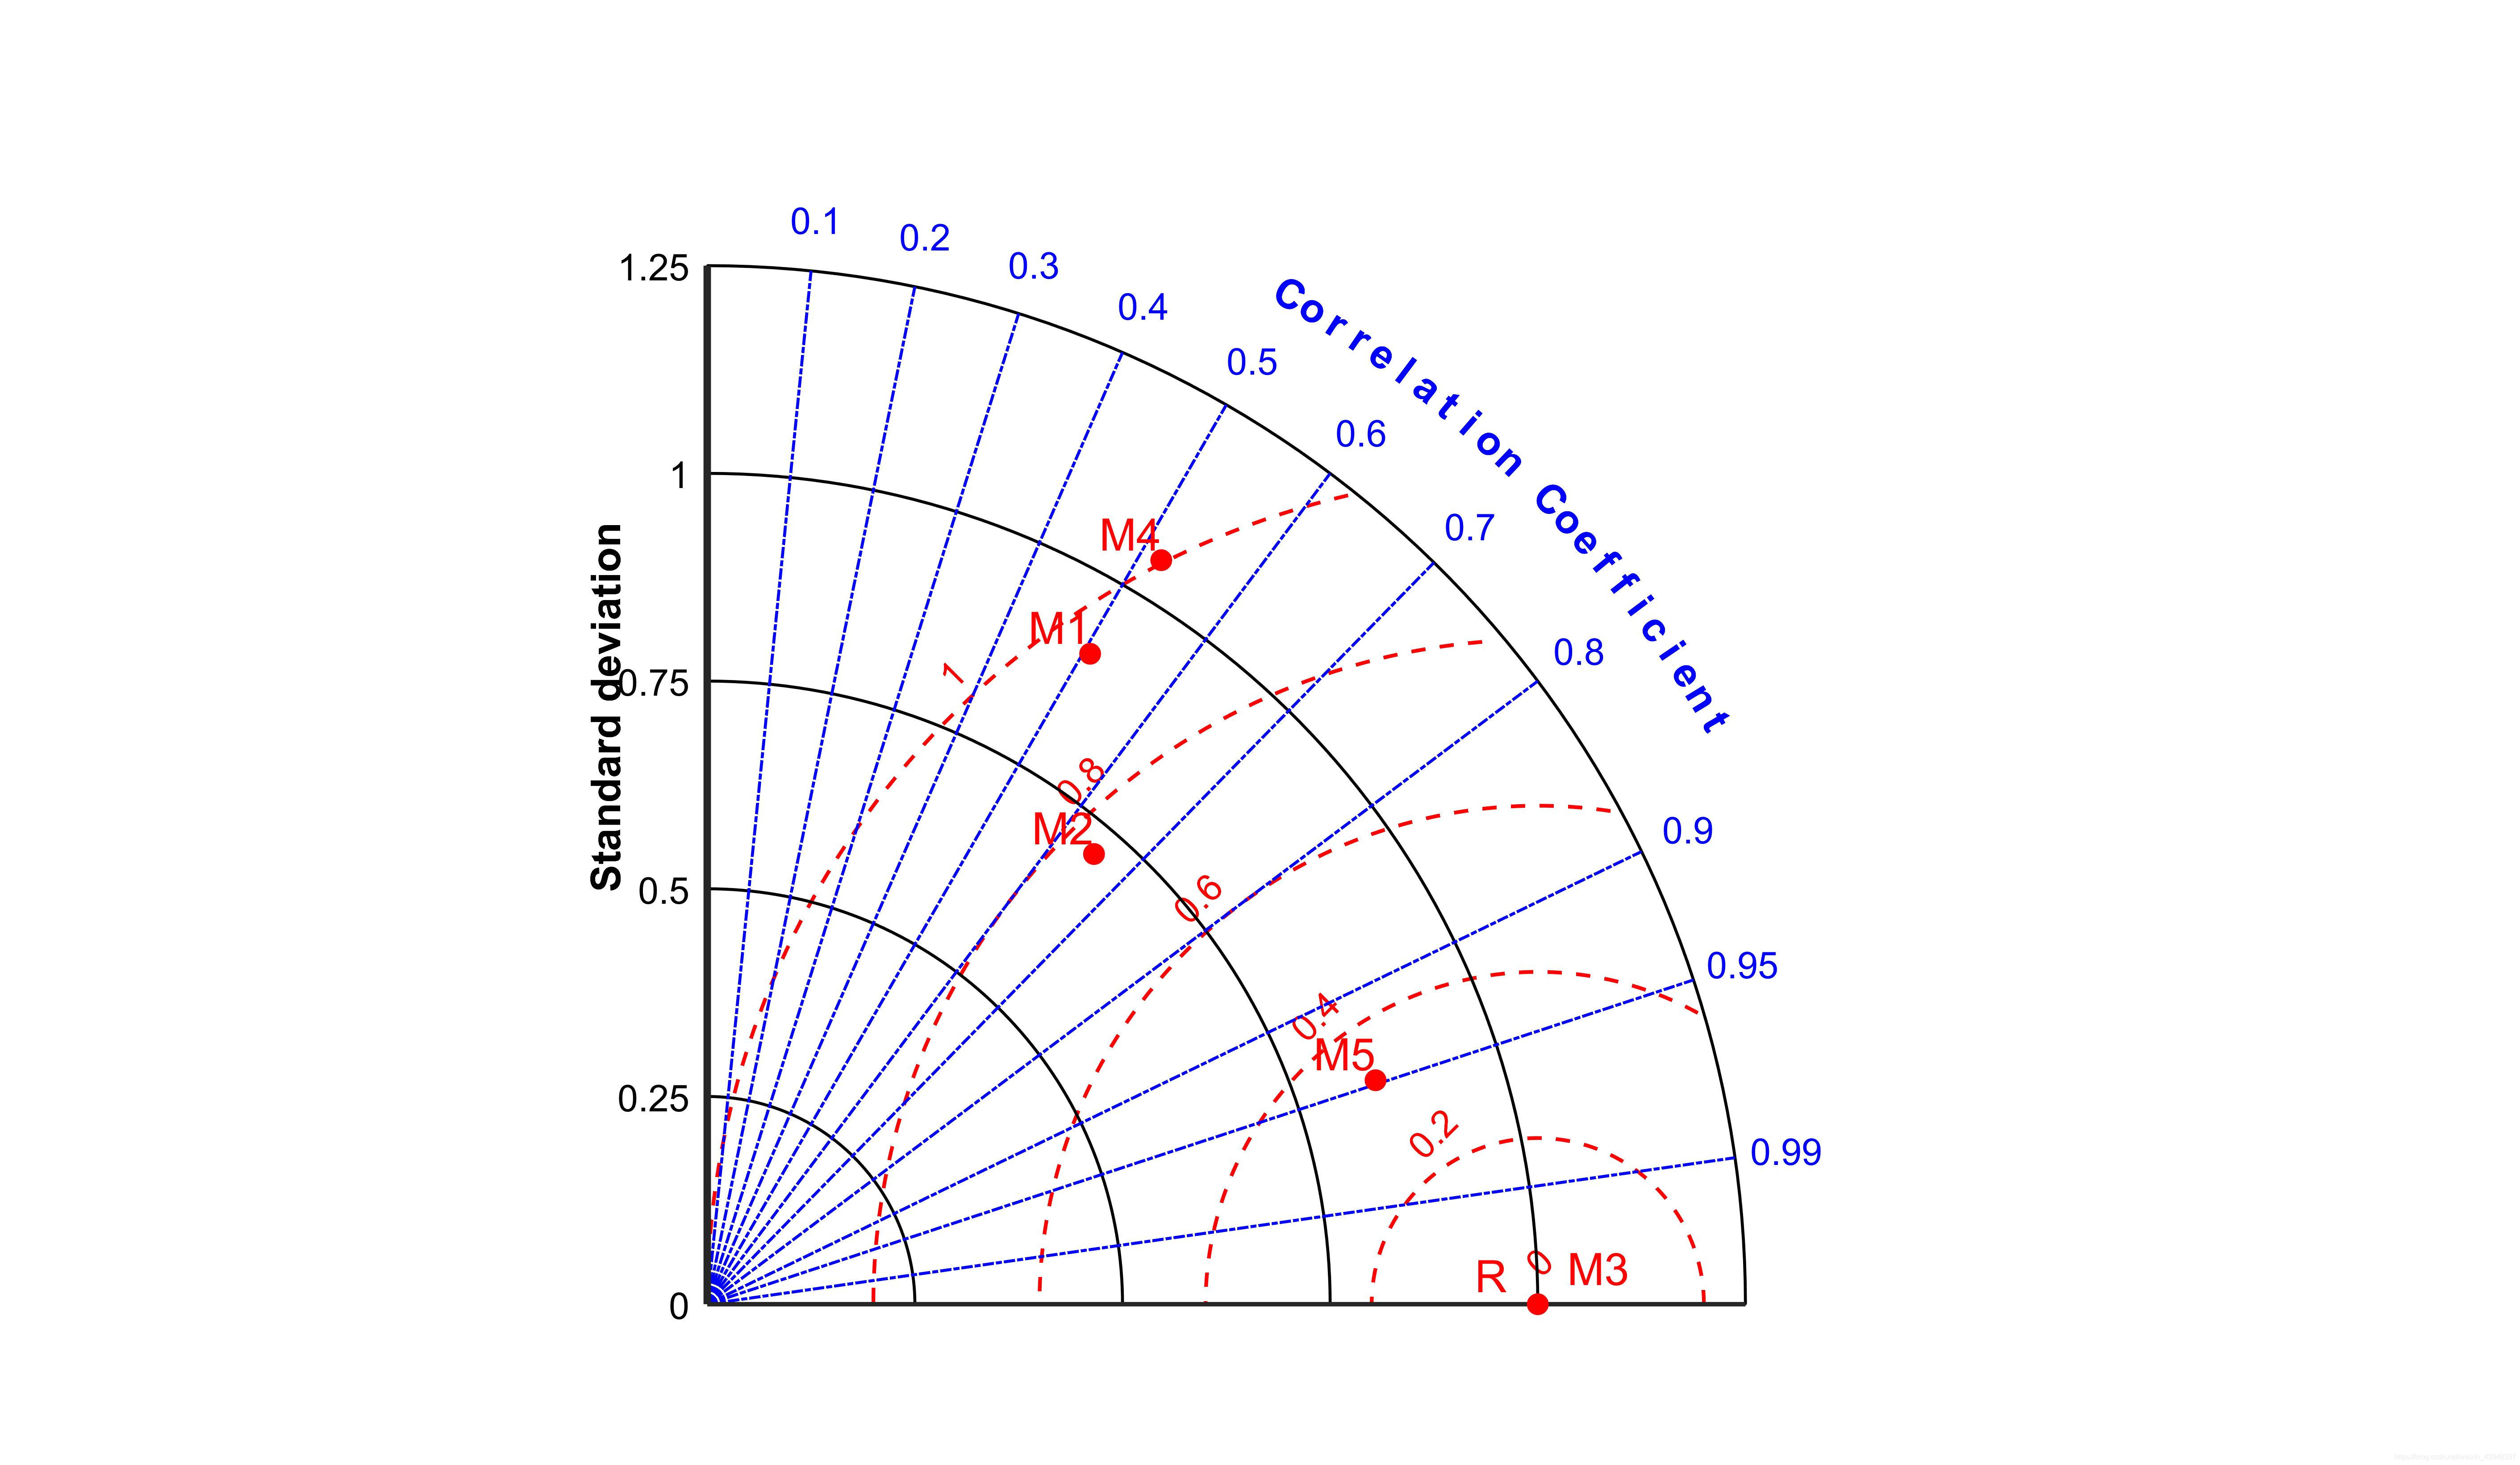
预处理后,直接带入taylordiag函数即可,生成图片如下所示。
taylordiag(MYSTATS(:,2),MYSTATS(:,3),MYSTATS(:,4));

3.后处理
(1)一般泰勒图都要标准化处理。标准差与均方根误差同时除以参考序列的标准差。
(2)根据数值范围,设置坐标轴参数。具体参数设置参考taylordiag.m的492-523行。
(3)不想看代码,可保存后导入Ai、PS后处理。完毕。
%%计算输入参数
for iserie = 2 : size(a,1)
 		    S = allstats(a(1,:),a(iserie,:));
 		    MYSTATS(iserie,:) = S(:,2); % We get stats versus reference
end       %for iserie
 MYSTATS(1,:) = S(:,1); % We assign reference stats to the first row

%  taylordiag(MYSTATS(:,2),MYSTATS(:,3),MYSTATS(:,4));
stdev=MYSTATS(1,2);

MYSTATS(:,2)=MYSTATS(:,2)/stdev;% 标准化处理
MYSTATS(:,3)=MYSTATS(:,3)/stdev;%标准化处理

 [hp ht axl] =taylordiag(MYSTATS(:,2),MYSTATS(:,3),MYSTATS(:,4), ...
                 'tickrms',[0:.2:1],'titleRMS', 0 ,'showlabelsRMS',1,...
                 'widthRMS',1,'colRMS','r',...
                 'tickSTD',[0:.25:1.25],'limSTD',1.25,'styleSTD','-',...
                 'tickCOR',[.1:.1:.9 .95 .99],'showlabelsCOR',1,'titleCOR',1);
注:
①对下面报错
错误使用 taylordiag (line 108)
taylordiag.m : Something's wrong with ALL the datas
You must have:
RMSs - sqrt(STDs.^2 + STDs(1)^2 - 2*STDs*STDs(1).*CORs) = 0 !
不要自己创建输入变量STDs、RMSs、CORs这些,一定要自己利用原始值算出。
②R语言创建泰勒图
? TaylorDiagram {openair}(强烈推荐)
? taylor.diagram {plotrix}
③PeterRochford/SkillMetricsToolbox
PeterRochford/SkillMetricsToolbox也可创建泰勒图,但此时注意到的是MATLAB对用的版本要在2016b及以上。否则会报错,"xticks"函数不存在。
4.参考文献
[1]allstats.m下载
[2]taylordiag.m下载
[3]参数设置
[4]Taylor, K. E. (2001). Summarizing multiple aspects of model performance in a single diagram. Journal of Geophysical Research: Atmospheres, 106(D7), 7183-7192.
5 allstats.m代码
% STATM Compute statistics from 2 series
%
% STATM = allstats(Cr,Cf)
%
% Compute statistics from 2 series considering Cr as the reference.
%
% Inputs:
%	Cr and Cf are of same length and uni-dimensional. They may contain NaNs.
%
% Outputs:
% 	STATM(1,:) => Mean
% 	STATM(2,:) => Standard Deviation (scaled by N)
% 	STATM(3,:) => Centered Root Mean Square Difference (scaled by N)
% 	STATM(4,:) => Correlation
%
% Notes:
%	- N is the number of points where BOTH Cr and Cf are defined
%
% 	- NaN are handled in the following way: because this function
% 		aims to compair 2 series, statistics are computed with indices
%		where both Cr and Cf are defined.
%
% 	- STATM(:,1) are from Cr (ie with C=Cr hereafter)
% 	  STATM(:,2) are from Cf versus Cr (ie with C=Cf hereafter)
%
%	- The MEAN is computed using the Matlab mean function.
%
%	- The STANDARD DEVIATION is computed as:
%			          /  sum[ {C-mean(C)} .^2]  \
%			STD = sqrt|  ---------------------  |
%			          \          N              /
%
%	- The CENTERED ROOT MEAN SQUARE DIFFERENCE is computed as:
%			           /  sum[  { [C-mean(C)] - [Cr-mean(Cr)] }.^2  ]  \
%			RMSD = sqrt|  -------------------------------------------  |
%			           \                      N                        /
%
%	- The CORRELATION is computed as:
%			      sum( [C-mean(C)].*[Cr-mean(Cr)] )
%			COR = ---------------------------------
%			              N*STD(C)*STD(Cr)
%
%	- STATM(3,1) = 0 and STATM(4,1) = 1 by definition !
%
% Created by Guillaume Maze on 2008-10-28.
% Rev. by Guillaume Maze on 2010-02-10: Add NaN values handling, some checking
%				in the inputs and a more complete help
% Copyright (c) 2008 Guillaume Maze.
% http://codes.guillaumemaze.org


%
% This program is free software: you can redistribute it and/or modify it under the terms of the GNU General Public License as published by
% the Free Software Foundation, either version 3 of the License, or any later version.
% This program is distributed in the hope that it will be useful, but WITHOUT ANY WARRANTY; without even the implied warranty of
% MERCHANTABILITY or FITNESS FOR A PARTICULAR PURPOSE.  See the GNU General Public License for more details.
% You should have received a copy of the GNU General Public License along with this program.  If not, see <http://www.gnu.org/licenses/>.
%

function STATM = allstats(varargin)

Cr = varargin{1}; Cr = Cr(:);
Cf = varargin{2}; Cf = Cf(:);

%%% Check size:
if length(Cr) ~= length(Cf)
	error('Cr and Cf must be of same length');
end

%%% Check NaNs:
iok = find(isnan(Cr)==0 & isnan(Cf)==0);
if length(iok) ~= length(Cr)
	warning('Found NaNs in inputs, removed them to compute statistics');
end
Cr  = Cr(iok);
Cf  = Cf(iok);
N   = length(Cr);

%%% STD:
st(1) = sqrt(sum(  (Cr-mean(Cr) ).^2)  / N );
st(2) = sqrt(sum(  (Cf-mean(Cf) ).^2)  / N );
%st(1) = sqrt(sum(  (Cr-mean(Cr) ).^2)  / (N-1) );
%st(2) = sqrt(sum(  (Cf-mean(Cf) ).^2)  / (N-1) );

%%% MEAN:
me(1) = mean(Cr);
me(2) = mean(Cf);

%%% RMSD:
rms(1) = sqrt(sum(  ( ( Cr-mean(Cr) )-( Cr-mean(Cr) )).^2)  /N);
rms(2) = sqrt(sum(  ( ( Cf-mean(Cf) )-( Cr-mean(Cr) )).^2)  /N);

%%% CORRELATIONS:
co(1) = sum(  ( ( Cr-mean(Cr) ).*( Cr-mean(Cr) )))/N/st(1)/st(1);
co(2) = sum(  ( ( Cf-mean(Cf) ).*( Cr-mean(Cr) )))/N/st(2)/st(1);


%%% OUTPUT
STATM(1,:) = me;
STATM(2,:) = st;
STATM(3,:) = rms;
STATM(4,:) = co;

end %function
6 拓展 MVIETool: 改进的多变量集合评估方法及多模式比较评估工具
Zhang Meng-Zhuo, Zhongfeng Xu*, Ying Han, and Weidong Guo, 2021: An improved multivariable integrated evaluation method and tool (MVIETool) v1.0 for multimodel intercomparison, Geosci. Model Dev., 14, 3079–3094, https://doi.org/10.5194/gmd-14-3079-2021


 940
940


 被折叠的 条评论
为什么被折叠?
被折叠的 条评论
为什么被折叠?
 到【灌水乐园】发言


