


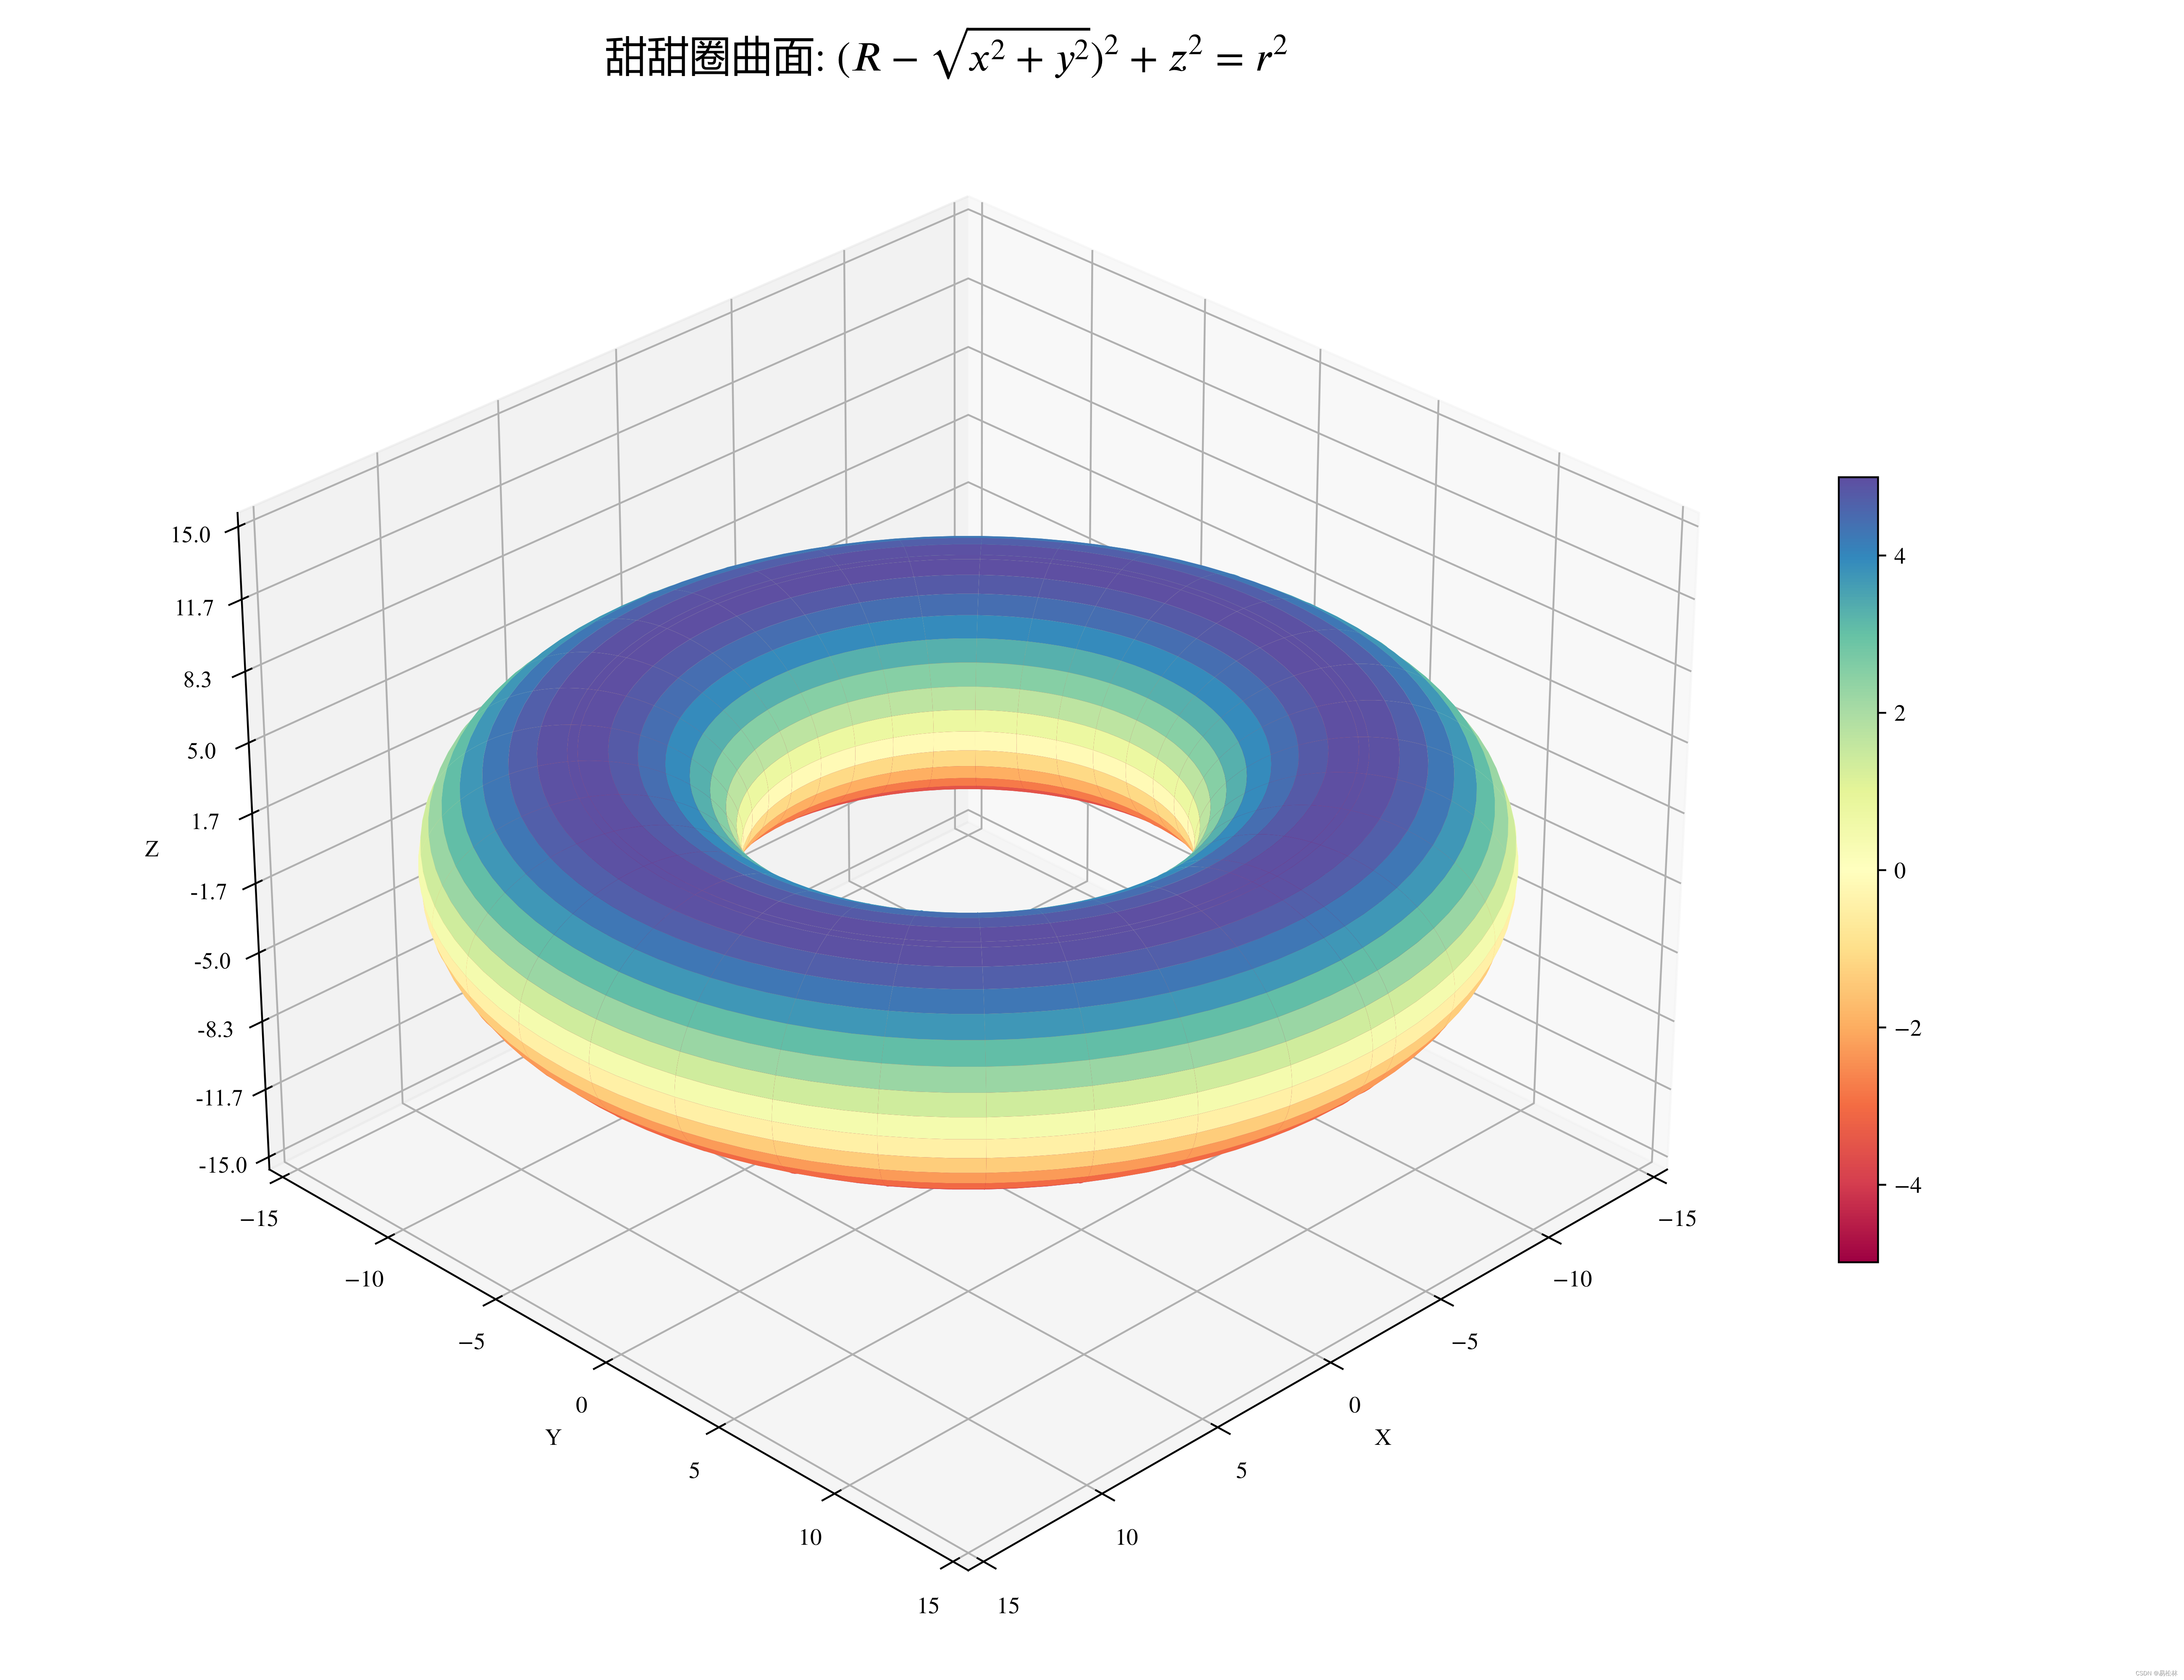
下面以Matplotlib绘制甜甜圈曲面为例。因图片标题使用了中文,所以添加了Matplotlib中文支持,因为Matplotlib版本原因,pgf.preamble.update的格式有所变化,如果不注意会导致Latex字体设置失效,需要尝试字符串排列格式或列表格式["\\usepackage{xeCJK}","\\usepackage{amssymb}",]。
python代码如下:
# -*_ coding: utf-8 -*-

import numpy as np
import matplotlib.pyplot as plt
from matplotlib.ticker import LinearLocator, FormatStrFormatter
import matplotlib as mpl
mpl.use("pgf") #plt.show()将不能使用
#全局打开text.usetex,所有字体受到影响
#pgf.preamble不同版本写法不一样,需要尝试:字符串排列或者["\\usepackage{xeCJK}","\\usepackage{amssymb}",]
mpl.rcParams.update({
    "pgf.rcfonts": False, # 在pgf.preamble中设置字体
    "text.usetex": True,  # use default xelatex
    "pgf.texsystem": "xelatex",
    "font.family": "Times New Roman", #全局字体设置,下面的setCJKmainfont会覆盖中文字体
    "font.sans-serif": "Tahoma", #非衬线字体
    "pgf.preamble":
         "\\usepackage{xeCJK}"         # load CJK package
         "\\usepackage{amssymb}"
         "\\usepackage{metalogo}"
         "\\usepackage{unicode-math}"  # unicode math setup
         "\\usepackage{fontspec}"
         "\\xeCJKsetup{CJKmath=true}"  #公式里使用中文
         "\\setmathfont{XITS Math}"     # 公式的XITS字体
         "\\setCJKmainfont{Microsoft YaHei}"  # 设置中文字体
    })


n = 101
R = 12
r = 5

u, v=np.meshgrid(np.linspace(0, 2*np.pi, n), np.linspace(0, 2*np.pi, n))

x = (R - r*np.sin(v))*np.sin(u)
y = (R - r*np.sin(v))*np.cos(u)
z = r*np.cos(v)


fig = plt.figure(figsize=(13, 10))
ax3d = plt.axes(projection='3d')


ax3d.set_xlabel("X")
ax3d.set_ylabel("Y")
ax3d.set_zlabel("Z")
ax3d.set_zlim(-15.01, 15.01)
ax3d.set_xlim(-15.01, 15.01)
ax3d.set_ylim(-15.01, 15.01)
ax3d.zaxis.set_major_locator(LinearLocator(10))
ax3d.zaxis.set_major_formatter(FormatStrFormatter('%.01f'))

plt.tick_params(labelsize=10)

surf = ax3d.plot_surface(x, y, z, cmap=plt.cm.Spectral)


ax3d.set_title(r"甜甜圈曲面:\  $(R - \sqrt{x^2 + y^2})^2 + z^2 = r^2$", fontsize=18)

#视角,第一个参数是上下视角旋转角度,第二个参数是x,y平面视角旋转角度
ax3d.view_init(30, 45)
#shrink表示图例缩放比例,aspect表示长宽比
fig.colorbar(surf, shrink=0.5, aspect=20)
plt.tight_layout()

#400dpi已经很清楚了
plt.savefig("figs/fig8-stl-surface.png",dpi=400)
plt.savefig("figs/fig8-stl-surface.pdf",dpi=400)
#plt.show()


#三维曲面由四边形组成
import surf2stl
surf2stl.write('figs/fig8-stl-surface.stl', x, y, z)
输出的png图片如下:
将三维曲面输出到STL文件,用到了 surf2stl,需要手动git:
git clone https://github.com/asahidari/surf2stl-python输出的STL三维文件用系统自带的画图3D软件或Solidworks都能打开。


 1153
1153

 被折叠的 条评论
为什么被折叠?
被折叠的 条评论
为什么被折叠?
 到【灌水乐园】发言


