


sklearn.neighbors.KNeighborsClassifier
官方:link
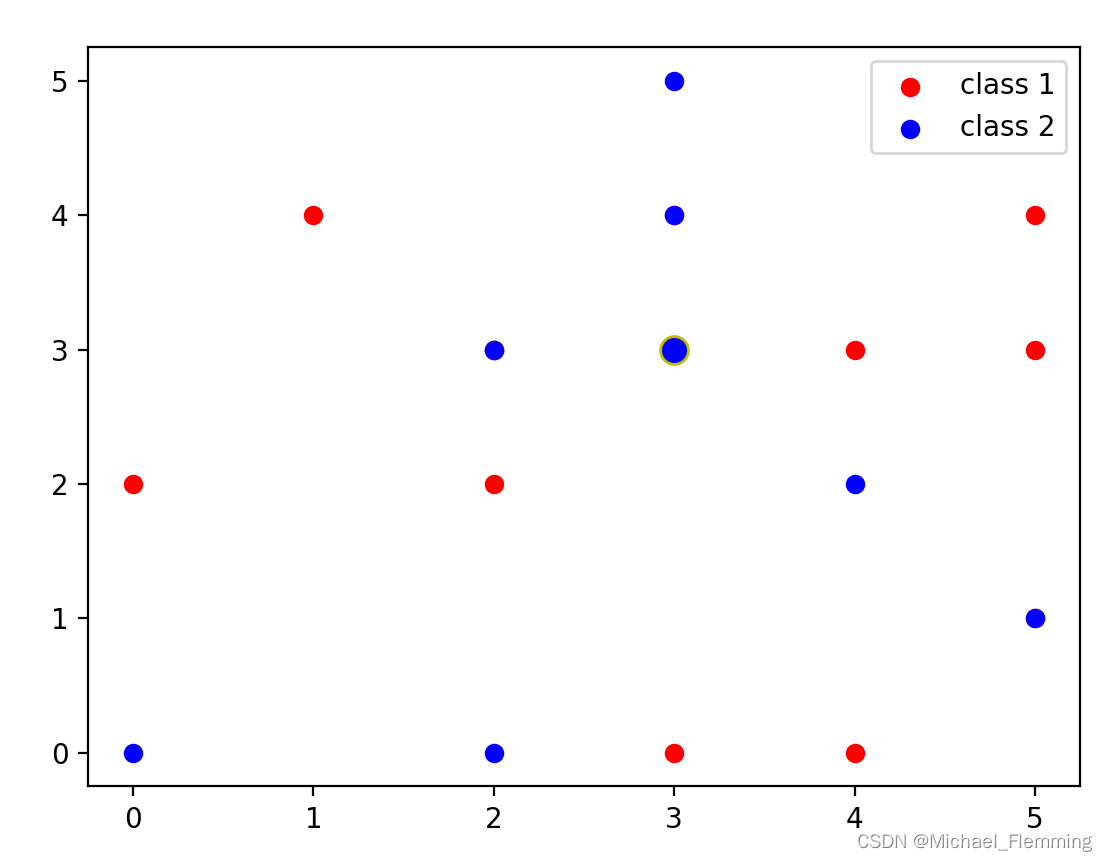
例子:
import numpy as np
from sklearn.neighbors import KNeighborsClassifier
from matplotlib import pyplot as plt

X = np.random.randint(0, 6, (20, 2))
y = np.random.randint(0, 2, (20,))

knn = KNeighborsClassifier(n_neighbors=1)
knn.fit(X, y)

x_new = np.array([3, 3])
y_pre = knn.predict(x_new[np.newaxis, :])
labels = ['class 1', 'class 2']
colors = 'rb'
n_class = 2
for i, color in zip(range(n_class), colors):
    idx = np.where(y == i)
    plt.scatter(X[idx, 0], X[idx, 1], c=color, label=labels[i])
plt.legend()
plt.scatter(3, 3, c=colors[y_pre[0]], edgecolors='y', s=100)

print(y_pre)
plt.show()
例子二:
from sklearn.neighbors import KNeighborsClassifier
from sklearn.datasets import make_classification
import numpy as np
from matplotlib import pyplot as plt
from matplotlib.colors import ListedColormap

X, y = make_classification(n_samples=1000, n_features=2, n_classes=4, n_redundant=0, n_clusters_per_class=1)
knn = KNeighborsClassifier(n_neighbors=5)
# 画散点图
ax = plt.gca()

knn.fit(X, y)
# 画出决策边界
x1_min, x1_max = X[:, 0].min(), X[:, 0].max() + 1
x2_min, x2_max = X[:, 1].min(), X[:, 1].max() + 1
xx, yy = np.meshgrid(np.arange(x1_min, x1_max, 0.1), np.arange(x2_min, x2_max, 0.1))
cmap_light = ListedColormap(['#FFAAAA', '#AAFFAA', '#AAAAFF','#FFAAFF'])
cmap_bold = ListedColormap(['#FF0000', '#00FF00', '#0000FF','#FF00FF'])
# 预测网格数据
y_pre = knn.predict(np.c_[xx.ravel(), yy.ravel()])
y_pre = y_pre.reshape(xx.shape)
plt.contourf(xx, yy, y_pre, cmap=cmap_light)
colors = 'rgby'
ax.scatter(X[:, 0], X[:, 1], c=y, cmap=cmap_bold, s=10, edgecolor='black')
plt.show()


 399
399


 被折叠的 条评论
为什么被折叠?
被折叠的 条评论
为什么被折叠?
 到【灌水乐园】发言


