


initOtherChart();
function initOtherChart() {
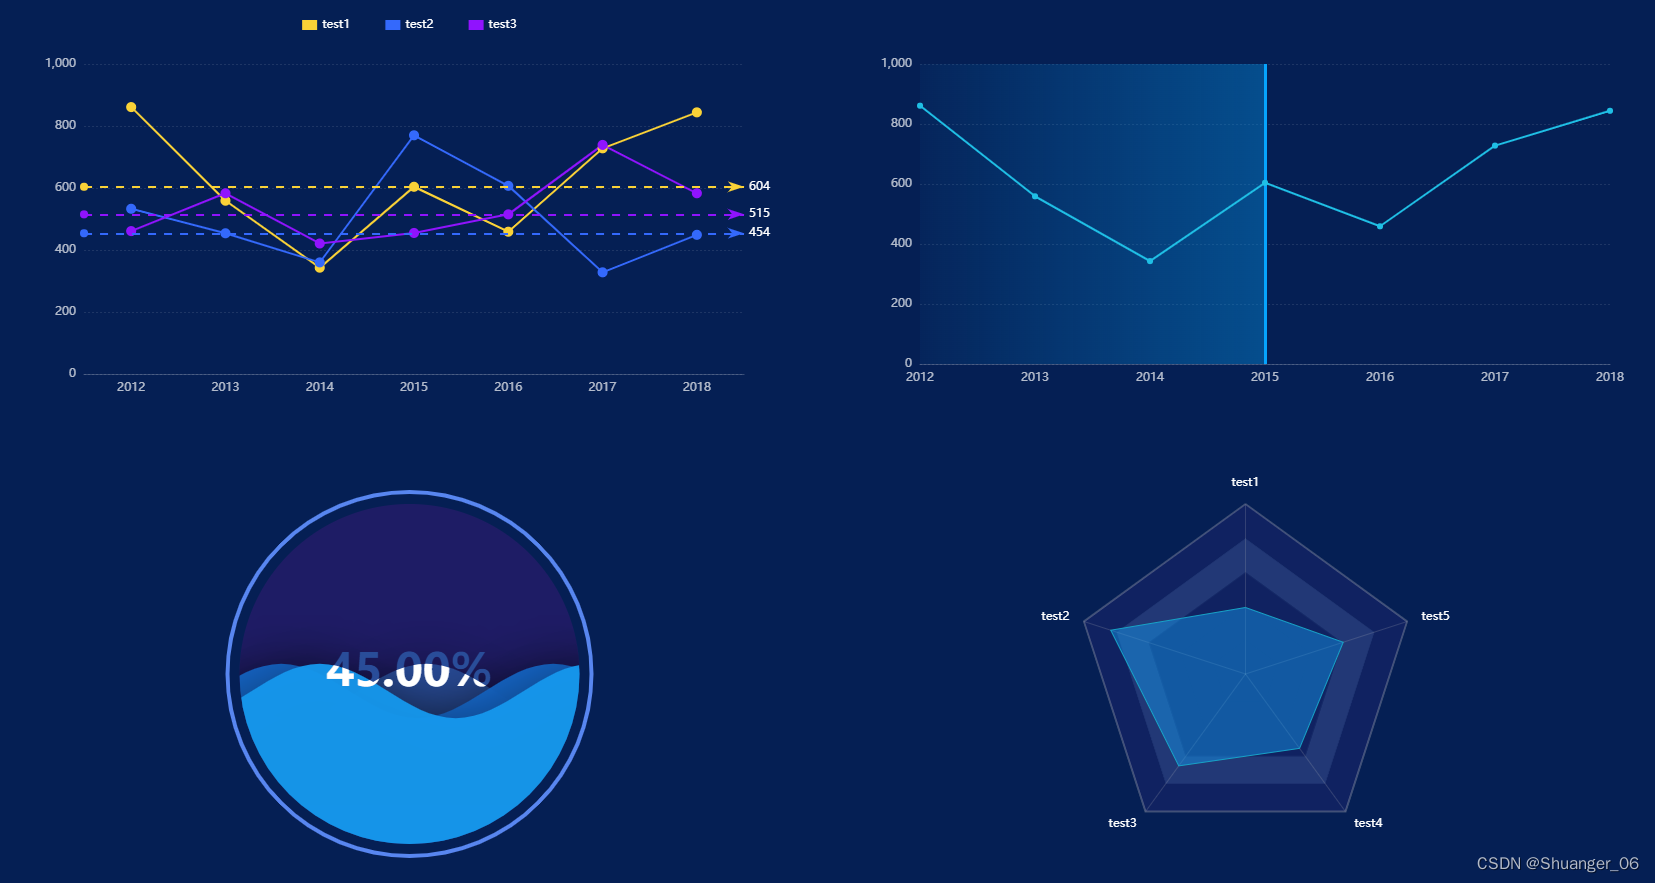
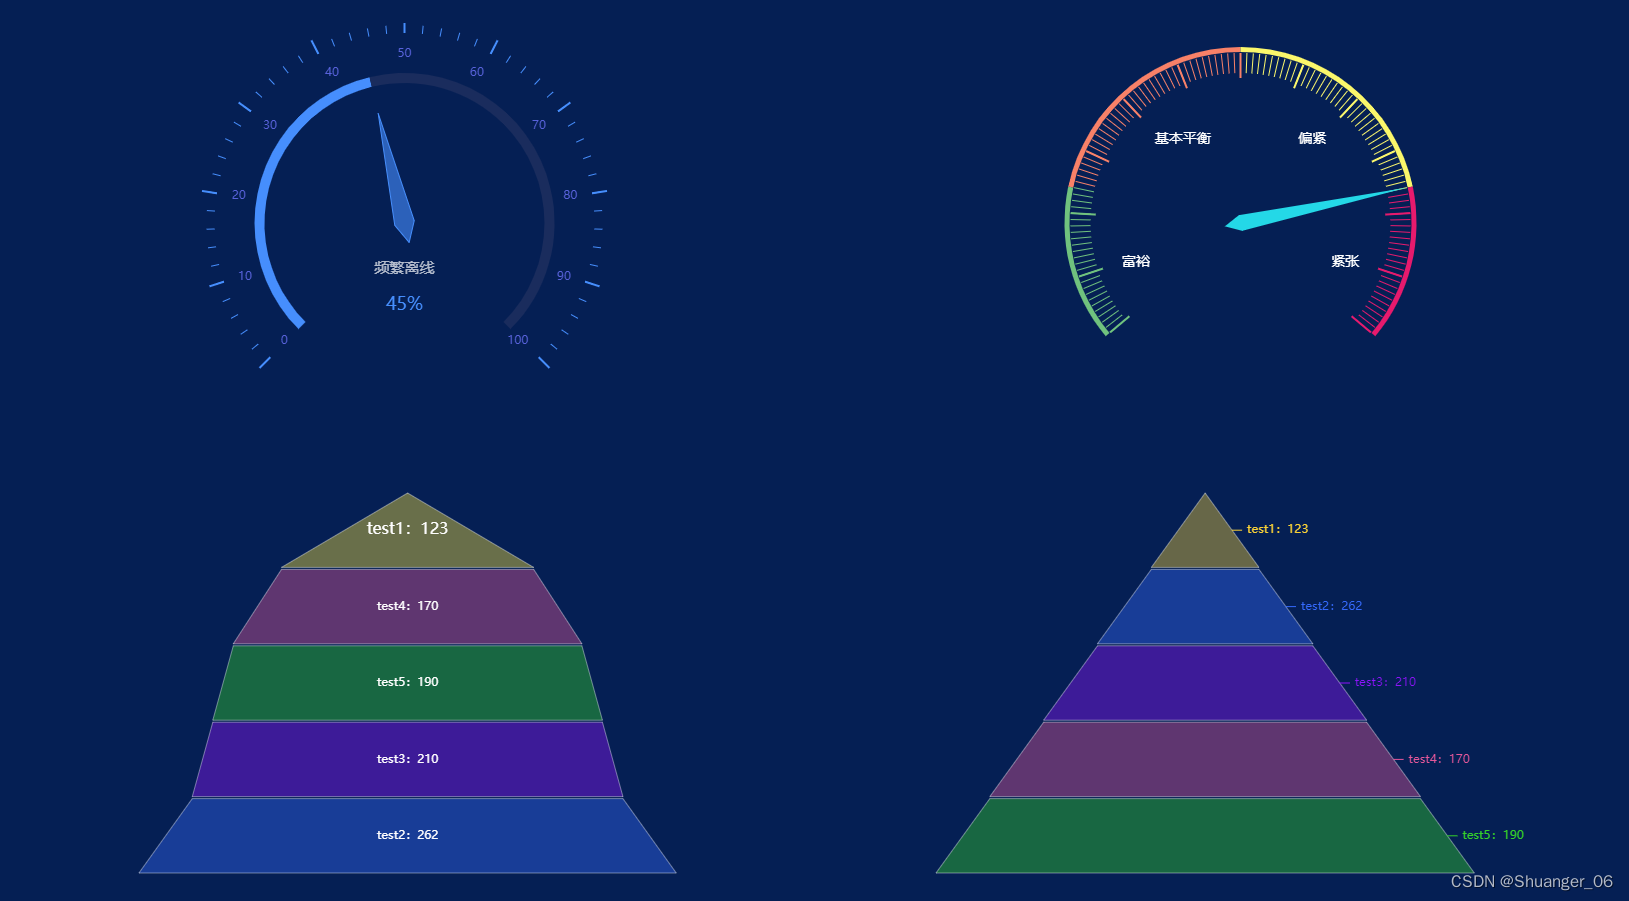
let data = [{
name: 'test1',
value: 123
}, {
name: 'test2',
value: 262
}, {
name: 'test3',
value: 210
}, {
name: 'test4',
value: 170
}, {
name: 'test5',
value: 190
}];
let dataArr = [{
name: '校园大数据',
state: '1'
}, {
name: '舆情大数据',
state: '1'
}, {
name: '用户分析',
state: '1'
}, {
name: '话题分析',
state: '1'
}, {
name: '评论分析',
state: '1'
}, {
name: '图书馆分析',
state: '1'
}, {
name: '借阅分析',
state: '1'
}, {
name: '借阅排行',
state: '0'
}, {
name: '图书收录',
state: '2'
}, {
name: '图书分析',
state: '1'
}];
let linkArr2 = [{
source: '校园大数据',
target: '舆情大数据'
}, {
source: '校园大数据',
target: '用户分析'
}, {
source: '校园大数据',
target: '话题分析'
}, {
source: '校园大数据',
target: '评论分析'
}, {
source: '校园大数据',
target: '图书馆分析'
}, {
source: '校园大数据',
target: '借阅分析'
}, {
source: '校园大数据',
target: '借阅排行'
}, {
source: '校园大数据',
target: '图书收录'
}, {
source: '校园大数据',
target: '图书分析'
}];
let linkArr = [{
source: '校园大数据',
target: '舆情大数据'
}, {
source: '校园大数据',
target: '图书馆分析',
}, {
source: '舆情大数据',
target: '用户分析',
}, {
source: '舆情大数据',
target: '话题分析',
}, {
source: '舆情大数据',
target: '评论分析',
}, {
source: '校园大数据',
target: '图书馆分析',
}, {
source: '图书馆分析',
target: '图书分析',
}, {
source: '图书馆分析',
target: '借阅分析',
}, {
source: '图书馆分析',
target: '借阅排行',
}, {
source: '图书馆分析',
target: '图书收录'
}];
let mixinData = {
xAxisData: ['2012', '2013', '2014', '2015', '2016', '2017', '2018'],
seriesData: [{
type: 'bar',
name: 'test1',
data: [861, 559, 343, 604, 459, 728, 844]
}, {
type: 'bar',
name: 'test2',
data: [533, 454, 360, 770, 607, 328, 449]
}, {
type: 'line',
name: 'test3',
data: [461, 583, 421, 455, 515, 739, 583]
}]
};
columnLineChart(this.$Echarts.init(document.getElementById('mixin1')), mixinData);
liquidFillChart(this.$Echarts.init(document.getElementById('other1')), 0.45);
radarChart(this.$Echarts.init(document.getElementById('other2')), data);
dashboardChart(this.$Echarts.init(document.getElementById('other3')), 45);
funnelChart1(this.$Echarts.init(document.getElementById('other4')), data);
funnelChart2(this.$Echarts.init(document.getElementById('other5')), data);
taggingChart(this.$Echarts.init(document.getElementById('other6')), mixinData);
markLineChart(this.$Echarts.init(document.getElementById('other7')), mixinData);
markLineChart2(this.$Echarts.init(document.getElementById('other8')), {
xAxisData: ['2012', '2013', '2014', '2015', '2016', '2017', '2018'],
start: '2012',
end: '2015',
seriesData: [{
name: '实际用电曲线',
data: [861, 559, 343, 604, 459, 728, 844]
}]
});
relationChart(this.$Echarts.init(document.getElementById('other9')), {
dataArr: dataArr,
linkArr: linkArr
});
relationChart2(this.$Echarts.init(document.getElementById('other10')), {
dataArr: dataArr,
linkArr: linkArr2
});
gaugeChart(this.$Echarts.init(document.getElementById('other11')), 0.8);
}


 1201
1201


 被折叠的 条评论
为什么被折叠?
被折叠的 条评论
为什么被折叠?
 到【灌水乐园】发言


