


import cv2
import matplotlib.pyplot as plt

# 读取图像
image_path = r'D:\Downloads\dataset\coco\000000000036.jpg' # 图像路径
image = cv2.imread(image_path)
height, width, _ = image.shape

# 读取YOLO格式的标注文件
annotation_path = r'D:\Downloads\dataset\coco\000000000036.txt' # yolo标注txt文件路径
with open(annotation_path, 'r') as file:
    lines = file.readlines()

# 解析标注信息并绘制边界框
for line in lines:
    class_id, x_center, y_center, box_width, box_height = map(float, line.strip().split())

    # 转换为图像坐标
    x_center *= width
    y_center *= height
    box_width *= width
    box_height *= height

    # 计算左上角和右下角的坐标
    x1 = int(x_center - box_width / 2)
    y1 = int(y_center - box_height / 2)
    x2 = int(x_center + box_width / 2)
    y2 = int(y_center + box_height / 2)

    # 绘制矩形框
    cv2.rectangle(image, (x1, y1), (x2, y2), (0, 255, 0), 2)
    # 你可以选择在框上标记类别ID
    cv2.putText(image, str(int(class_id)), (x1, y1 - 10), cv2.FONT_HERSHEY_SIMPLEX, 0.9, (0, 255, 0), 2)

# 使用matplotlib显示图像
plt.imshow(cv2.cvtColor(image, cv2.COLOR_BGR2RGB))
plt.title('Image with Bounding Boxes')
plt.axis('off')  # 不显示坐标轴
plt.show()

# 保存带框的图像
output_image_path = r'D:\Downloads\dataset\coco\output_image.jpg' # 保存带框图像的路径
cv2.imwrite(output_image_path, image)
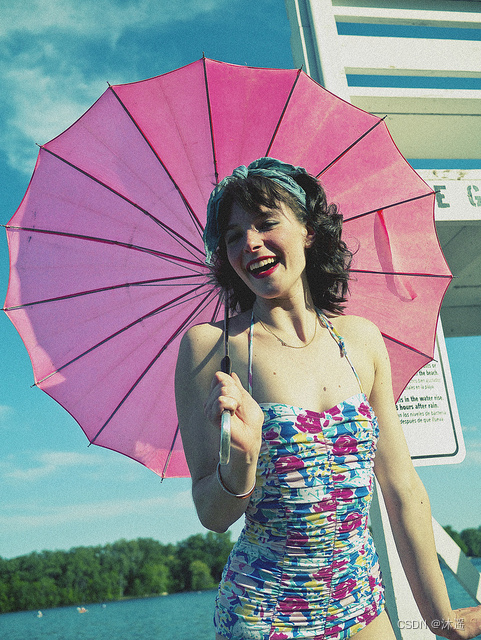
原图像为:
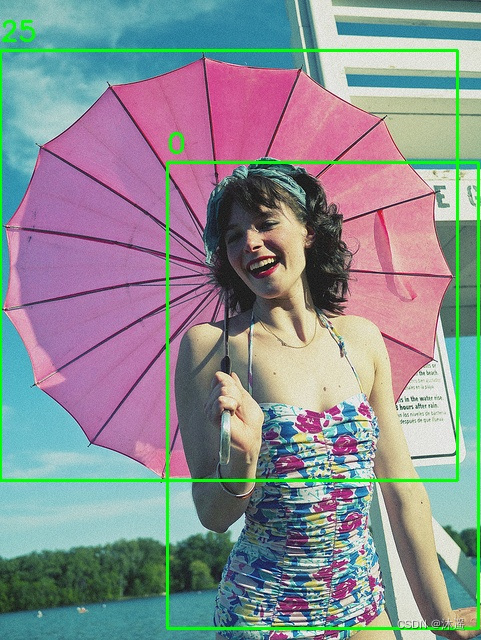
带标注框的图像为:


 910
910

 被折叠的 条评论
为什么被折叠?
被折叠的 条评论
为什么被折叠?
 到【灌水乐园】发言


