


Question
Chest radiographs are the best method for diagnosing pneumonia but are often not available in developing countries. Therefore, in 1990 the World Health Organization developed guidelines for diagnosis of non-severe pneumonia that comprised clinical symptoms of fast breathing alone. However, fast breathing can have causes other than pneumonia, and thus children who are given a diagnosis of non-severe pneumonia on the basis of fast breathing alone may receive antibiotics unnecessarily.
Children aged 2 to 59 months with non-severe pneumonia diagnosed on the basis of the WHO guidelines were invited to participate from outpatient departments of six hospitals in Pakistan. In total 2000 children were enrolled, for whom 1848 chest radiographs were available for assessment. Two consultant radiologists used standardised criteria to evaluate the chest radiographs, with no clinical information available to them. The primary outcome was diagnosis of pneumonia (absent or present) from chest radiographs.
Cohen’s coefficient κ for agreement between the two radiologists in their diagnoses was 0.46. A small number of children were given a diagnosis of bronchiolitis. The researchers concluded that most children with non-severe pneumonia diagnosed on the basis of the current WHO definition had normal chest radiographs.
Which of the following statements, if any, are true?
·a) Cohen’s κ was calculated as the proportion of overall agreement between radiologists in their diagnoses.
·b) If no agreement existed between the radiologists, κ would equal zero.
·c) The agreement between the radiologists in their diagnoses can be interpreted as very good.
提示:正确答案只有一个。
Answer
Statement b is true, while a and c are false.
Cohen’s coefficient κ is a measure of agreement between the two radiologists in their diagnoses made on the basis of the chest radiographs. The coefficient is not calculated as the proportion of radiographs for which there was overall agreement in diagnosis (a is false). Cohen’s κ is a measure of agreement between the radiologists taking into account agreement that would have occurred through random variation—that is, the expected agreement even if the radiologists showed no concordance in their diagnostic criteria. It was derived by comparing the overall observed and expected proportions of agreement between the radiologists. The formula for Cohen’s κ can be found in most statistical texts.
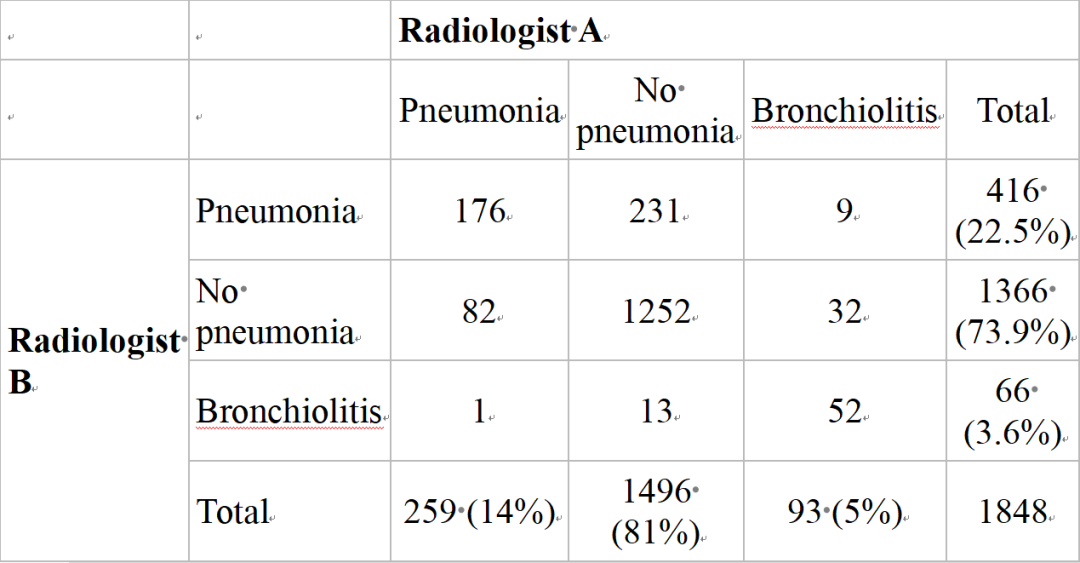
The cross tabulation of the radiologists’ diagnoses for the 1848 children made on the basis of their chest radiographs is shown in the table⇓. The overall percentage of agreement in diagnoses was [(176+1252+52)/1848]×100=80.1%. However, the overall percentage agreement may be misleading as a measure of agreement. Some agreement would have been expected through random variation—that is, if the two radiologists showed no concordance in how they achieved a diagnosis. To illustrate this, radiologist B diagnosed pneumonia in 416 children (22.5% of the total number) who had pneumonia according to the WHO guidelines. If the two radiologists showed no coherence in their diagnosis, we would expect radiologist A to diagnose pneumonia, no pneumonia, or bronchiolitis in these 416 children in the same proportions shown overall by radiologist A. In particular, radiologist A diagnosed pneumonia in 14% of the children, bronchiolitis in 5%, and no pneumonia in 81%. Therefore, if no concordance existed between the radiologists in their diagnoses, then simply at random we would expect radiologist A to diagnose pneumonia in 14% of the 416 children diagnosed as having pneumonia by radiologist B—that is, 58.24 children. Expected frequencies rarely take integer values but will always sum to the row and column marginal totals. Furthermore, of the 1366 children who radiologist B diagnosed as being without pneumonia, radiologist A would also be expected to diagnose 0.81×1366=1106.46 children without pneumonia simply at random. Finally, if no concordance existed between the radiologists in their diagnoses, then of the 66 children in whom radiologist B diagnosed bronchiolitis, radiologist A would also be expected to diagnose it in 0.05×66=3.3 children. The two radiologists would therefore have been expected to agree in their diagnoses for 58.24+1106.46+3.3=1168 children in total, even if they showed no concordance in their criteria for diagnosis. Therefore the overall expected percentage agreement that would have occurred randomly was (1168÷1848)×100=63.2%.
Radiologists’ diagnoses made on basis of chest radiographs of children who had non-severe pneumonia diagnosed according to WHO guidelines. Values are frequencies (percentages)
If perfect agreement existed between the radiologists then Cohen’s κ would have equalled 1, and if no agreement existed in the sense there was no concordance over that expected through random variation then κ would equal 0 (b is true). Theoretically Cohen’s κ can take any negative value, and this would occur if there was no agreement—for example, if the radiologists completely disagreed in their diagnoses.
It is difficult to quantify what value κ should be so as to constitute good agreement. This in part depends on the context of assessment and the clinical importance of agreement. It has been suggested that agreement is poor if κ is less than 0.2, fair if it is between 0.21 and 0.4, moderate if it is between 0.41 and 0.6, good if it is between 0.61 and 0.8, and very good if it is between 0.81 and 1 (c is false). It is possible to calculate a 95% confidence interval for the population parameter Cohen’s κ to provide a measure of accuracy of the sample estimate, although the researchers above did not do so.
Cohen’s κ was originally developed to provide a measure of agreement between two raters for a classification where disagreement between categories was equally likely. If the classification is on an ordinal scale and the categories have order, such as “poor,” “fair,” “good,” and “excellent,” then the κ coefficient will not provide the best measure of agreement. A weighted Cohen’s κ may be used that provides more weight to observations that disagree but are closer on the ordinal scale, with less weight given to the observations that disagree the most. The weight given to observations that represent disagreement between raters depends on how serious such disagreements are judged to be.
所以答案是选择 b
每天学习一点,你会更强大!


 607
607

 被折叠的 条评论
为什么被折叠?
被折叠的 条评论
为什么被折叠?
 到【灌水乐园】发言


