


1 前言
1-1 简介
DataFountain平台举办的比赛,赛题:风机叶片开裂故障预警。以下是比赛链接:风机叶片开裂故障预警 Competitions - DataFountain
1-2 任务背景
SCADA是风场设备管理、监测、和控制的重要系统,通过实时收集风机运行的环境参数、工况参数、状态参数和控制参数使风场管理者能够实时了解风电装备资产的运行和健康状态。基于SCADA数据建立叶片开裂模型,对早期叶片开裂故障进行告警,可以避免风场因叶片开裂导致的更大损失,提升风机运行稳定性,提升机组发电量。本质为分类任务,根据风力发电机给出的多维度信息确定是否会在一周内发生故障。难点在于有75个维度的特征信息,所以在此次任务中,选择使用经典机器学习算法xgboost完成。
1-3 数据介绍
其中比赛官网给出了风力发电机75个维度的信息,部分特征属性如下所示。
轮毂转速,轮毂角度,叶片1角度,叶片2角度,叶片3角度,变桨电机1电流,变桨电机2电流
叶片1电池箱温度,叶片2电池箱温度,叶片3电池箱温度,叶片1变桨电机温度,叶片2变桨电机温度,
叶片3变桨电机温度,叶片1变频器箱温度,叶片2变频器箱温度,叶片3变频器箱温度,叶片1超级电容电压,
叶片2超级电容电压,叶片3超级电容电压,驱动1晶闸管温度,驱动2晶闸管温度,驱动3晶闸管温度,驱动1输出扭矩,驱动2输出扭矩,驱动3输出扭矩
在大数据挖掘比赛中,除了模型的选择要到位,其特征工程的重要性也不言而喻,在特征工程中,特征选择是其中的重头戏,因为在大数据挖掘中,给出的数据特征数非常多,直接利用大量的特征开始进行模型训练,会非常耗时且效果并不好。因此特征选择就显得十分重要,特征选择需要挑选出那些有效的特征,从而代入到后面的训练模型中。而xgboost根据每个特征进行分裂构建树进行建模,检索每个属性的重要性得分。
2 任务实现
2-1 数据整合
比赛官方提供了多个csv文件作为训练集存放在train文件夹中,并且单独提供了train_labels.csv 作为用户训练的标注信息。首先需要将label与训练预料进行对应。
2-1-1 导入工具库
import pandas as pd
import numpy as np
import os
import torch
from tqdm import tqdm
from sklearn.preprocessing import scale
from sklearn.model_selection import train_test_split
import matplotlib.pyplot as plt
from sklearn.metrics import accuracy_score
from sklearn.metrics import recall_score
from matplotlib.font_manager import FontProperties
2-1-2 查看file_name与label
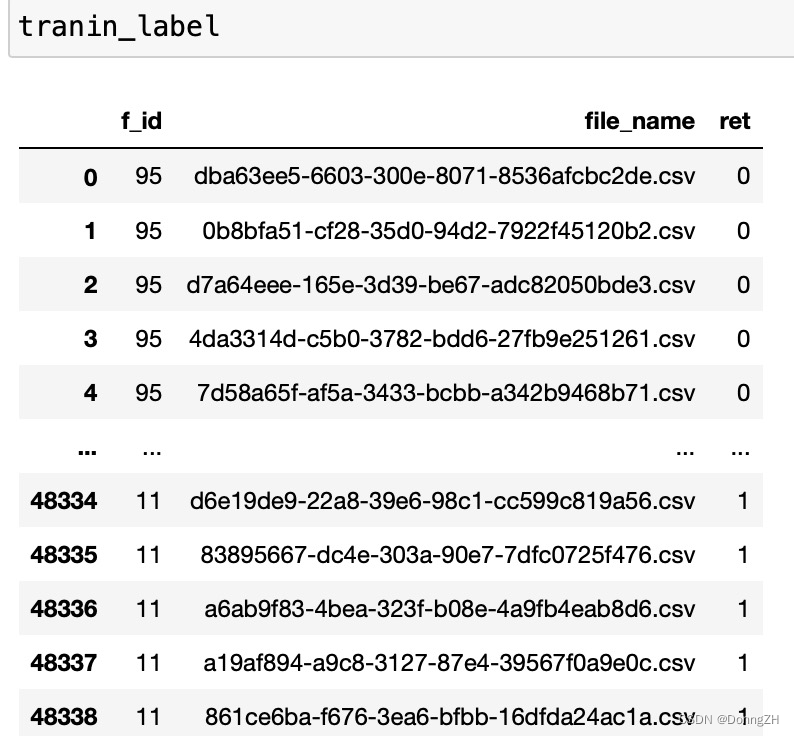
tranin_label = pd.read_csv('/home/zhenhengdong/WORk/Relation_Extraction/Jupyter_files/Codes/Untitled Folder/风机叶片开裂故障预警数据集/train_labels.csv')file_name字段表示的是csv的文件名,ret表示的对应文件名中所有数据的label。
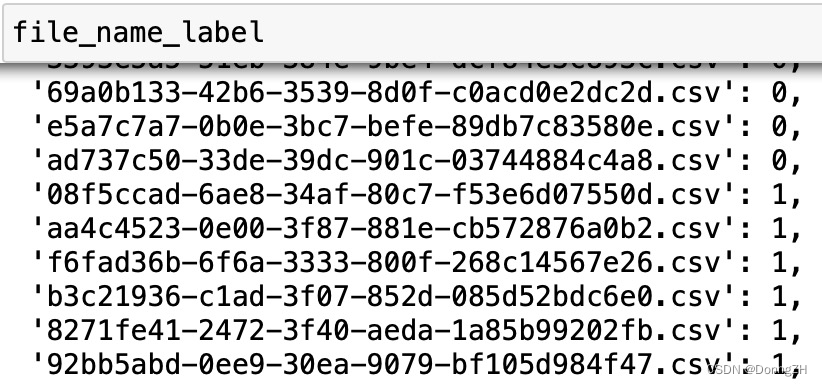
2-1-3 组合file_name与label的对应字典
file_name_label = {}
for index in tqdm(range(len(tranin_label))):
    file_name = tranin_label['file_name'][index]
    label = tranin_label['ret'][index]
    file_name_label[file_name] = label
查看csv文件与label的字典。
2-1-4 将训练数据的csv文件全部组合
#遍历获得文件
def FilesPath(path):
'''
path: 目录文件夹地址
返回值:列表,pdf文件全路径
'''
filePaths = [] # 存储目录下的所有文件名,含路径
for root,dirs,files in os.walk(path):
for file in files:
filePaths.append(os.path.join(root,file))
return filePaths
Total_file = FilesPath('/home/zhenhengdong/WORk/Relation_Extraction/Jupyter_files/Codes/Untitled Folder/风机叶片开裂故障预警数据集/train')
#将多个csv文件组合,并且将label字段添加
data = pd.DataFrame()
for file_path in tqdm(Total_file[:100]):
file_name = file_path.split('/')[-1]
label = file_name_label[file_name]
df = pd.read_csv(file_path,encoding='utf8')
df['label'] = [label]* len(df)
df_data = pd.DataFrame(df)
data = pd.concat([data,df_data])
# 重新设置索引 从0开始
data.reset_index(drop=True, inplace=True)
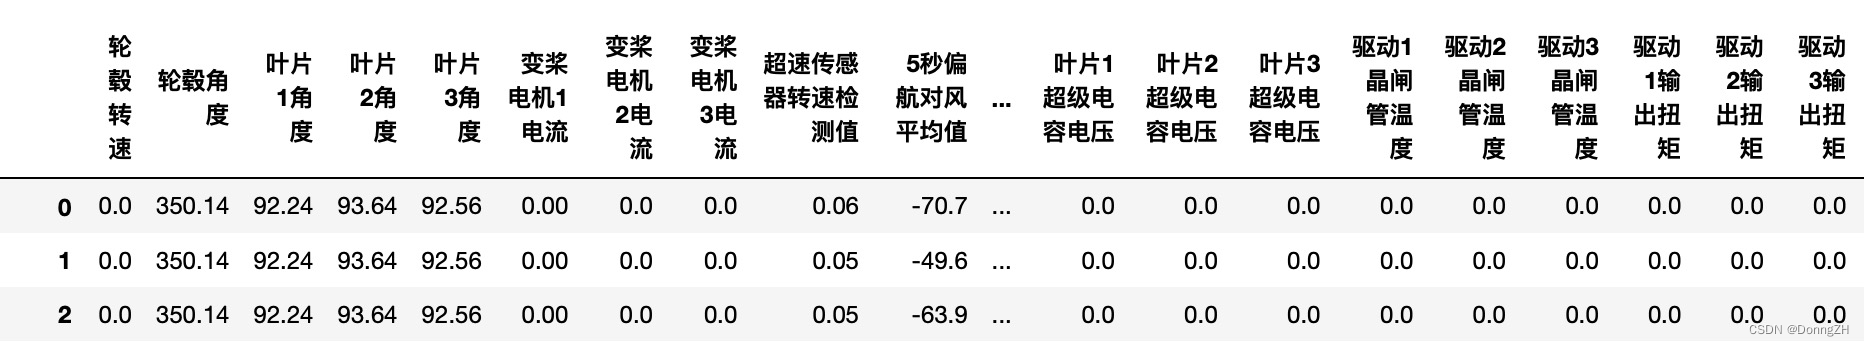
data.to_csv(Total_data_save_path,index = False,encoding='utf8')未整合label字段之前的数据。
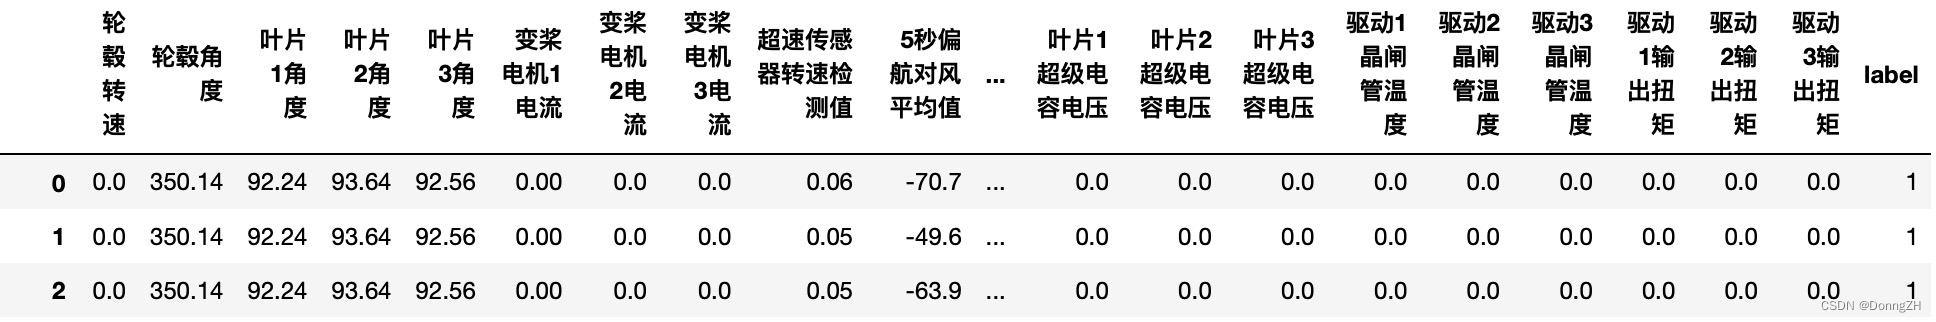
添加label之后的数据。
 2-2 Xgboost 任务实现
2-2-1 数据集划分
#读取数据
Total_data = pd.read_csv(Total_data_save_path)
#数据集划分并存储
train_data,test_data = train_test_split(Total_data,test_size=0.1, random_state=42)
train_data.to_csv(train_data_path,index=False,header=True,encoding="utf-8")
test_data.to_csv(test_data_path,index=False,header=True,encoding="utf-8")
2-2-2 np.loadtxt读取数据
所有字段的数据都为数值型,可以使用np.loadtxt()读取数据。
train_XY  = np.loadtxt(train_data_path, delimiter=',', skiprows = 1,dtype=np.float32)
test_XY = np.loadtxt(test_data_path, delimiter=',', skiprows = 1,dtype=np.float32)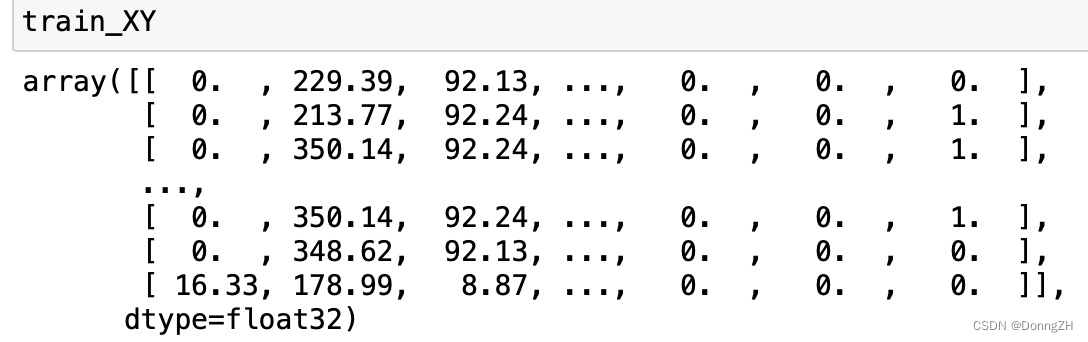
2-2-3 选取X与Y
将数据中的75个维度作为X,最后一列作为Y。
TrainX_data = torch.from_numpy(train_XY[:, :-1])
TrainY_data = torch.from_numpy(train_XY[:, [-1]])# 取最后1列

TestX_data = torch.from_numpy(test_XY[:, :-1])
TestY_data = torch.from_numpy(test_XY[:, [-1]])# 取最后1列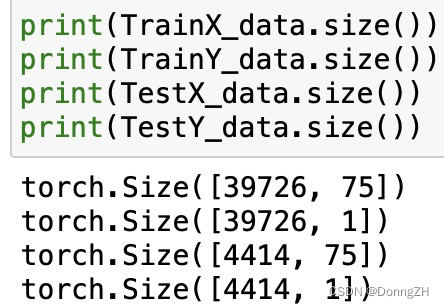
2-2-4 调用XGBClassifier模型
# plot learning curve
from xgboost import XGBClassifier
from sklearn.metrics import accuracy_score
from matplotlib import pyplot
# fit model no training data
model = XGBClassifier(
    max_depth=3, # 每一棵树最大深度,默认6;
    learning_rate=0.1, # 学习率,每棵树的预测结果都要乘以这个学习率,默认0.3;
    n_estimators=100,
    objective='reg:logistic')
eval_set = [(TrainX_data, TrainY_data), (TestX_data, TestY_data)]
model.fit(TrainX_data, TrainY_data, eval_metric=["error", "logloss"], early_stopping_rounds=10,eval_set=eval_set, verbose=True)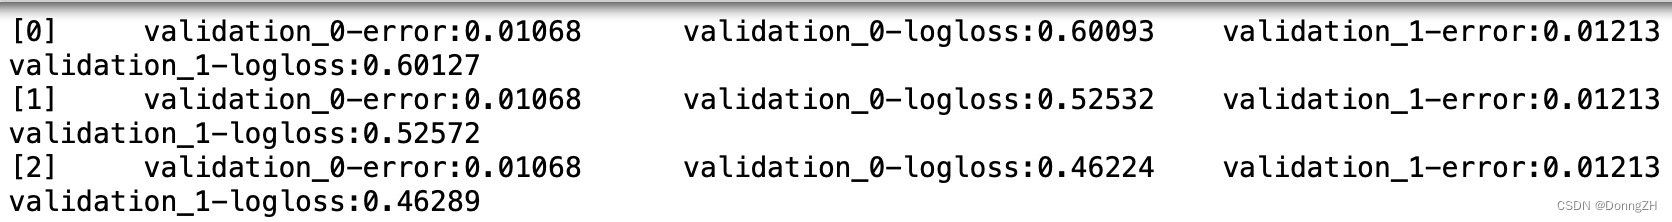
# make predictions for test data
y_pred = model.predict(TestX_data)
predictions = [round(value) for value in y_pred]
# evaluate predictions
accuracy = accuracy_score(TestY_data, predictions)
print("Accuracy: %.2f%%" % (accuracy * 100.0))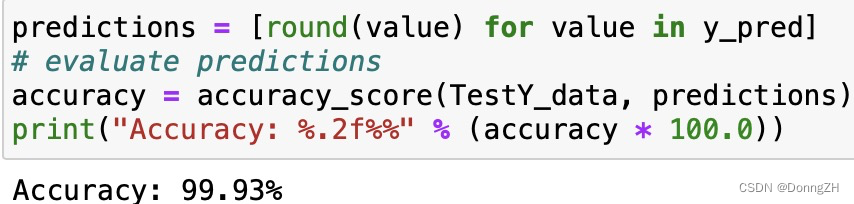
2-2-5 查看准召率
predictions = [round(value) for value in y_pred]
# evaluate predictions
accuracy = accuracy_score(TestY_data, predictions)
print("Accuracy: %.2f%%" % (accuracy * 100.0))
2-2-6 查看loss
# retrieve performance metrics
results = model.evals_result()
epochs = len(results['validation_0']['error'])
x_axis = range(0, epochs)
# plot log loss
fig, ax = pyplot.subplots()
ax.plot(x_axis, results['validation_0']['logloss'], label='Train')
ax.plot(x_axis, results['validation_1']['logloss'], label='Test')
ax.legend()
pyplot.ylabel('Log Loss')
pyplot.title('XGBoost Log Loss')
pyplot.show()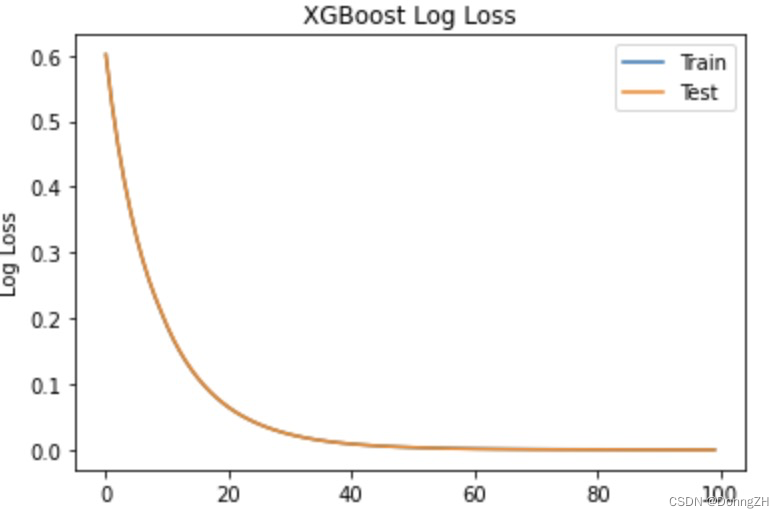
2-2-7 查看分类错误率
# plot classification error
fig, ax = pyplot.subplots()
ax.plot(x_axis, results['validation_0']['error'], label='Train')
ax.plot(x_axis, results['validation_1']['error'], label='Test')
ax.legend()
pyplot.ylabel('Classification Error')
pyplot.title('XGBoost Classification Error')
pyplot.show()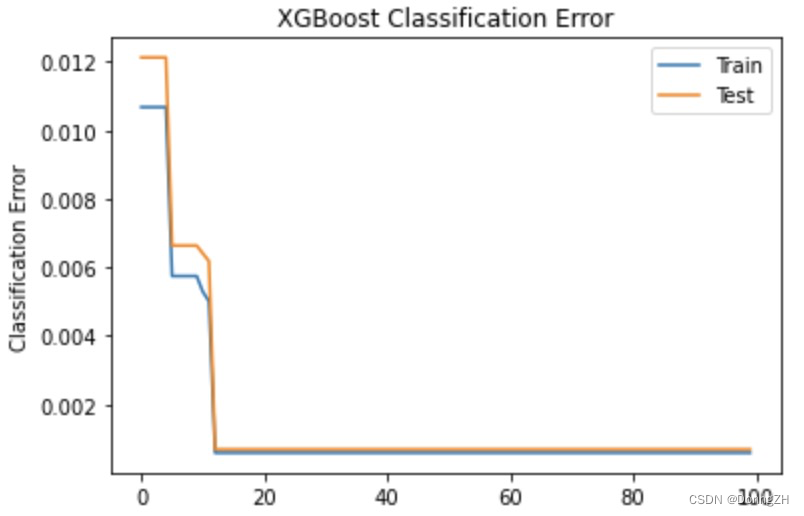
2-2-8 查看真实值与预测值
fig = plt.gcf()
fig.set_size_inches(6, 5)
myfont = FontProperties('SimSun')
plt.title('Prediction and GroundTruth', fontproperties=myfont, fontsize=15)
plt.scatter(np.arange(len(TestY_data)), TestY_data.tolist(), label='Prediction', s=20)
plt.scatter(np.arange(len(predictions)), predictions, label='GroundTruth', s=20)
plt.xlabel('', fontproperties=myfont, fontsize=15)
plt.ylabel('Power generation', fontproperties=myfont, fontsize=15)
plt.legend()
plt.show()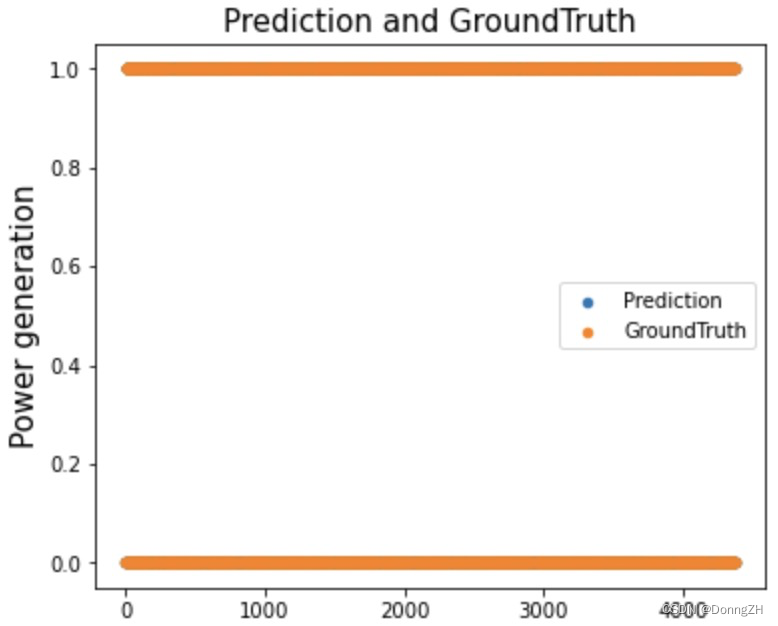
2-2-9 查看重要特征
from xgboost import plot_importance
plot_importance(model)
plt.show()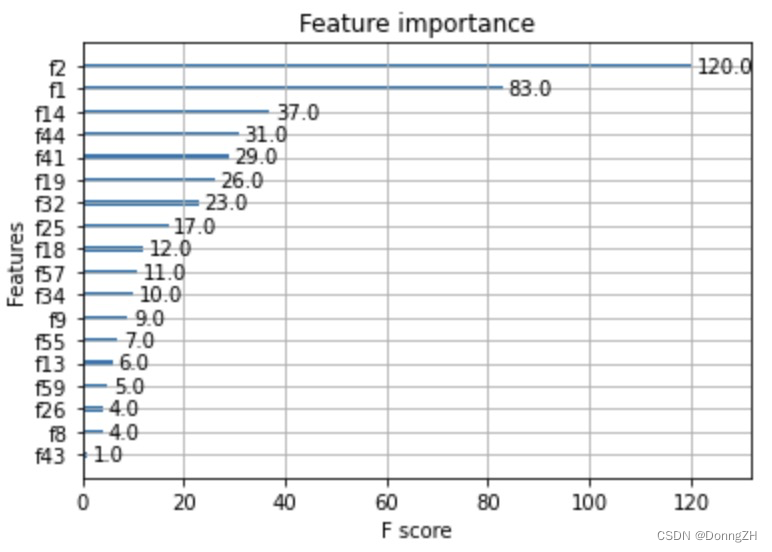
3 后记
XGboos在处理多维度X时候确实能打。


 2952
2952

 被折叠的 条评论
为什么被折叠?
被折叠的 条评论
为什么被折叠?
 到【灌水乐园】发言


