from pyecharts import options as opts
from pyecharts. charts import Funnel
from pyecharts. faker import Faker
data = list ( zip ( Faker. choose( ) , Faker. values( ) ) )
f = Funnel( )
f. add( "商品" ,
data,
sort_= "ascending" ,
gap= 2 )
f. set_global_opts( title_opts= opts. TitleOpts( title= "漏斗图示例" ) )
f. set_series_opts( label_opts= opts. LabelOpts( position= "inside" ) )
f. render( "./html/funnel_test.html" )
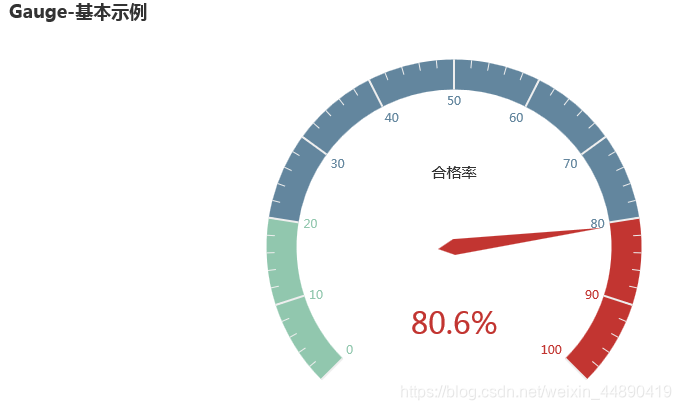
from pyecharts import options as opts
from pyecharts. charts import Gauge
g = Gauge( )
g. add( "" , [ ( "合格率" , 80.6 ) ] )
g. set_global_opts( title_opts= opts. TitleOpts( title= "Gauge-基本示例" ) )
g. render( "./html/gauge_test.html" )
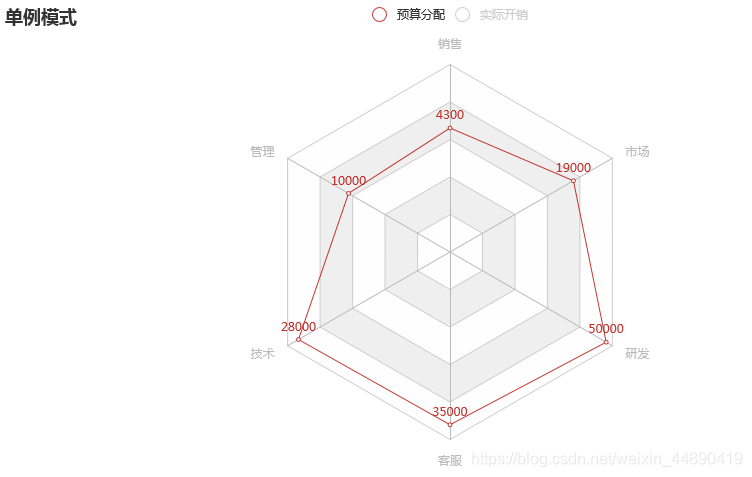
from pyecharts import options as opts
from pyecharts. charts import Radar
c_schema = [
{ "name" : "销售" , "max" : 6500 } ,
{ "name" : "管理" , "max" : 16000 } ,
{ "name" : "技术" , "max" : 30000 } ,
{ "name" : "客服" , "max" : 38000 } ,
{ "name" : "研发" , "max" : 52000 } ,
{ "name" : "市场" , "max" : 25000 } ]
v1 = [ [ 4300 , 10000 , 28000 , 35000 , 50000 , 19000 ] ]
v2 = [ [ 5000 , 14000 , 28000 , 31000 , 42000 , 21000 ] ]
radar = Radar( )
radar. add_schema( schema= c_schema,
splitarea_opt= opts. SplitAreaOpts(
is_show= True ,
areastyle_opts= opts. AreaStyleOpts( opacity= 1 ) )
radar. add( "预算分配" , v1)
radar. add( "实际开销" , v2)
radar. set_global_opts(
title_opts= opts. TitleOpts( title= "单例模式" ) ,
legend_opts= opts. LegendOpts( selected_mode= "single" ) )
radar. render( "./html/radar_f1.html" )
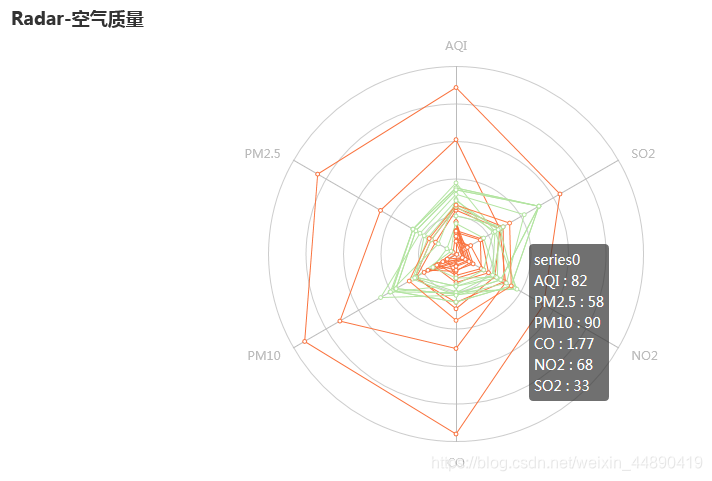
from pyecharts import options as opts
from pyecharts. charts import Radar
c_schaema = [
{ "name" : "AQI" , "max" : 300 , "min" : 5 } ,
{ "name" : "PM2.5" , "max" : 250 , "min" : 20 } ,
{ "name" : "PM10" , "max" : 300 , "min" : 5 } ,
{ "name" : "CO" , "max" : 5 } ,
{ "name" : "NO2" , "max" : 200 } ,
{ "name" : "SO2" , "max" : 100 } , ]
v1 = [
[ 55 , 9 , 56 , 0.46 , 18 , 6 , 1 ] , [ 25 , 11 , 21 , 0.65 , 34 , 9 , 2 ] ,
[ 56 , 7 , 63 , 0.3 , 14 , 5 , 3 ] , [ 33 , 7 , 29 , 0.33 , 16 , 6 , 4 ] ,
[ 42 , 24 , 44 , 0.76 , 40 , 16 , 5 ] , [ 82 , 58 , 90 , 1.77 , 68 , 33 , 6 ] ,
[ 74 , 49 , 77 , 1.46 , 48 , 27 , 7 ] , [ 78 , 55 , 80 , 1.29 , 59 , 29 , 8 ] ,
[ 267 , 216 , 280 , 4.8 , 108 , 64 , 9 ] , [ 185 , 127 , 216 , 2.52 , 61 , 27 , 10 ] ,
[ 39 , 19 , 38 , 0.57 , 31 , 15 , 11 ] , [ 41 , 11 , 40 , 0.43 , 21 , 7 , 12 ] ]
v2 = [
[ 91 , 45 , 125 , 0.82 , 34 , 23 , 1 ] , [ 65 , 27 , 78 , 0.86 , 45 , 29 , 2 ] ,
[ 83 , 60 , 84 , 1.09 , 73 , 27 , 3 ] , [ 109 , 81 , 121 , 1.28 , 68 , 51 , 4 ] ,
[ 106 , 77 , 114 , 1.07 , 55 , 51 , 5 ] , [ 109 , 81 , 121 , 1.28 , 68 , 51 , 6 ] ,
[ 106 , 77 , 114 , 1.07 , 55 , 51 , 7 ] , [ 89 , 65 , 78 , 0.86 , 51 , 26 , 8 ] ,
[ 53 , 33 , 47 , 0.64 , 50 , 17 , 9 ] , [ 80 , 55 , 80 , 1.01 , 75 , 24 , 10 ] ,
[ 117 , 81 , 124 , 1.03 , 45 , 24 , 11 ] , [ 99 , 71 , 142 , 1.1 , 62 , 42 , 12 ] ]
radar = Radar( )
radar. add_schema(
schema= c_schaema,
shape= "circle"
)
radar. add( "" , v1, color= "#f9713c" )
radar. add( "" , v2, color= "#b3e4a1" )
radar. set_series_opts( label_opts= opts. LabelOpts( is_show= False ) )
radar. set_global_opts( title_opts= opts. TitleOpts( title= "Radar-空气质量" ) )
radar. render( "./html/radar_test.html" )
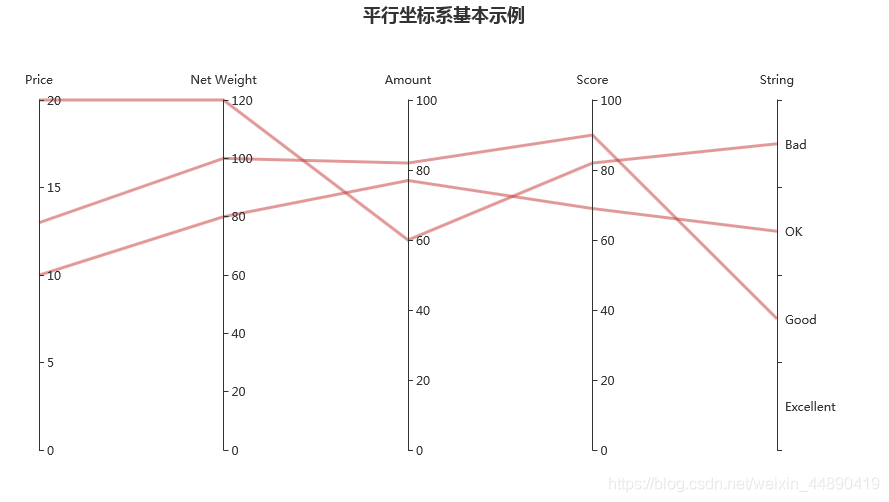
from pyecharts import options as opts
from pyecharts. charts import Parallel
parallel_axis = [
{ "dim" : 0 , "name" : "Price" } ,
{ "dim" : 1 , "name" : "Net Weight" } ,
{ "dim" : 2 , "name" : "Amount" } ,
{ "dim" : 3 , "name" : "Score" } ,
{
"dim" : 4 ,
"name" : "String" ,
"data" : [ "Excellent" , "Good" , "OK" , "Bad" ] ,
"type" : "category"
} ]
data = [
[ 12.99 , 100 , 82 , 90 , "Good" ] ,
[ 9.99 , 80 , 77 , 69 , "OK" ] ,
[ 20 , 120 , 60 , 82 , "Bad" ] ]
p = Parallel( )
p. add_schema( schema= parallel_axis)
p. add( "" , data)
p. set_global_opts(
title_opts= opts. TitleOpts( title= "平行坐标系基本示例" , pos_left= "center" ) )
p. set_series_opts( linestyle_opts= opts. LineStyleOpts( width= 3 , opacity= 0.5 ) )
p. render( "./html/parallel_base.html" )


 471
471


 被折叠的 条评论
为什么被折叠?
被折叠的 条评论
为什么被折叠?
 到【灌水乐园】发言


